Data analytics for the real estate industry
Buying, selling, renting, or developing? Harness our advanced BI software to maximize profit.


Why leave property decisions to chance?
Enter the world of data-driven decision-making with custom reports, real-time dashboards, and predictive insights.

Get ahead in the real estate market
- Take advantage of real-time insights for a minute-by-minute understanding of market trends.
- Utilize forecasting to anticipate market shifts and predict growth opportunities.
- Leverage geographical data insights to account for regional market shifts.

Streamline processes and boost efficiency
- Optimize property management, minimize waste, and reduce costs with AI-powered insights.
- Easily integrate and embed analytics into your real estate data product or customer portal.
- Keep your teams aligned with consistent, trusted analytics outputs.

Minimize risks, reduce costs
- Screen customers and tenants using detailed analysis to avoid potential issues.
- Utilize anomaly detection and alert triggers to mitigate incidents and manage inspections.
- Assess building data across multiple touch points to boost occupancy and reduce outlay.

Ondrej Langr
CPO at Sharry
Ondrej Langr
CPO at Sharry
Dive deep into our success stories


Examples of real estate dashboards
Check out some of the ways real estate professionals are using dashboards
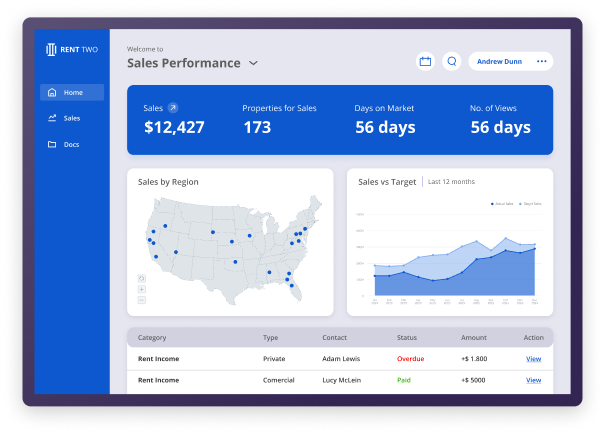
Sales performance
Real estate companies can get a birdseye view of sales KPIs, including current listings, properties sold, sales by agents, and targets met or unmet.
- Filter, customize, and drill into visualizations for deeper insights.
- Share, integrate, and embed company-wide and beyond.
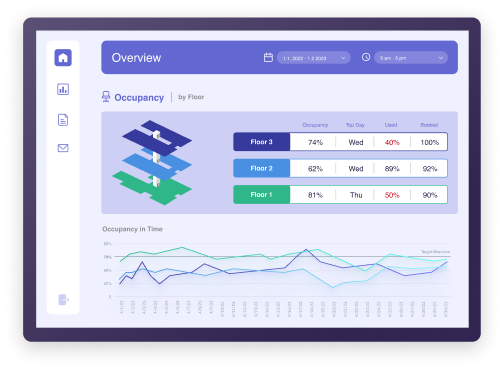
Comprehensive tenant information overview
Property agents can check the details of potential tenants to mitigate risk and save time on complicated background checks. Metrics, such as tenant background information and credit scores, can be adjusted based on requirements.
- Rich visualizations for at-a-glance understanding.
- User-friendly, drag-and-drop UI that anyone can use.
Discuss your use case with us
See how GoodData can help with your analytics goals.
Why choose our analytics platform?
Reasons why companies love our analytics platform include:
Smoothly implement in your ecosystem


Deploy in GoodData Cloud
GoodData Cloud is a SaaS product operated and maintained by us. Customers receive continuous code updates and it can be deployed in AWS, Azure, and multi-region.


Deploy Self-hosted
Self-hosted uses the same codebase as GoodData Cloud and is ideal for users needing enhanced security, governance, or control for data residency or regulatory compliance.


Integration
Open APIs and declarative SDKs — connect to code repositories and 3rd-party apps, embed anywhere.


Security and governance
Trusted analytics — certifications, inherited permissions, and cascading content changes for easy admin.


Accessibility
Accessible analytics — ensuring compliance and delivering inclusive experiences.


A trusted platform, loved by users


Common questions
Firstly, an analytics tool can help real estate professionals analyze market trends. Users can spot patterns in property prices, allowing for more accurate predictions and strategic decision-making.
The second benefit is risk management. Users can assess historical data and current market conditions, helping them evaluate potential risks associated with specific investments or locations to minimize unforeseen challenges.
Another benefit is efficiency. Analytics software can streamline the data analysis process. Users can get a comprehensive view of property-related information, including market demand, demographics, and property performance metrics. This is particularly beneficial for professionals looking to optimize their workflow.
Finally, access to accurate and up-to-date information allows for quick adaptation to market changes. This helps property market professionals stay ahead of the curve and capitalize on emerging opportunities.
Begin by assessing the tool's compatibility with your existing systems. If it seamlessly integrates with your current software and databases this will limit disruptions to your workflow and ensure a smooth transition.
User-friendliness is another crucial factor. Choose a BI tool that is easy to navigate and understand. A user-friendly interface enables team members to quickly adopt the tool without extensive training.
Scalability is another key consideration. The tool should be capable of handling increased data volume and complexity as your real estate requirements expand. This will ensure your BI solution stays effective in the long term.
Prioritize BI tools with robust security features. Look for encryption capabilities, secure access controls, and compliance with industry regulations to protect your data from unauthorized access or breaches.
Lastly, evaluate the pricing structure and take into account factors such as licensing fees, maintenance costs, and potential hidden expenses. Choose a tool that aligns with your budget while providing the necessary features and capabilities to meet your real estate analytics requirements.
AI algorithms analyze vast amounts of data, including market trends and property attributes. This can help real estate professionals make informed decisions regarding property pricing and investment. AI is also useful for predictive analytics as it can forecast market trends and identify potential opportunities.
Another benefit of AI and advanced analytics is that it can improve the customer experience. AI-powered chatbots can handle customer inquiries, providing quick responses. Additionally, analytics tools can help you understand customer preferences and behaviors, allowing for personalized services and targeted marketing strategies.
AI and advanced analytics can also assess and mitigate risks associated with real estate investments by analyzing market fluctuations, economic indicators, and historical performance data. This proactive approach enables you to make more informed decisions and minimize potential setbacks.
Lastly, AI can enhance operational efficiency via automation. By streamlining routine tasks, such as data entry and analysis, AI allows your team to focus on more strategic aspects of real estate management. This increased efficiency not only saves time but also reduces the likelihood of human errors, contributing to more effective real estate operations.
Data visualization transforms complex data into easy-to-understand visuals, such as charts and graphs, allowing real estate professionals to grasp trends and insights at a glance.
By visually presenting data on property prices, market trends, and other relevant factors, professionals can quickly identify patterns and fluctuations. This visual clarity helps in making informed decisions about buying, selling, or investing in real estate.
Additionally, data visualization can help users understand property performance metrics. Visual representations of key indicators, like occupancy rates or rental yields, make it easier to assess the health and profitability of real estate assets. This allows for quicker identification of underperforming properties or areas for potential improvement.
Data visualization simplifies the communication of complex data during presentations, allowing stakeholders to make it accessible to individuals with varying levels of expertise. This leads to better collaboration and ensures everyone involved is on the same page.
Data visualization can also help in identifying geographic trends. Maps and spatial visualizations help professionals analyze real estate data based on location, enabling them to see regional patterns, demographic trends, and potential areas of growth.
Try GoodData yourself
See how GoodData can help with your analytics goals