Data analytics for manufacturing
Increase productivity and profitability with better visibility into all your manufacturing data.
Transform your operations with advanced analytics software
Empower your organization with fresh insights
- Quickly access and interpret real-time data to stay ahead of potential issues.
- Provide essential insights to everyone, from corporate teams to shop floor workers and distributors.
- Facilitate fast, proactive, data-driven decision-making.
Gain comprehensive production lifecycle visibility
- Integrate data sources into a single data management system for a complete view of the entire manufacturing lifecycle.
- Rapidly connect, merge, and analyze data from sensors, devices, and business systems for insights into operational and business KPIs.
- Enhance agility and accelerate speed-to-market.
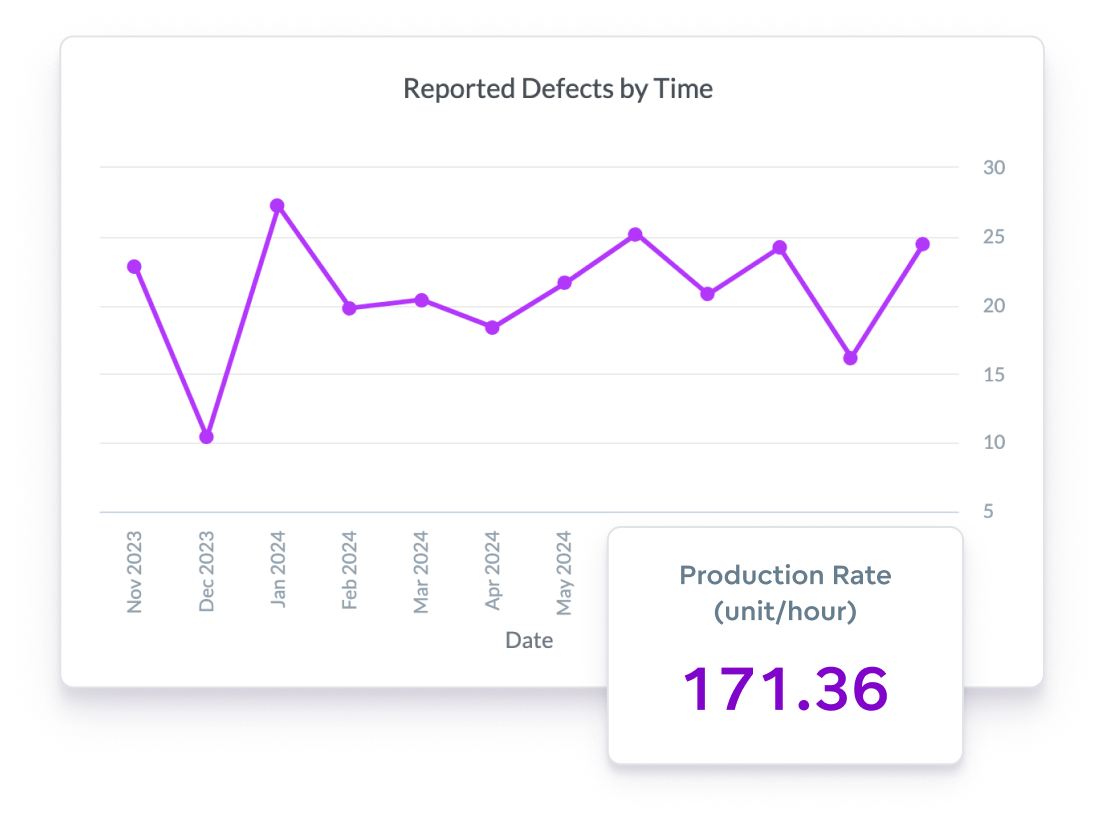
Increase operational efficiency
- Consolidate data from across the enterprise as well as external sources.
- Integrate information from your supply chain, manufacturing, IoT, and distribution channels to uncover valuable insights and drive operations.
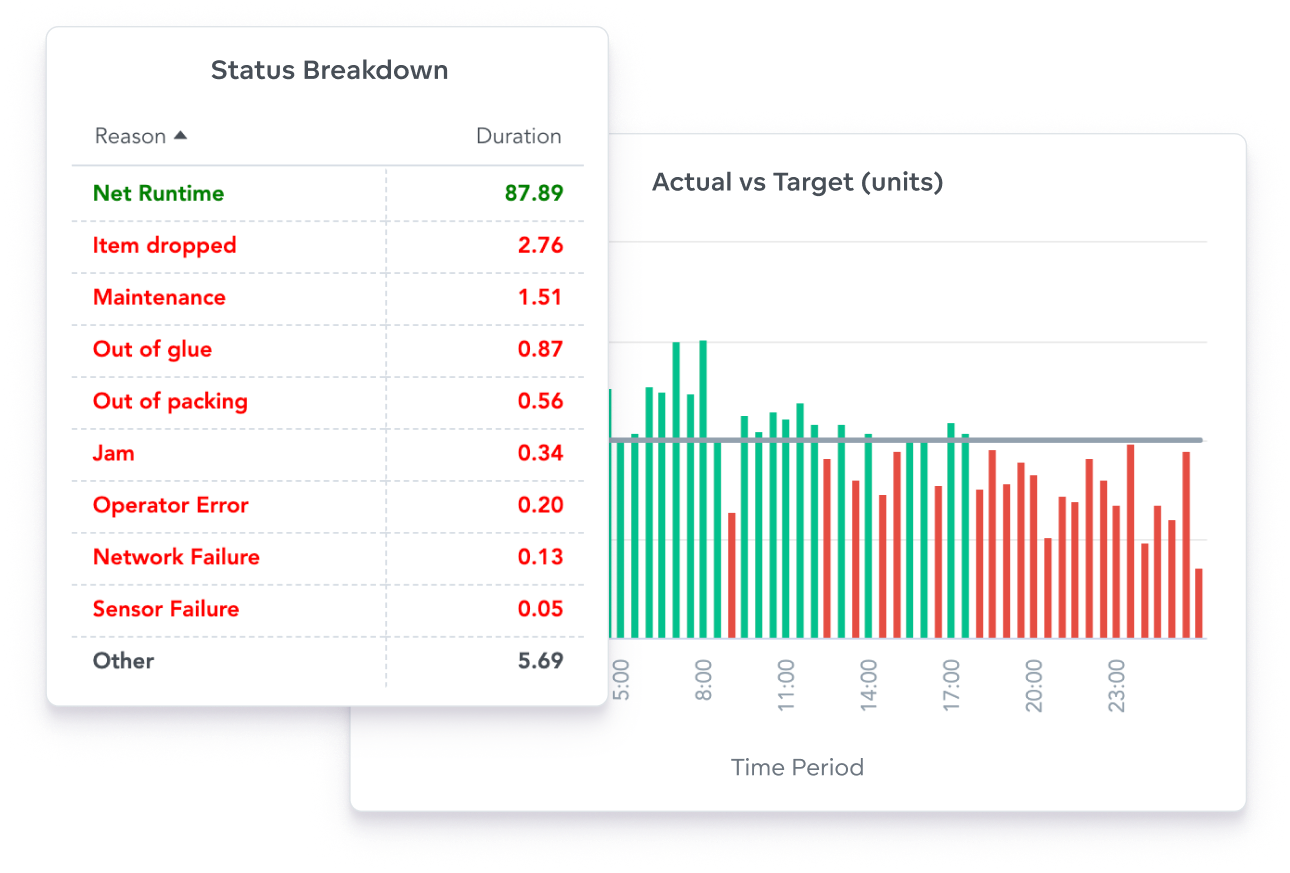
Enhance data reach and value
- Effortlessly share important data with vendors, customers, and partners.
- Ensure transparency throughout the entire value chain - drive action through applications and workflows.
Dive deep into our success stories
Examples of manufacturing dashboards
See how organizations are harnessing manufacturing dashboards to control, monitor, and optimize production output.
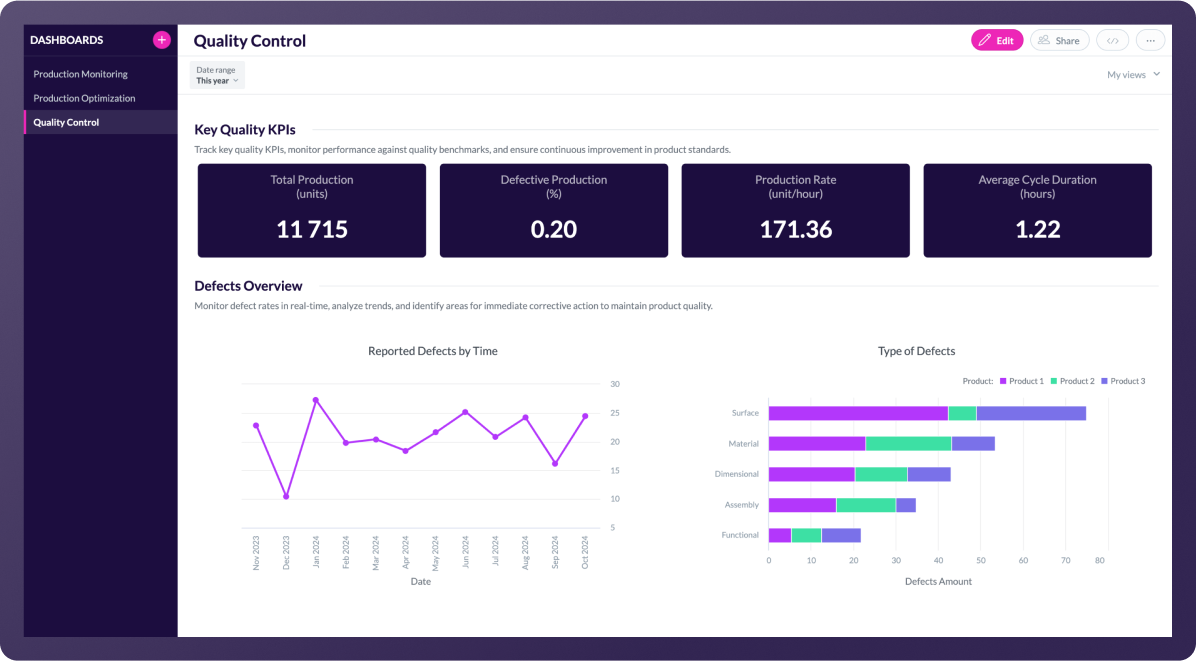
Track manufacturing standards
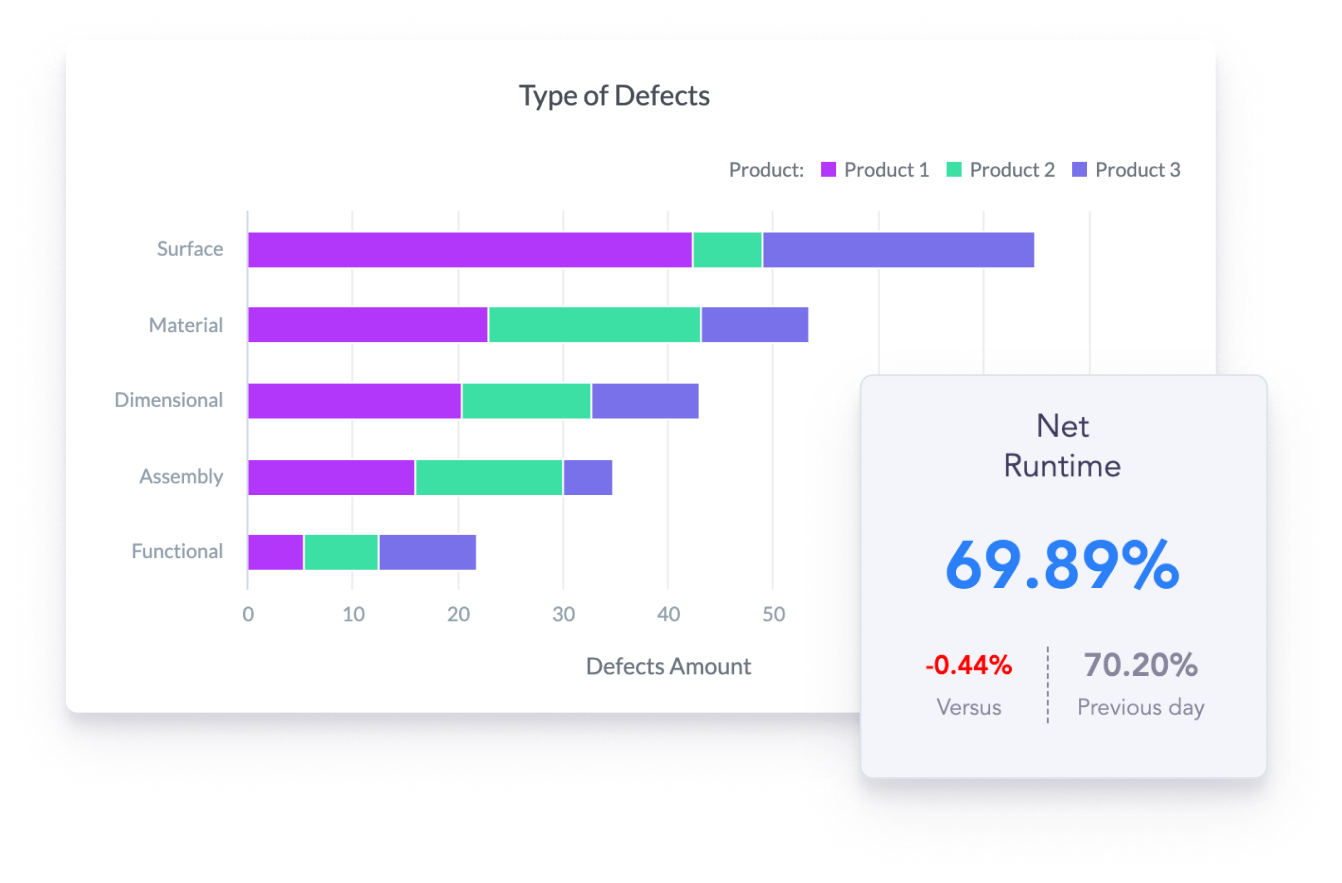
Includes indicators like defect rates, yield percentages, downtime, and compliance with quality standards. It helps teams to identify issues, track performance, and make data-driven decisions to improve product quality.
- Drill into data to discover further insights.
- Multiple visualization options to emphasize key figures.
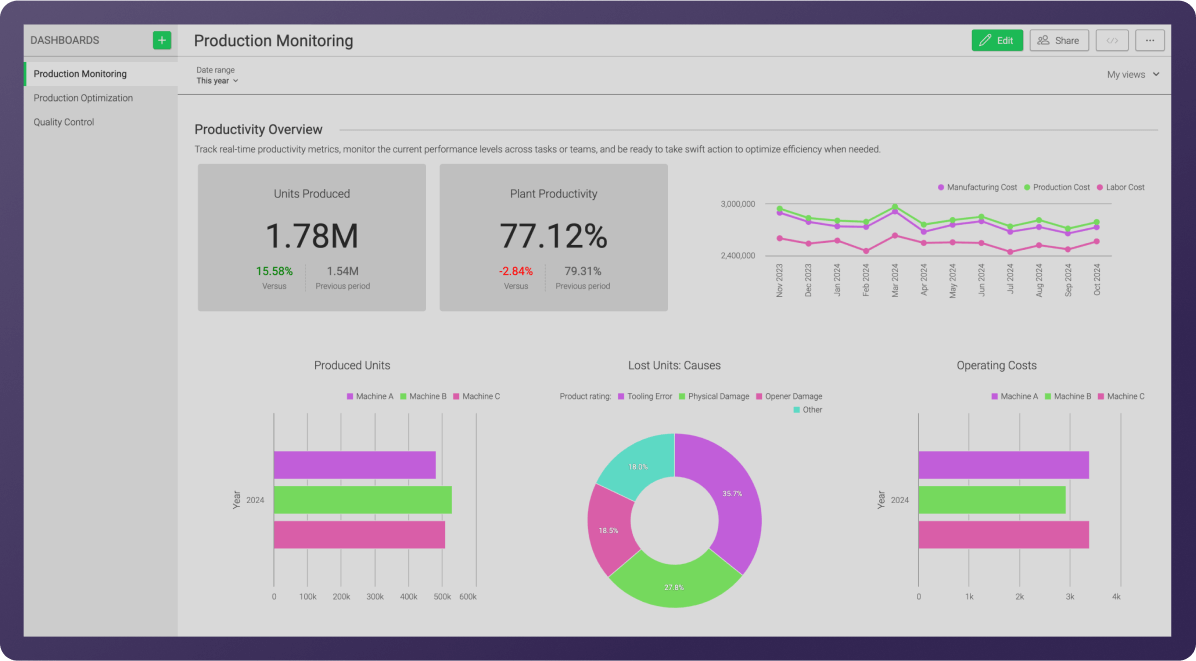
Comprehensive overview of manufacturing operations
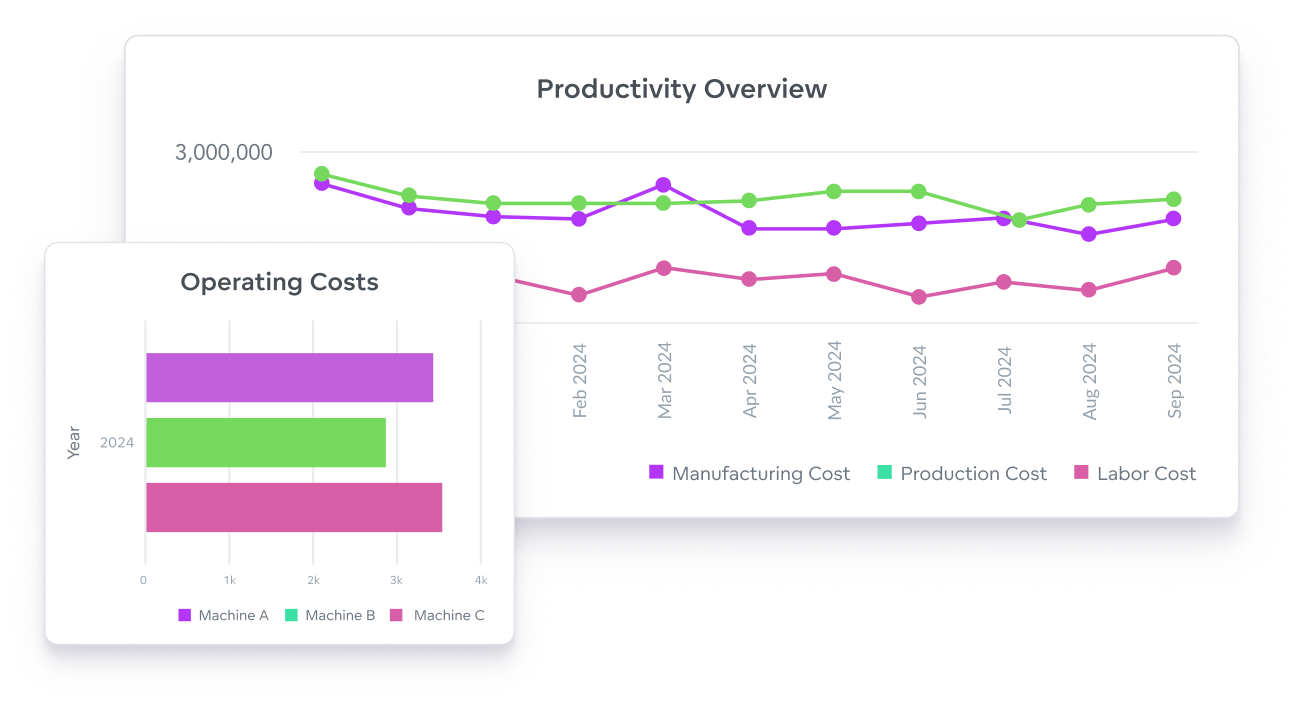
Tracks and displays real-time data related to the performance and efficiency of manufacturing operations. Aggregates key metrics such as production rates, machine utilization, downtime, output quality, and work-in-progress across the production line.
- Easy to share with management and stakeholders.
- Fully customizable to match your brand.
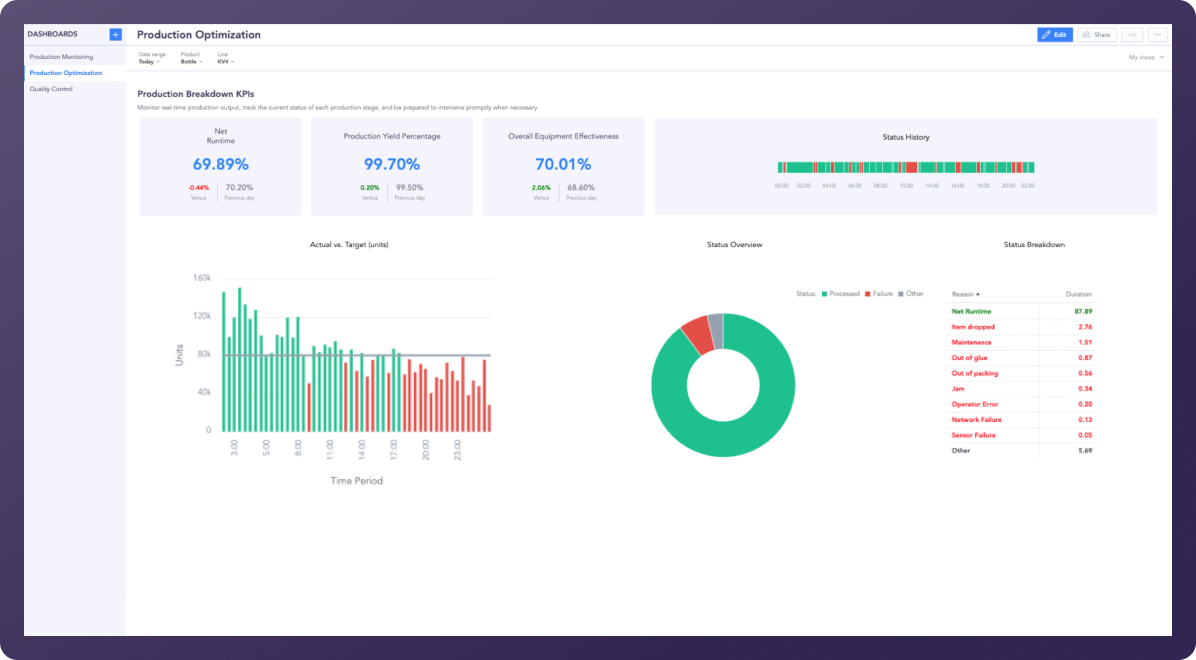
Enhance production processes
With a product optimization dashboard you can monitor real-time production output to improve manufacturing processes and troubleshoot issues before they grow. KPI’s may include net run time, production yield, and equipment effectiveness.
- Get real-time alerts on critical changes or issues.
- Apply filters to view specific segments or time periods.
Discuss your use case with us
See how GoodData can help with your analytics goals.
Why choose our analytics platform?
Reasons why companies love our analytics platform include:
Smoothly implement in your ecosystem


Deploy in GoodData Cloud
GoodData Cloud is a SaaS product operated and maintained by us. Customers receive continuous code updates and it can be deployed in AWS, Azure, and multi-region.


Deploy Self-hosted
Self-hosted uses the same codebase as GoodData Cloud and is ideal for users needing enhanced security, governance, or control for data residency or regulatory compliance.


Integration
Open APIs and declarative SDKs — connect to code repositories and 3rd-party apps, embed anywhere.


Security and governance
Trusted analytics — certifications, inherited permissions, and cascading content changes for easy admin.


Accessibility
Accessible analytics — ensuring compliance and delivering inclusive experiences.




A trusted platform, loved by users




Common manufacturing analytics questions
There are several things to consider when deciding on an analytics tool. Here's a step-by-step guide to help you make the right choice for your manufacturing business:
- Define your requirements: Start by clearly defining your analytics requirements. Identify the specific use cases and key performance indicators (KPIs) you want the BI tool/analytics platform to support.
- Evaluate features and functionality: Look for BI tools that offer features and functionality tailored to manufacturing analytics. Key features to consider include data visualization options, ad-hoc reporting, predictive analytics, drill-down capabilities, and rich integration options.
- Scalability and flexibility: Choose an analytics platform that can scale as your requirements change. Consider whether the tool supports flexible data integration from multiple sources.
- Ease of use: Choose a BI tool that is user-friendly and intuitive, allowing manufacturing professionals with varying levels of technical expertise to easily access and analyze data. Look for features such as drag-and-drop interfaces, customizable dashboards, and self-service analytics capabilities.
- Data security and governance: Look for a tool with the highest standards of data security and privacy.
- Vendor reputation and support: Read customer reviews, case studies, and analyst reports to assess the vendor's reliability, customer satisfaction, and level of support.
- Cost considerations: Evaluate the BI tool's total cost of ownership (TCO), including licensing fees, implementation costs, training expenses, and ongoing support and maintenance costs. Choose a tool that offers transparent pricing and meets your budget constraints.
Advanced manufacturing analytics typically includes several key features:
- Data Integration: Seamless integration of data from multiple sources such as ERP systems, supply chain data, and production data to provide a comprehensive view.
- Real-Time Data Processing: Immediate data collection and analysis from various sources, such as sensors, machines, and IoT devices, for timely insights.
- Predictive Analytics: Use of machine learning and statistical models to predict future trends, maintenance needs, and potential production issues.
- Prescriptive Analytics: Recommendations for optimal actions based on data analysis to improve efficiency and decision-making.
- Visualization Tools: Advanced dashboards and visualization tools that present data in an easily understandable format, helping stakeholders to quickly grasp insights.
- Customizable Reports: Generation of tailored reports to meet the specific needs of different stakeholders, from operators to executives.
- Anomaly Detection: Automated identification of deviations or unusual patterns in the production process to prevent defects and downtime.
- Scalability: Ability to scale the analytics platform to handle growing amounts of data and complexity as the manufacturing operations expand.
- Security and Compliance: Ensuring data security and compliance with industry regulations and standards.
- Collaboration Tools: Features that facilitate collaboration among different departments and external partners through shared insights and data.
Try GoodData yourself
See how GoodData can help with your analytics goals


