Data analytics often comes wrapped in a cloak of high-tech functionalities and intimidating buzzwords. This can make integrating analytics into your company’s operations seem overwhelming. In this guide, we strip away the complexity to deliver the key insights and practical steps you need to successfully implement data analytics in your organization. Whether you're starting from scratch or looking to enhance your current capabilities, this guide will provide you with clear, actionable strategies to harness the power of data and drive your business forward.
Step 1: Identify what you need
Before diving into implementation, it's crucial to pinpoint your specific analytics needs. This first step will guide your strategy and ensure your efforts align with your overall objectives. Key questions to consider include:
- What are your business objectives? Are you looking to improve operational efficiency, enhance customer experience, increase revenue, innovate with new products, or benefit from a combination of these? What key performance indicators (KPIs) will you use to measure the success of your new analytics implementation?*
- What are your data requirements? What type of data do you currently have access to? Do you have structured data (databases, spreadsheets) or unstructured data you need to harness? Are the data static or dynamic (incremental)? Are there external data sources that could provide valuable insights? Do you have a full data pipeline in place?*
- Who will be the primary users of the analytics? Will your analytics be used internally (within your organization) or are they customer-facing? What are your users' data literacy levels?*
- What analytics tools and technology do you currently have? What are your data storage and processing capabilities (if any)? Do you have analytics specialists on your team?*
Hot button topic! Should you build your analytics solution in-house?
Software companies and other established organizations with skilled engineering and data operations teams might wonder whether it would be better to design and build their own solution. However, buying an analytics solution is generally more advantageous for most businesses due to its cost-effectiveness, rapid deployment, and access to vendor support and regular updates. This allows organizations to quickly implement robust analytics capabilities without the significant time, cost, and expertise required to build a custom solution from scratch. The exception is if your company has the huge resources required to create a whole new analytics infrastructure – and the specialist skills to maintain and update it. Check out Build vs. Buy for more on this.
Step 2: Choose a suitable analytics vendor
Now that you have a clear understanding of what you need your analytics solution to accomplish, you can move on to selecting the right vendor. This step involves evaluating various solutions based on critical factors to ensure they align with your business goals.
One thing you should have become clear on through the first step is whether you require external or internal analytics.
In a nutshell, internal analytics is for internal teams and stakeholders. Its goal is to give them access to data and insights for better decision-making, moving away from guesswork. This use case typically employs both business intelligence (BI) and analytics, helping companies create a data-driven culture. While not directly generating profit, internal analytics supports decision-making that drives business growth.
External analytics, or customer-facing analytics, serves customers and partners. The goal is to provide them with analytics and reporting tools. Depending on the use case, customers or partners may or may not pay for this service. The data interfaces (dashboards and visualizations) are public-facing, representing your company. The ability to swiftly provide accurate charts and dashboards is crucial, as delays can directly impact customer satisfaction and your company's reputation.
Why is this distinction so important? Because it will have a huge effect on the features you’ll want to look out for when choosing a solution — as the table below shows:
Recommended features based on analytics use case
Self-service analytics
Internal analytics
Must-have
External analytics
Must-have
Interface white labeling and theming customizations
Internal analytics
Nice-to-have
External analytics
Must-have (particularly for embedded analytics)
Full interface embedding and advanced interface customization
Internal analytics
Nice-to-have
External analytics
Must-have for most cases
Flexible architecture for scalability
Internal analytics
Nice-to-have (however, for companies experiencing growth, this is a must-have)
External analytics
Must-have (limiting your own customers or partners could directly impact your business results)
Advanced security
Internal analytics
Must-have (particularly if you are a global company or process sensitive data)
External analytics
Must-have
Infrastructure and data source connections
Internal analytics
Must-have
External analytics
Must-have
Flexible deployment options
Internal analytics
Nice-to-have
External analytics
Must-have for most cases
Now you understand some of the key features to look out for in relation to your use case, let’s take a look at some of the other terms you might encounter when evaluating different analytics solutions and examine why they’re so important.
1. Embedded analytics
Embedded analytics refers to integrating data analysis and visualization tools directly into existing applications, platforms, or workflows. Instead of users needing to switch between different systems to access data insights, embedded analytics provides these insights seamlessly within the software they are already using. This is often a crucial feature, so you’ll want to ask your vendor the right questions to make sure they have what you need.
Generally speaking, there are three levels of embedding:
- None required: All you need is an analytics tool where users can sign in and create visualizations using the data provided – directly within the tool. Examples of such solutions include Looker Studio or even Excel.
- White labeling and customized theming: White labeling, which customizes the analytics platform with your brand’s logo, colors, and details, is essential for B2B analytics. It helps organizations promote their own solutions rather than the analytics provider's brand. While less critical for internal teams, it can still be a valuable feature for many organizations.
- Full embedding and customization: Beyond white labeling, embedding analytics into your application or web portal ensures a seamless experience for end users, who won’t notice any difference between the applications. This approach is crucial for companies wanting to fully integrate analytics into their own solutions and offer a unified software product to customers or partners. Advanced developer tools will allow your organization to quickly build an application powered by the provider’s analytics engine, with a fully customizable and cost-efficient interface tailored to your needs. Typical embedding methods include iFrame, Web Components, and React SDK; we’ll talk more about these in step 5.
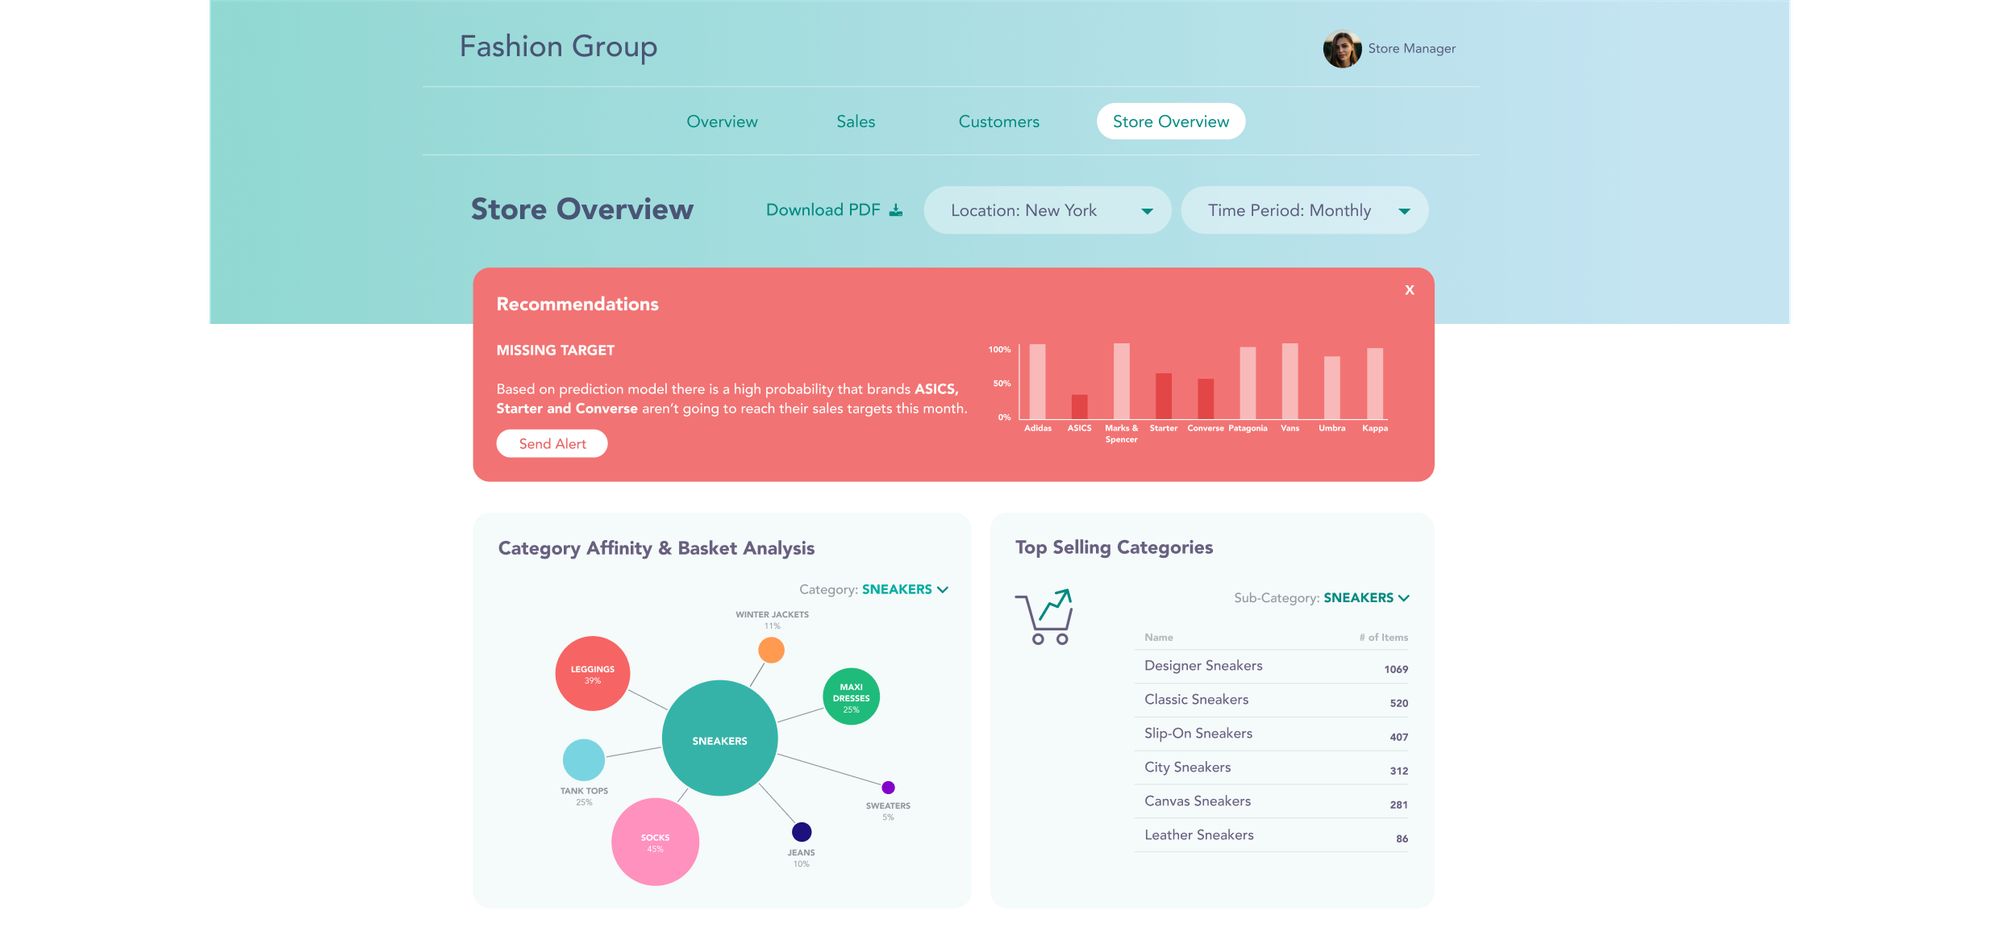
To find out more about which questions to ask potential analytics solutions in relation to embedding capabilities, check out: Embedded analytics: Key questions to ask any analytics vendor.
2. Headless BI
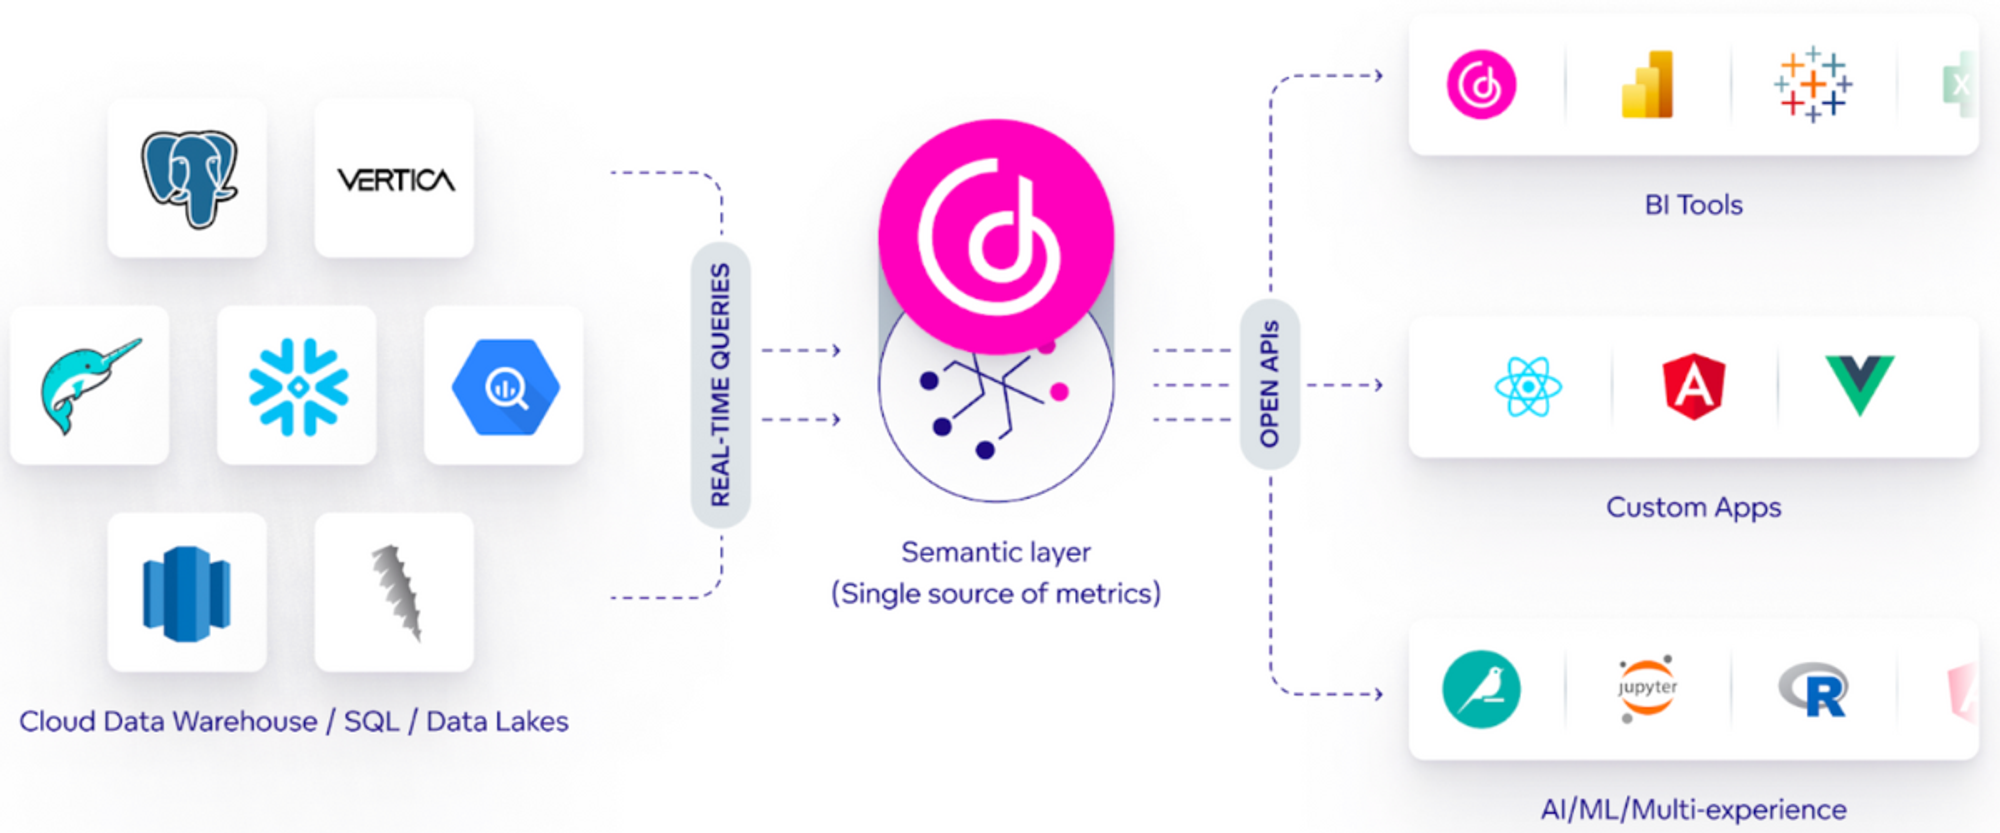
Headless BI is a type of BI architecture where the backend data processing and analytics functions are separate from the frontend presentation layer. Instead of providing built-in dashboards and visualizations, headless BI tools deliver data and insights through APIs or other integration methods.
You should consider choosing analytics software with headless BI because it can be more cost-effective and scalable. By focusing on the backend analytics capabilities and integrating with existing systems, you can avoid the expense and complexity of maintaining multiple BI tools. A key advantage of headless BI is that you’re not forced to use the new solution’s front end, so your legacy apps can still be used.
Data analysts can link multiple BI tools to the headless BI component to develop diverse metrics and dashboards. This setup makes it easy for them to gather and analyze data, address current issues, and support decision-making. Meanwhile, data scientists can use the same data and metrics with various tools for machine learning and predictive modeling, enabling them to tackle complex business problems effectively.
3. Analytics as code
Analytics as code refers to the practice of using code to define and execute data analysis processes. Instead of relying on manual, point-and-click tools, analysts write scripts to automate data collection, transformation, analysis, and visualization. This approach leverages programming languages like Python, R, or SQL, allowing for more precise, repeatable, and scalable analyses.
You should consider choosing software with analytics as code because it enhances efficiency and accuracy. Automating data workflows through code reduces the time and effort required for manual tasks, minimizes human error, and ensures consistent results. Additionally, it allows for the easy replication and modification of analyses, making it simpler to adapt to new data or changing business needs.
Analytics as code also promotes better collaboration and version control. Teams can more easily manage changes, track progress, and share scripts, facilitating seamless teamwork and knowledge sharing. This collaborative environment, combined with the ability to integrate analytics into broader data engineering and software development workflows, makes analytics as code a powerful choice if you’re aiming to leverage your data effectively.
4. Multitenancy
Multitenancy is a software architecture in which a single instance of a software application serves multiple customers or "tenants." Each tenant's data and configurations are kept separate and secure, even though they share the same underlying infrastructure. In a multi-tenant analytics platform, this means that various organizations or departments can use the same system while maintaining their distinct data sets, reports, and settings.
Choosing a multi-tenant analytics platform is important because it offers cost efficiency and scalability. Since multiple tenants share the same infrastructure, the overall cost of maintenance and updates is reduced, making it more affordable for each user. Additionally, this architecture allows the platform to scale easily, handling increased data loads and users without significant changes to the underlying system.
A multi-tenant platform also simplifies management and upgrades. Updates and new features can be deployed to all tenants simultaneously without needing individual customizations. This ensures that every user benefits from the latest enhancements and security updates, while also making it easier for administrators to manage and support the system.

5. Composability
Composability refers to the ability to build and customize analytics solutions by combining modular, interchangeable components. This approach allows you to piece together different tools and services based on your specific needs.
Getting a composable analytics platform is important for flexibility and adaptability. You can select and integrate the best tools for each part of your analytics workflow, ensuring that you only use what you need and can easily adjust as your requirements change. This means you can quickly incorporate new technologies, scale your analytics capabilities, and stay agile in response to evolving business needs.
Additionally, a composable analytics platform can be more cost-effective. Rather than a comprehensive, one-size-fits-all solution, you can optimize your spending by choosing and paying for only the components you need. This modular approach also allows for easier updates and maintenance, as you can upgrade or replace individual components without overhauling the entire system. For more on this, check out: What Is Composable Data and Analytics?
Top tip! Don’t forget to look beyond the product itself
An optimal analytics solution will offer the expertise of a professional services team who will partner with you in order to launch a successful analytical experience within your product or design a custom data product from scratch. They can help you through inception, development, testing, launch, and maintenance. The guidance of such a team can help you accelerate the implementation process and mitigate risk.
Interested in delving deeper into choosing a vendor? Check out How to evaluate BI tools to choose the best one.
Step 3: Prepare your infrastructure
Now you’ve selected your vendor, you’re ready to connect your data. A good analytics platform should connect to a range of data sources, such as databases like Snowflake, Amazon Redshift, and Google BigQuery. Some platforms can also link to data source managers like Dremio or Apache Drill, giving access to even more databases.
Ideally, your analytics platform should let you prepare and link your data once and then build multiple dashboards using that data rather than reconnecting it for each dashboard. Caching capabilities are an important feature, as they mean data can be quickly retrieved without needing to reprocess or recompute it each time it is requested. This speeds up response times and reduces the load on data sources.
After connecting your data, you'll need a Logical Data Model (LDM). This is a visual map showing how different data elements are related. The data model ensures that the data in your dashboards is accurate and consistent, providing a single source of truth.
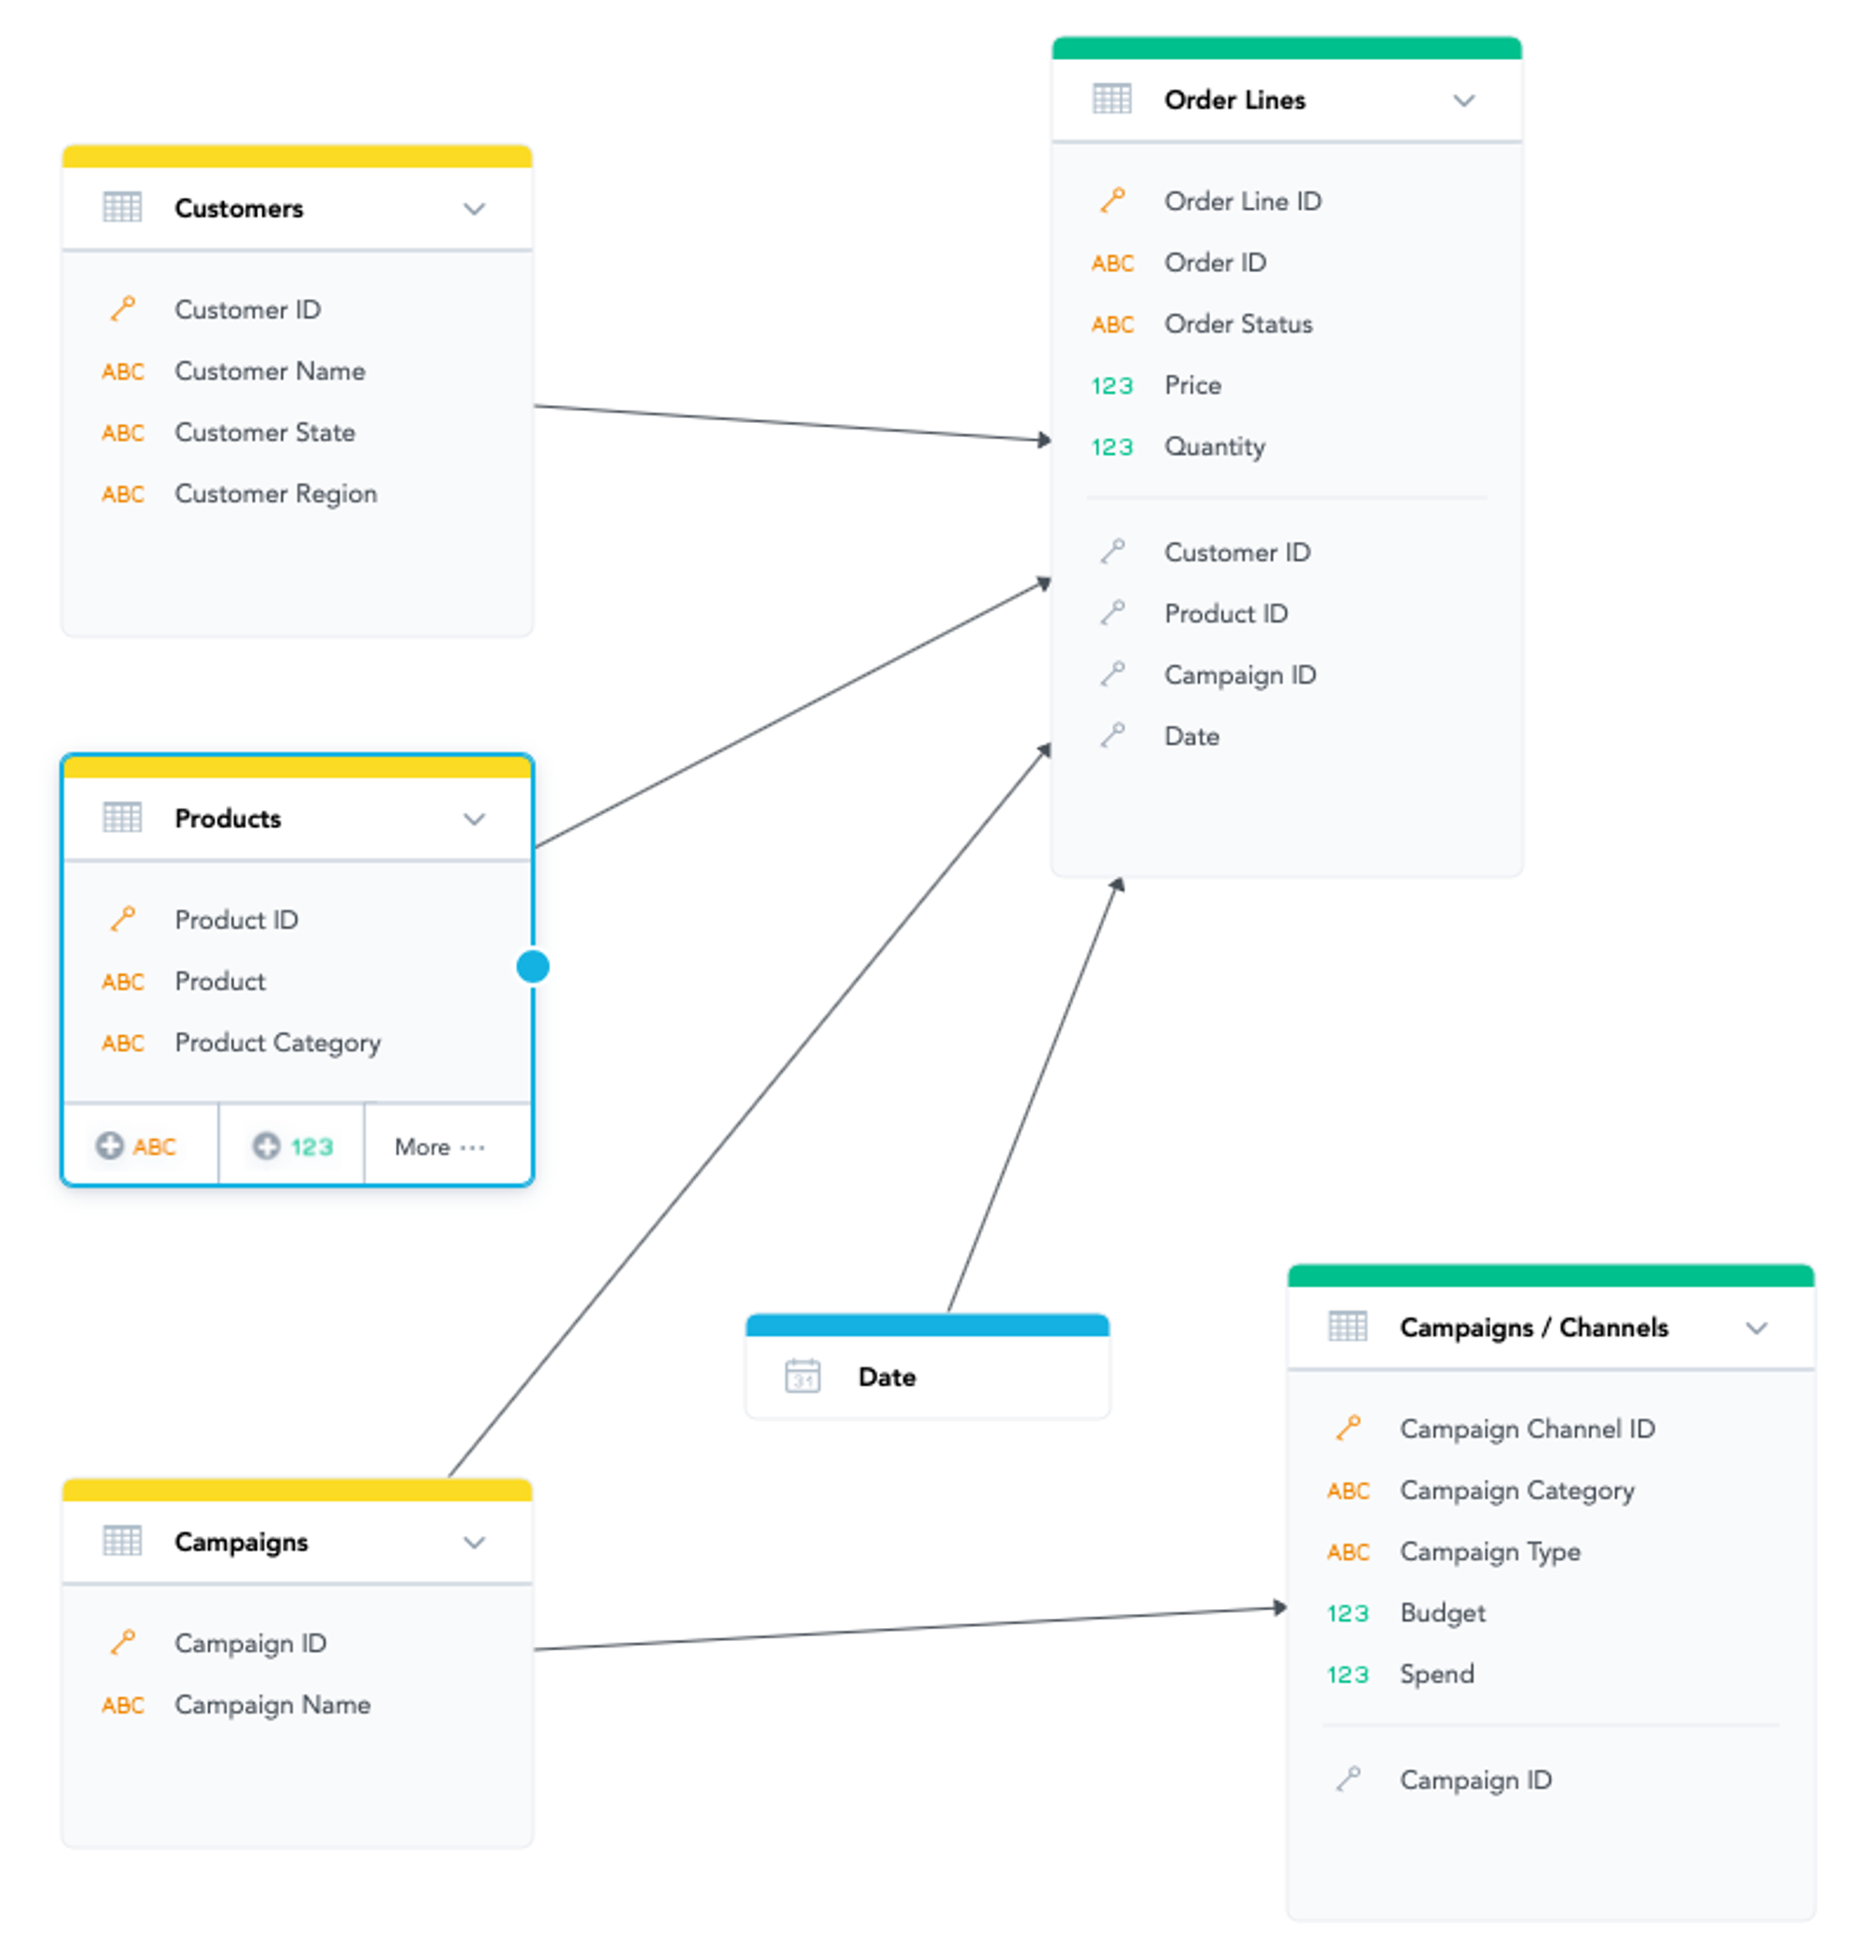
The best analytics platforms support all the methods below for building an LDM. Some can even automatically generate the LDM when you connect to specific data sources, so you just need to select and add the tables you need.
- Drag-and-drop: Some platforms let you create tables and their relationships by dragging and dropping.
- API: Use an API to programmatically create, modify, or query the data model.
- Code-based: This method allows you to use libraries and functions to build tables, define attributes, set primary keys, and create relationships (with the help of SDKs, for example).
Once your data is prepared and modeled, your analytics platform will provide tools for analysis. You can create dashboards, reports, and visualizations to explore your data and discover further insights.
Step 4: Design your dashboards
Now that you have the right infrastructure set up, it's time to start building your visualizations and dashboards. Designing effective dashboards is a skill that goes beyond the tools — it requires an understanding of dashboard-building best practices. Before diving into the data, consider how your dashboard will look and, more importantly, how it will serve the needs of different users and their specific use cases.
Wireframes are a practical solution here. They help bridge communication gaps among all team members by providing a simple, visual representation of the dashboard’s layout. Wireframes are quick to create and easy to adjust, making them an effective tool for reaching a consensus on design before finalizing anything. They outline the dashboard's structure and functionality without overwhelming the team with unnecessary specifics. This allows you to focus on creating a solid information architecture and highlighting key data points to effectively meet users' needs.
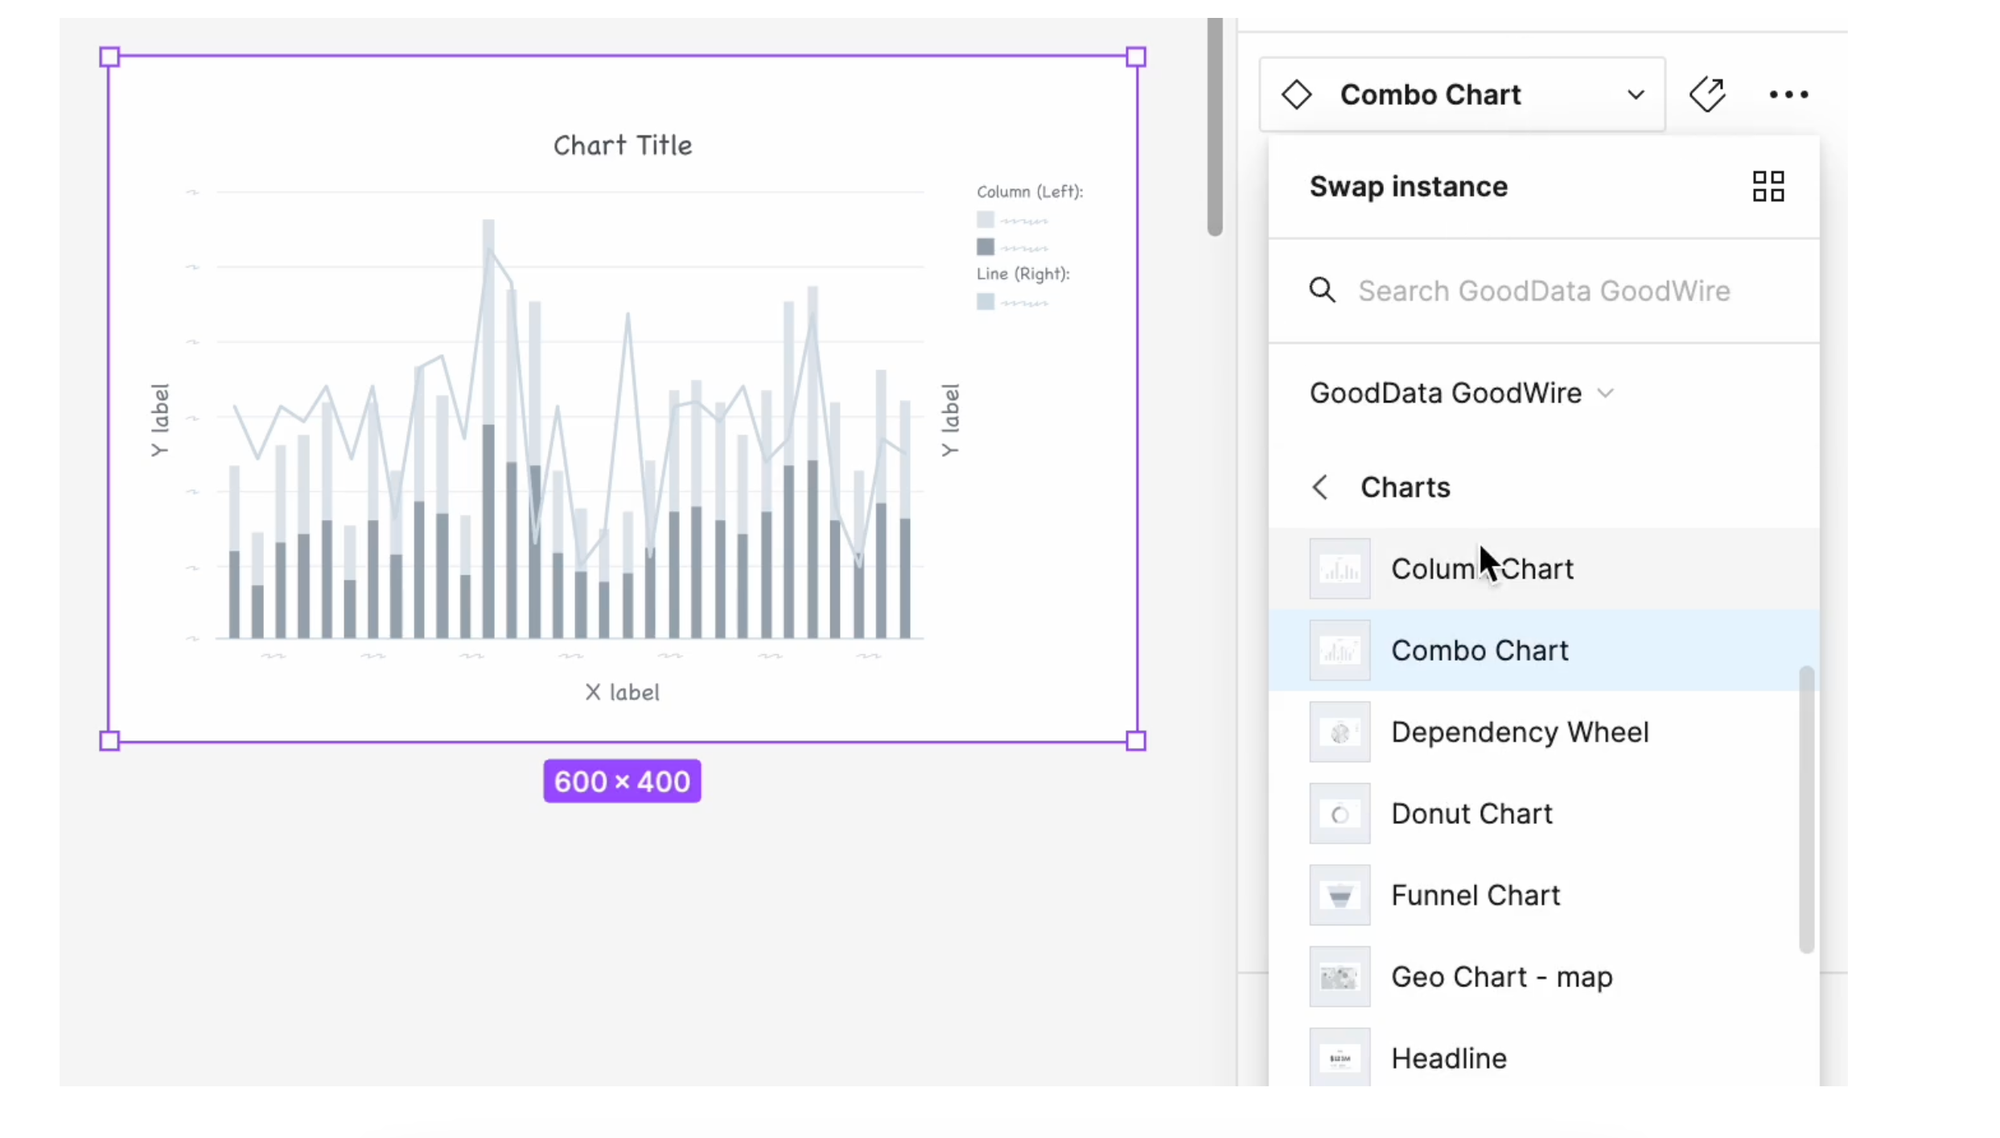
A top-notch analytics platform will include a wireframing library with a range of UI components and chart types. This library helps you quickly prototype and refine dashboard designs, streamlining the workflow and facilitating productive discussions. With these tools, you can efficiently build and iterate on your dashboard, ensuring a design that effectively presents critical data points.
Step 5: Share your dashboards
In Step 2, we highlighted the significance of a platform that supports embedded analytics for seamlessly integrating dashboards and analytics into your application. Here are some common embedding methods that your analytics platform should enable you to use.
- Basic Embedding via iFrame: This involves placing a dashboard into your application using an iFrame. It's a straightforward way to display dashboards without much customization.
- Web Components: This allows you to create modular, reusable elements for embedding dashboards, offering more flexibility and integration options.
- Prebuilt Dashboards and Visuals with SDKs: Software Development Kits (SDKs) allow you to embed prebuilt dashboards and visualizations with advanced features and customization.
- Programmatic Embedding with SDKs: For more control, this embedding type lets you use SDKs to dynamically integrate and alter dashboards based on specific requirements.
The best embedding method will depend on your specific use case. For more guidance on selecting the right approach, refer to our detailed comparison of embedding options.
If embedding isn’t suitable, you can also export your dashboards:
- PDF Export: Exporting the entire dashboard as a PDF is ideal for sharing comprehensive reports and visualizations in a single, static document. This is especially useful for presentations or distribution where no further data manipulation is needed.
- XLSX/CSV Export: Export insights or datasets as XLSX or CSV files and you can analyze the data further using spreadsheet tools. This method provides greater flexibility for detailed analysis.
Finally, if you want end users to be able to reuse your dashboards, choose an analytics platform with multi-tenant capabilities. This setup allows users to access data, configurations, and other functionalities based on the permissions you assign.
Implement analytics into your organization with GoodData.
Effortlessly set up your infrastructure, connect data sources, model your data, and generate insightful reports and dashboards. Request a demo today to see GoodData in action and learn how it can transform your analytics capabilities.
Continue Reading This Article
Enjoy this article as well as all of our content.
Does GoodData look like the better fit?
Get a demo now and see for yourself. It’s commitment-free.
