Modern Analytics - What is it? And why is it needed?
Modern analytics combines the understanding and knowledge surrounding the analysis and interpretation of data with modern technology, thus making it more universally accessible. Along with enhancing data analytics’ accessibility, of equal importance is its agility, that is, the ability to make it available and customisable to multiple stakeholders across all levels of the business.
Being able to give access to data analysis both internally, across an organisation, but also externally for customers, is of key importance. And this is where the fundamental point lies - the difference in requirements between internal pan-organisational analytics and that of SaaS embedded analytics.
Internal analytics vs. SaaS embedded analytics
Over the past 10 years of delivering advanced analytics, GoodData has discovered that SaaS analytics, embedded directly at the point of discovery inside an application, differ greatly from the internal analytics used day-to-day within an organization.
Internal Analytics
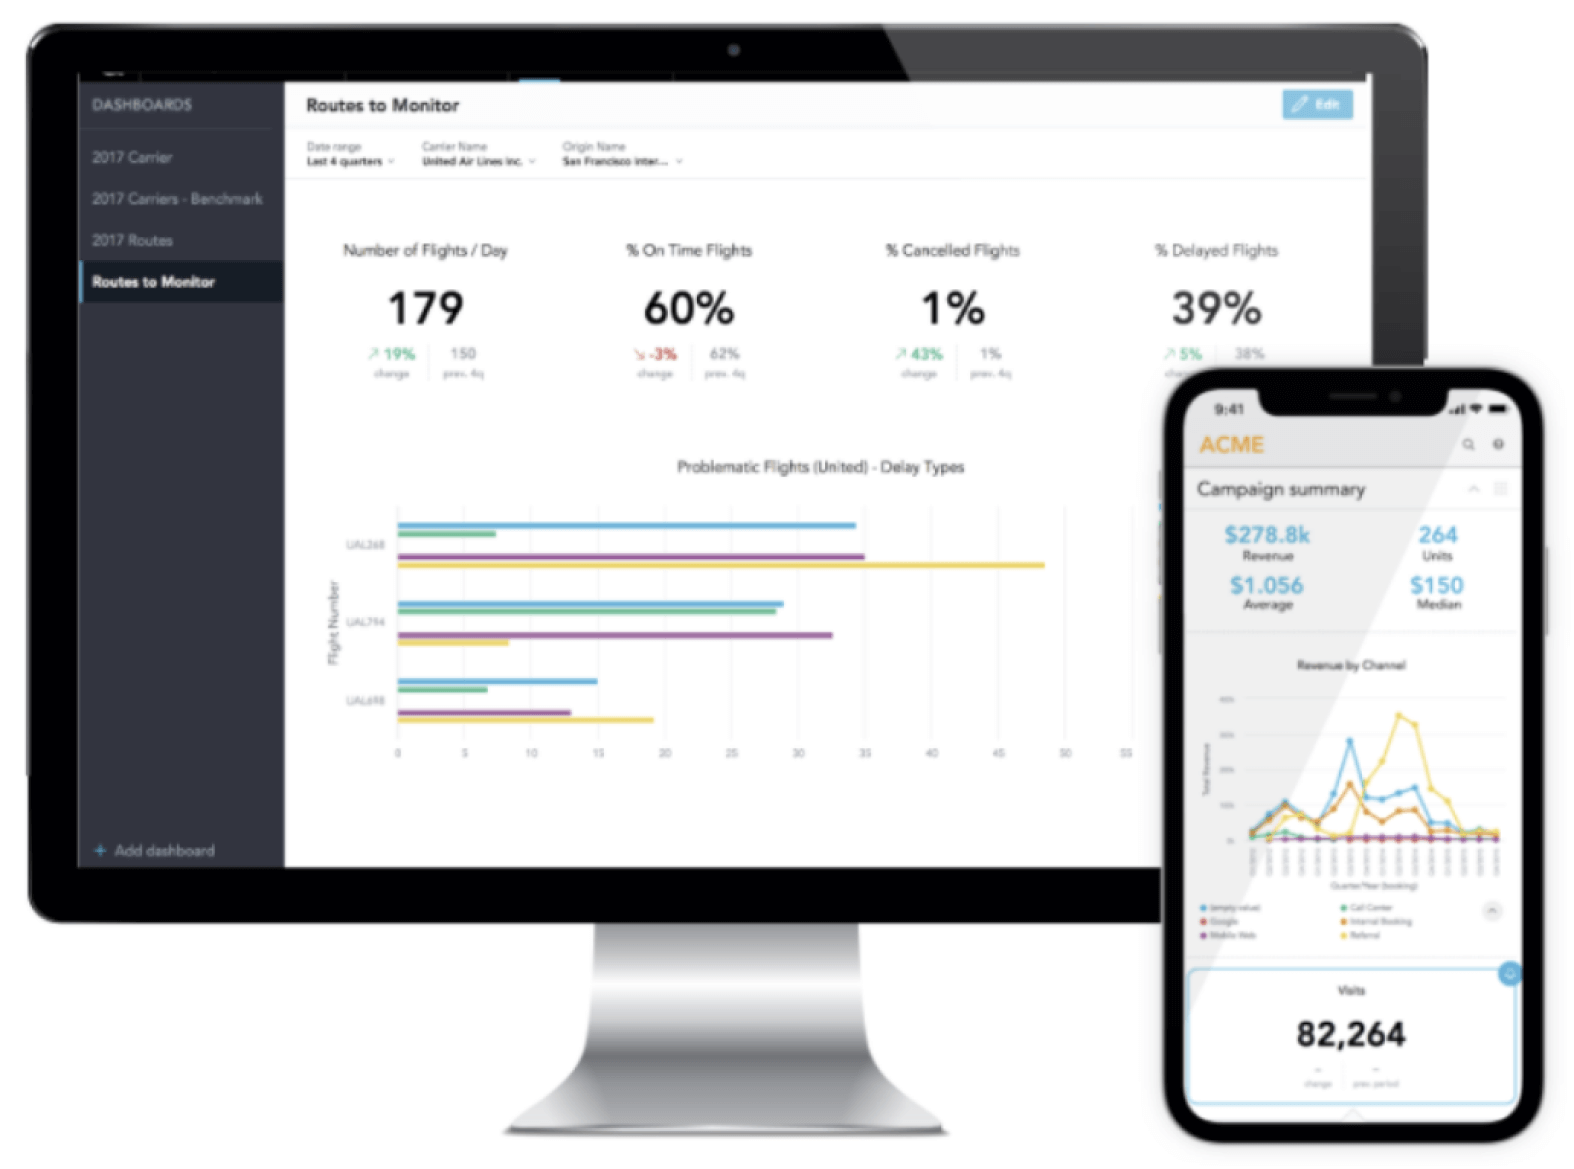
Internal analytics are centred around data analytics applications that aid in personal productivity. They differ from SaaS embedded analytics in that they are usually white labeled solutions that don’t need to cater for a wide set of users across multiple organisations. They provide insight to individual users within a single company rather than a subset of end-users using a SaaS application.
SaaS embedded analytics
Embedded analytics, in contrast to internal analytics, sees a third-party technology, like that of the GoodData Platform, inserted into the user interface of a customerfacing application. This enables the provision of a set of analytical and visualisation tools to power the user experience providing the end-user with the relevant key information they need in order to effectively use the product.
With embedded analytics, or Analytics Everywhere, users don’t have to find data using external tools, outside of the application and don’t have to interrupt their work flow as a result. Instead, the data analytics they require are embedded directly into the software and in the context of their specific use case.
On the other hand, the need for Analytics Everywhere, means delivering analytics customer-wide and, therefore, on a much larger scale than that of internal analytics, directly into the SaaS workflow. Managing the provisioning and de-provisioning of users, allows complete control over the level of access they have to given data sets.
Analytics for every type of user
Dependant on the industry, and the customer base, it is very likely that a wide variety of users will need to be catered for and, therefore, a wide variety of use cases and user requirements. It, therefore, goes without saying, that the SaaS embedded analytics need to be accessible to every type of user that the application supports. With this in mind, the first key requirement is that the embedded analytics work within the standard UI, of the SaaS product, for all user types. In order to do this, it is important to understand the different types of potential users. Generally, this can be broken down into three main types:
- The Business user
- The Manager
- The Data Analyst
So, how do these users differ and what key requirements, or characteristics, will they likely have in terms of data analytics requirements?
The business user
Business users will often require data driven dashboards, recommendations or a simple list of KPIs, but won’t necessarily be aware of the fact they are working with data analytics. To define this in a few words, these users require ‘analytics at the point of work’. An example of this would be a Regional Sales Manager, overseeing a group of Car Dealerships. Their main focus would be the sales revenue generated by each branch and how that compares and contrasts between each dealership. In this use case, a single SaaS application, would be used to show the sales figures of the dealer network, with intuitive KPI Dashboards easily allowing the user to gain an overview of the data important to them, while not necessarily being aware of the fact that data analytics are powering the information they see.
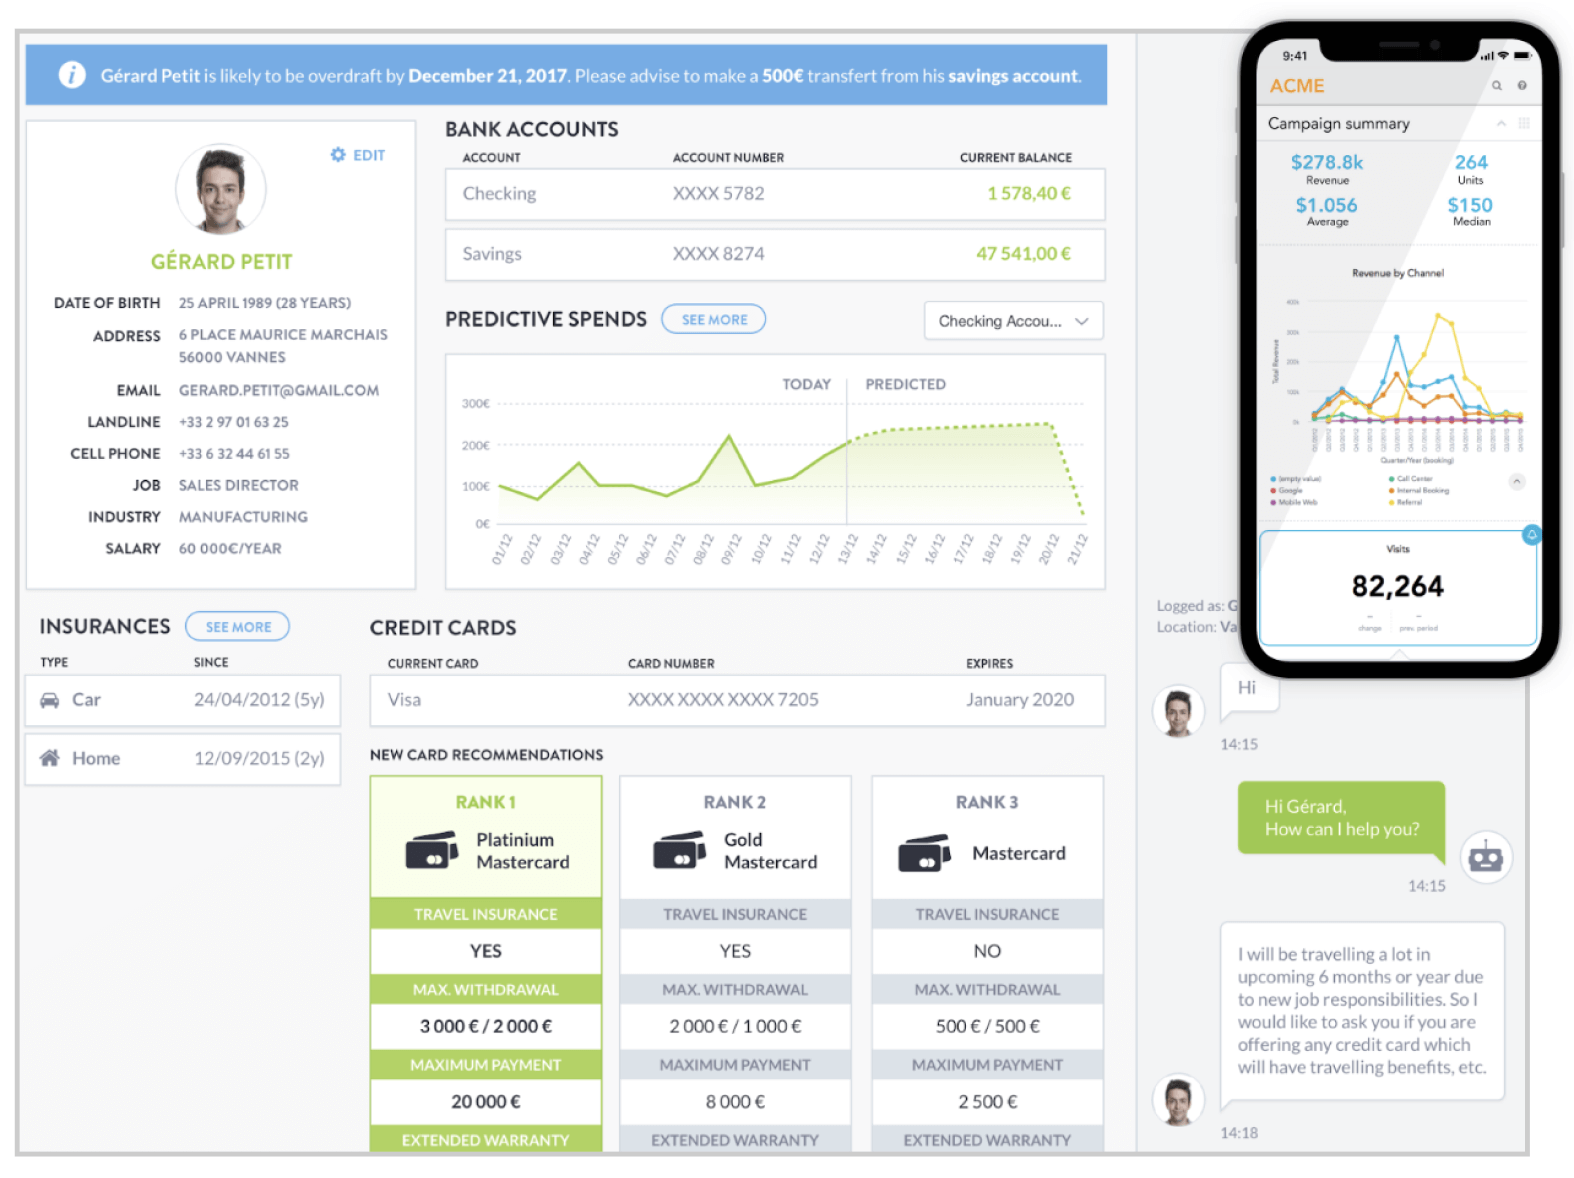
It is in the ‘business user’ use cases, like the example mentioned above, where convincing the user to use analytics is often the most difficult. The interface needs to be straightforward and intuitive to use, in order to convince the user to ‘buy’ into using data analytics. If too many obstacles, or complexities, exist this type of user often lacks the time or patience to dig into them, and will likely see them reverting back to old habits of using simple spreadsheets or tables.
The manager
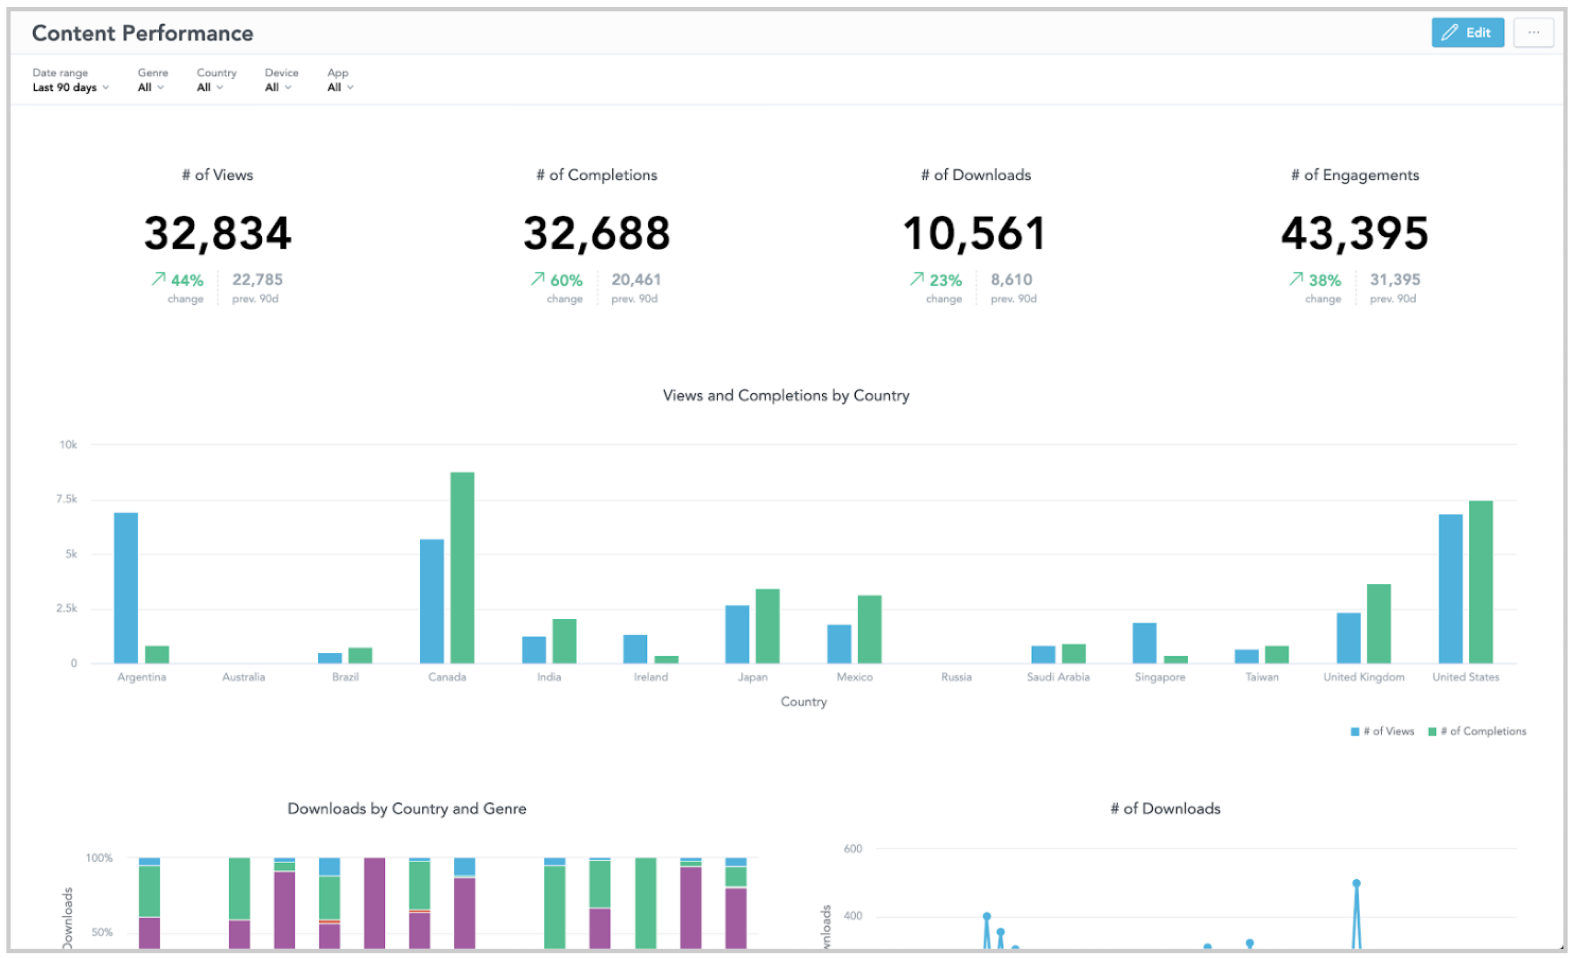
Managers are possibly the most obvious type of user. They will likely use data analytics in the form of embedded dashboards in order to effectively report on their team’s performance. A common example of this would be reporting on employee performance within a customer support team. Through embedded analytics the Customer Satisfaction Manager is able to track the performance of each of their team members, being able to easily see the number of tickets raised vs. the number opened and the number resolved. As a result, the manager can quickly understand whether KPIs are being hit, customers’ issues are being resolved in a timely manner and where there is room for improvement. The end result? The manager uses the power of data analysis to maximise the performance of their team and increase the overall customer satisfaction, all within one use-friendly embedded data analytics interface.
The data analyst
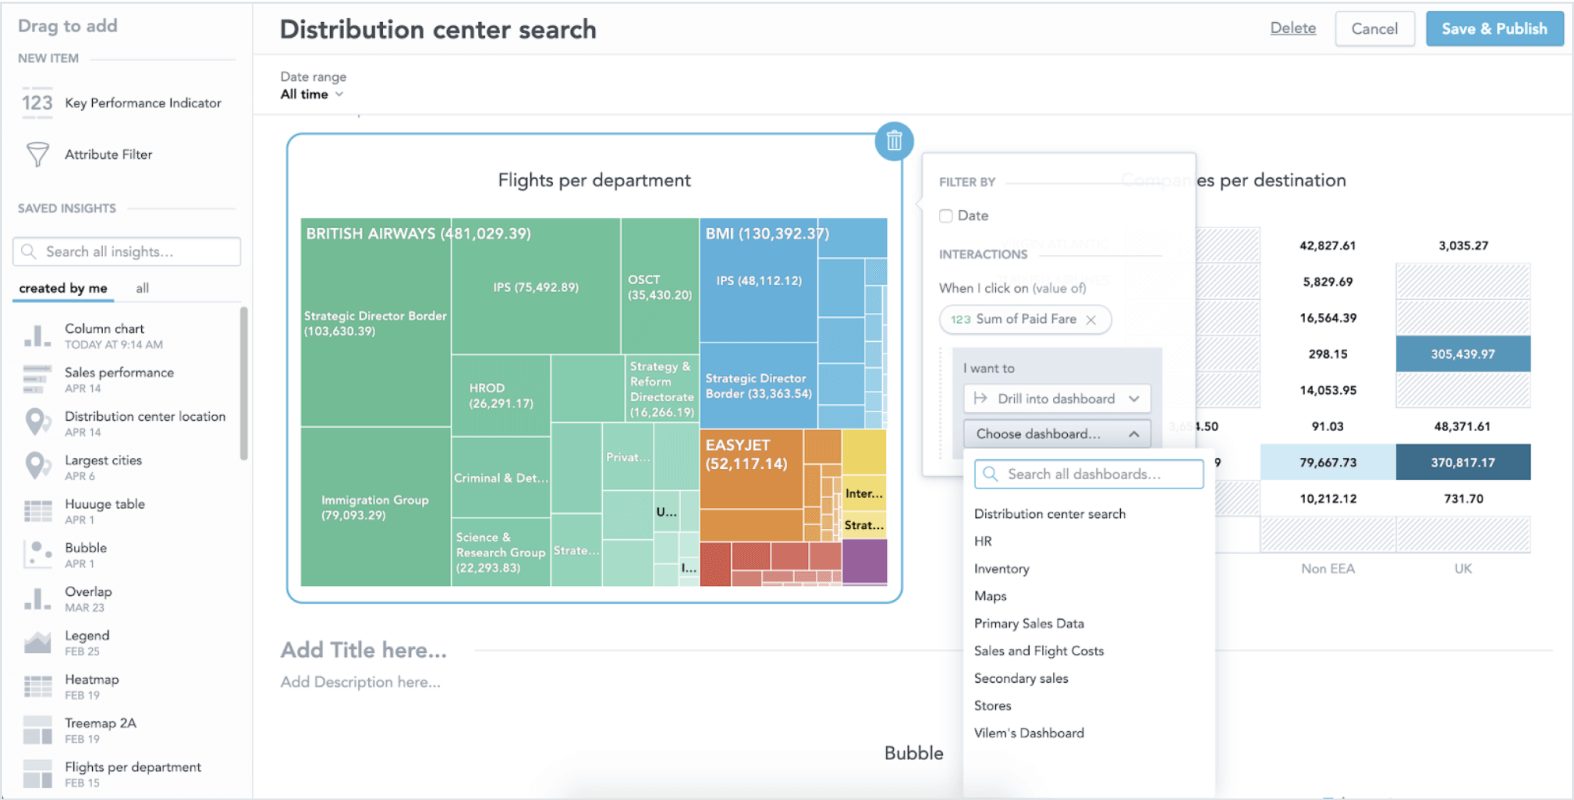
Data analysts, as the name suggests, frequently work with complex data on a day-to-day basis. As statisticians, they will drill deep into the datasets searching for fresh insights that can, in turn, be digested and used businesswide to fuel decision making and the wider business strategy. Data analysts, in contrast to the other user types, therefore, require a greater complexity of advanced features, with the unrestricted ability to manipulate reports, visualisations and key metrics. The capacity to create entirely new reports from scratch and share them with their teams right from inside your application is also of key importance to them.
GoodData is able to fully support all these use cases, delivering a fully scalable platform directly inside your application.
Application life cycle
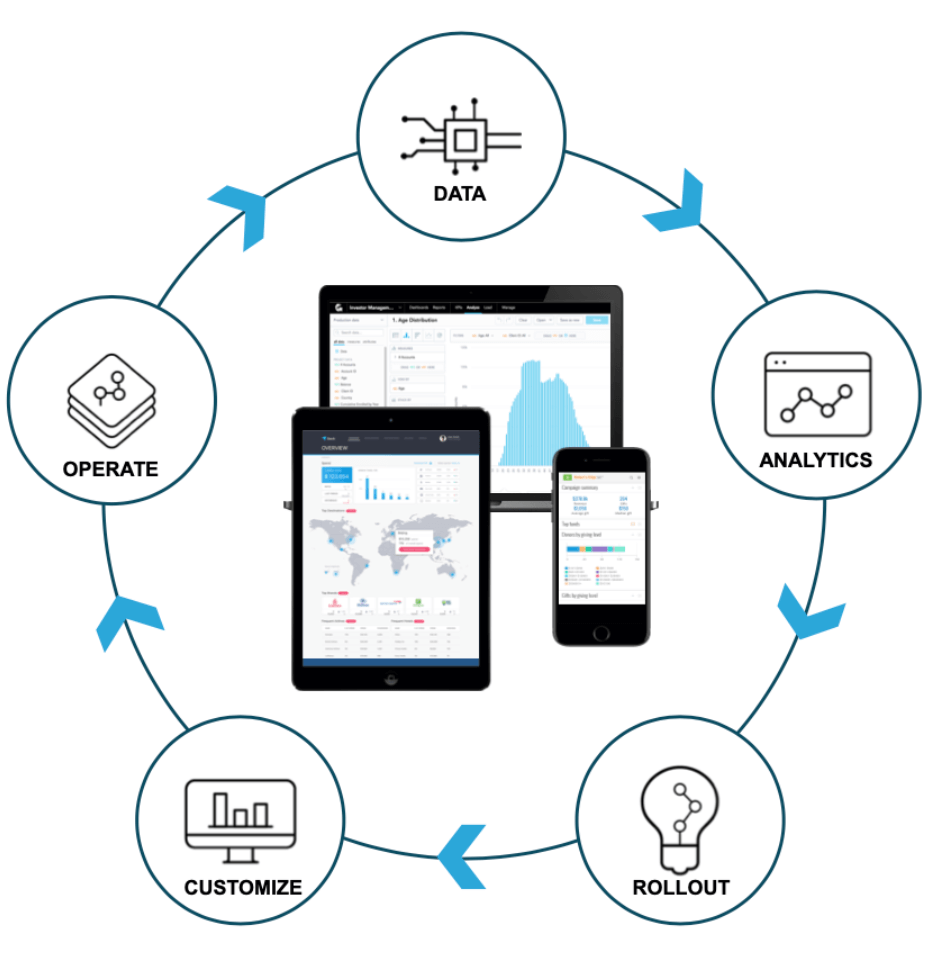
The Implementation of an embedded analytics solution can be broken down into 5 key steps:
- Data: Extracting and consolidating data from an application & 3rd party data sources in order to create a data model
- Analytics: Creating reports and dashboards relevant to the application use cases
- Rollout: Rolling out standalone or embedded reports and dashboards to the entire customer base
- Customize: allowing each customer to customize their own dashboards and reports in order to match their specific use case
- Operate: managing and driving the analytics for the whole customer base as well as adding new customers and users, managing growth and monitoring usage
Data
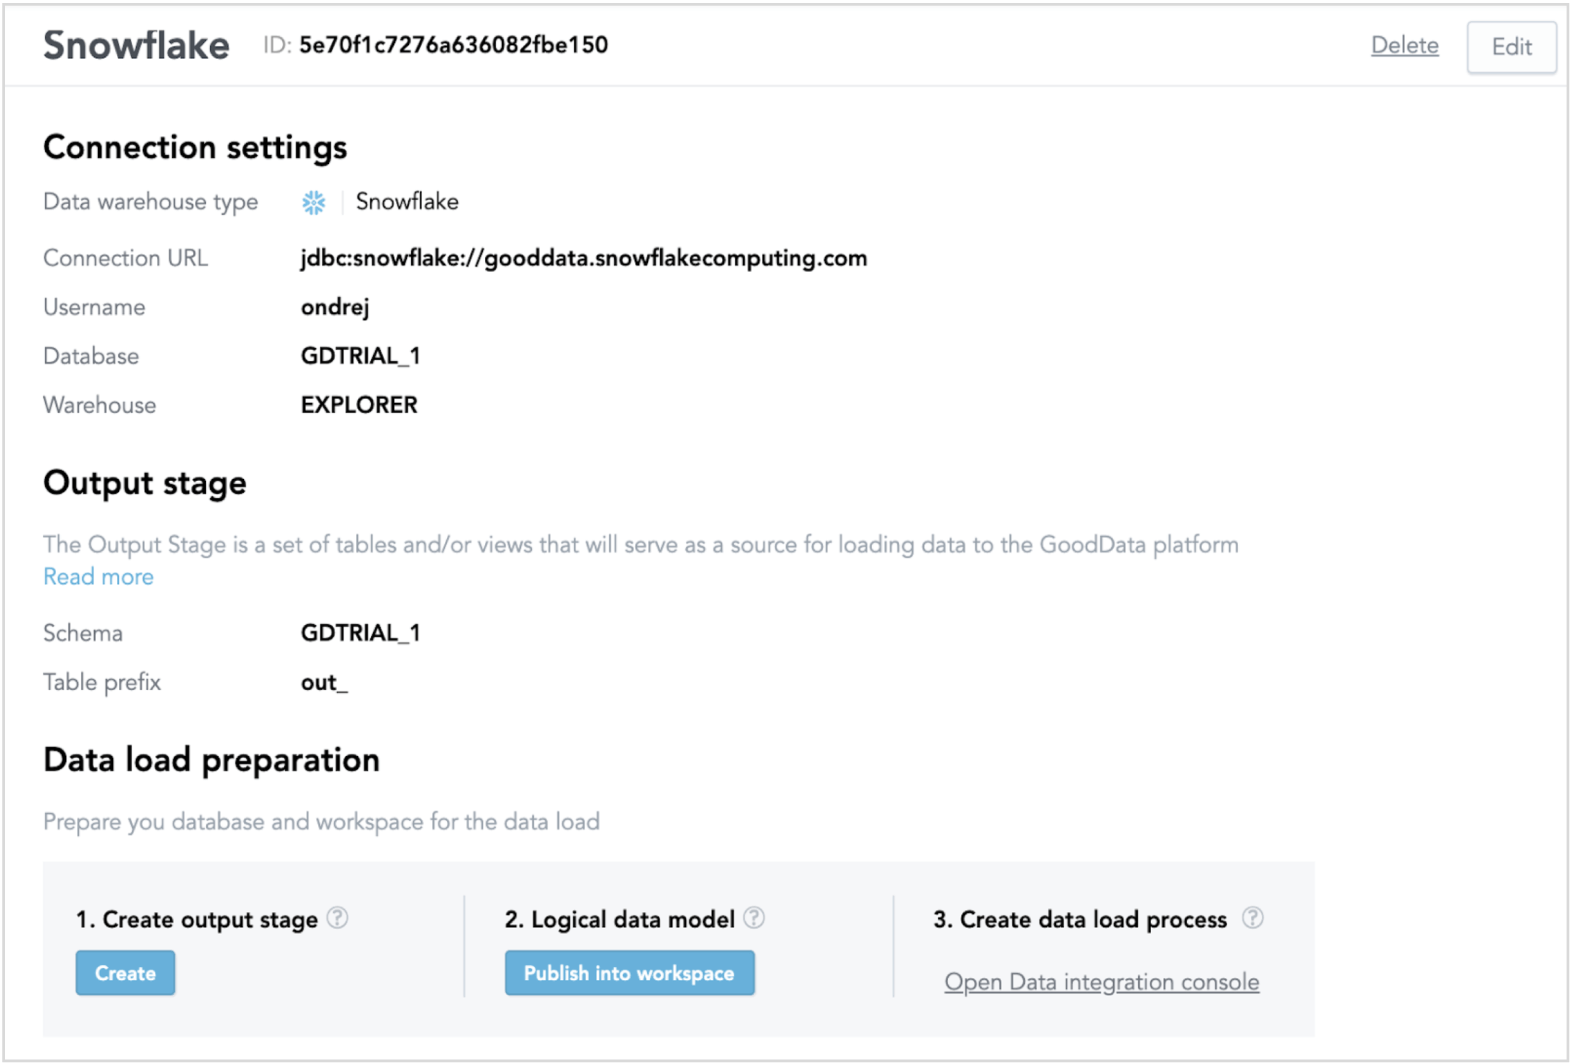
The first step in the process of implementing an embedded analytics solution is that of transforming the application’s data into an analytical data model. It will be this analytics data model that forms the foundations of the dashboards and reports.
In the instance that the application data has already been consolidated in a cloud-based data warehouse like Snowflake, Redshift or BigQuery for example, leveraging this existing data warehouse or data lake, is the most logical step.
However, in the case where no data warehouse exists, there is, of course, the need to build one, in order to consolidate all the application data from the entire customer base, within a single location. Creating a data model, as the first step, and then generating the new data warehouse schema from it, makes the most sense in this scenario - starting with a simple data model, easily understandable to all users. It is worth mentioning that, thinking of the analytical model in terms of a series of tables that form a model of business processes, is of valuable importance. These could, for example, be Newly Created Opportunities, Closed Opportunities or such like.
Another key step of building the data model, is that of creating and documenting a series of metrics that can be conveniently used by users later on, in their reports and dashboards. Although the ability for users to create their own dashboard and report as well, will exist, preparing the environment for them with pre-configured metrics will improve adoption and ease-of-use, ultimately creating more benefit to the business as a whole.
Analytics
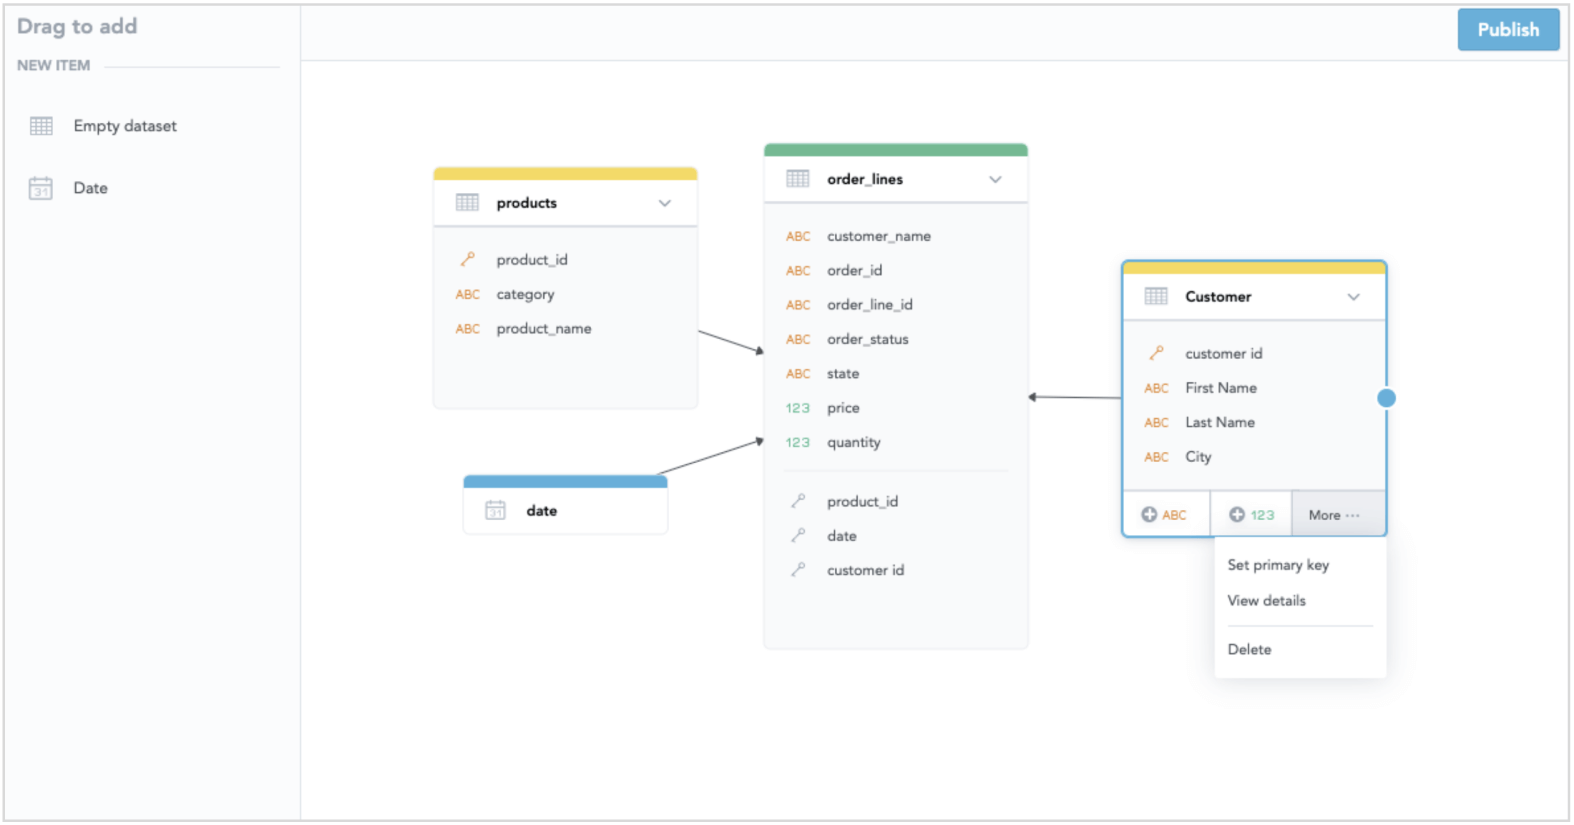
It is evident that, allowing easy access to data models for specific customers can be of key benefit to them and the SaaS product provider. This is facilitated by having a Logical Data Model, or LDM, that allows users to easily work with all the data that the semantic data model (LDM) captures. The image here shows an example of an analytical data model capturing business entities, their relationships, descriptive fields (dimensions) and associated numbers (facts).
GoodData analytical calculations are called metrics. The benefits of these metrics over database queries are:
- easy to understand expressions for business users
- context-aware - use the same metric across multiple reports
- accessible by end users in order to create their own custom metrics
This is achieved by using a proprietary declarative language called MAQL, simpler to use than SQL, but powerful and concise in nature.
Once the data model has been created and metrics determined, the final step is to create reports and dashboards to be directly embedded into the SaaS product. This is where GoodData’s self-service attributes come into play, allowing users to create and customise their own reports, using the ones that have been predefined in the SaaS product as a kick-start.
These reports and dashboards can also be coded using the GoodData.UI, a flexible JavaScript SDK that supports modern web and mobile UI frameworks like React or AngularJS, as well as being white labeled to match the branding of the SaaS product.
Rollout & Scalability
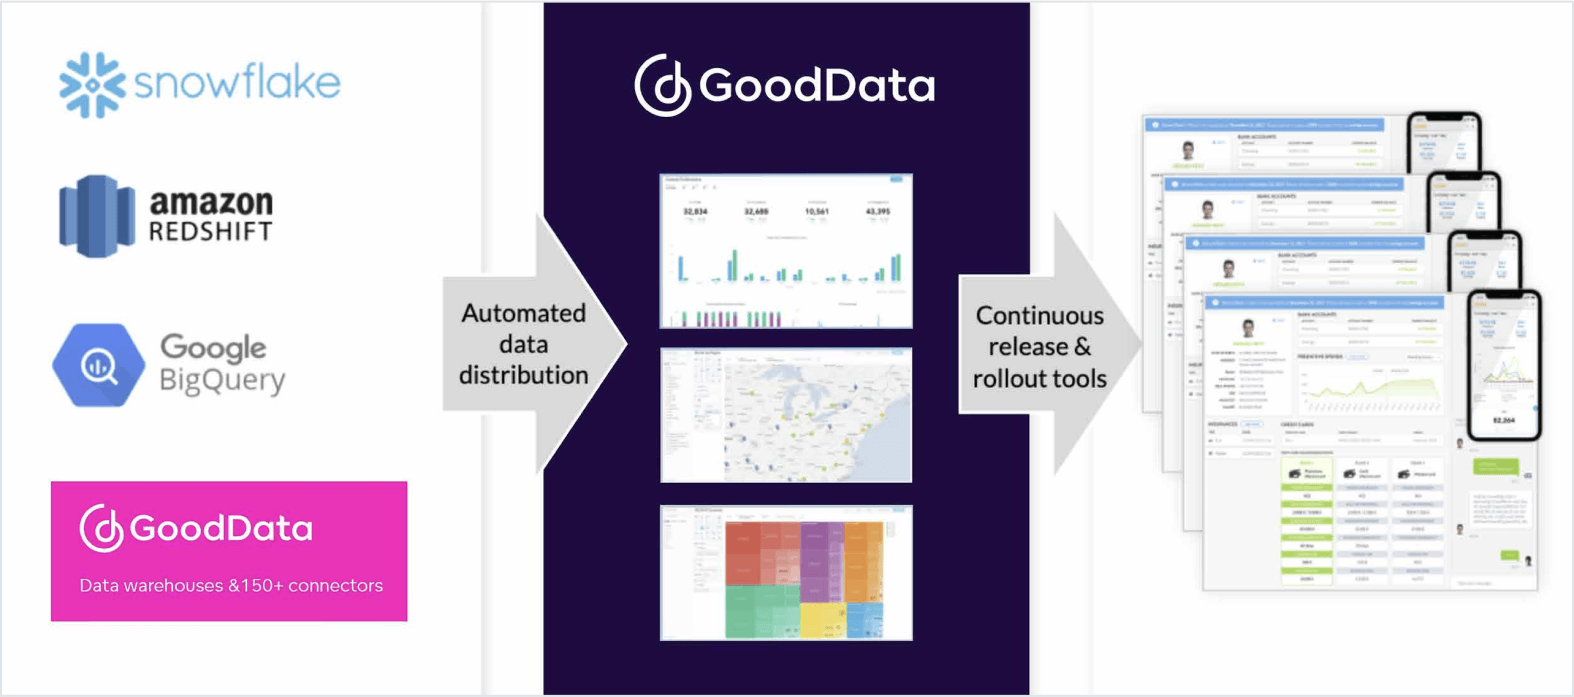
Once the analytics have been created, and quality has been checked, the next step is to roll out the analytics to the entire customer base within the predefined workspaces.
At this point, the ability of GoodData’s platform to competently integrate with continuous integration infrastructures used by your engineers is of great benefit. Further, GoodData includes a suite of rollout tools that give the possibility to segment customers by subscription tier, or by their use preferences. With this capability, you are able to roll out different versions of your data analytics to different users, creating tiered pricing models to the benefit of both your business and your customer base. The roll out of these different versions of analytics won’t invalidate or overwrite the customisations and unique users preferences that your users may have already created, further underlining this feature’s added value.
Customization
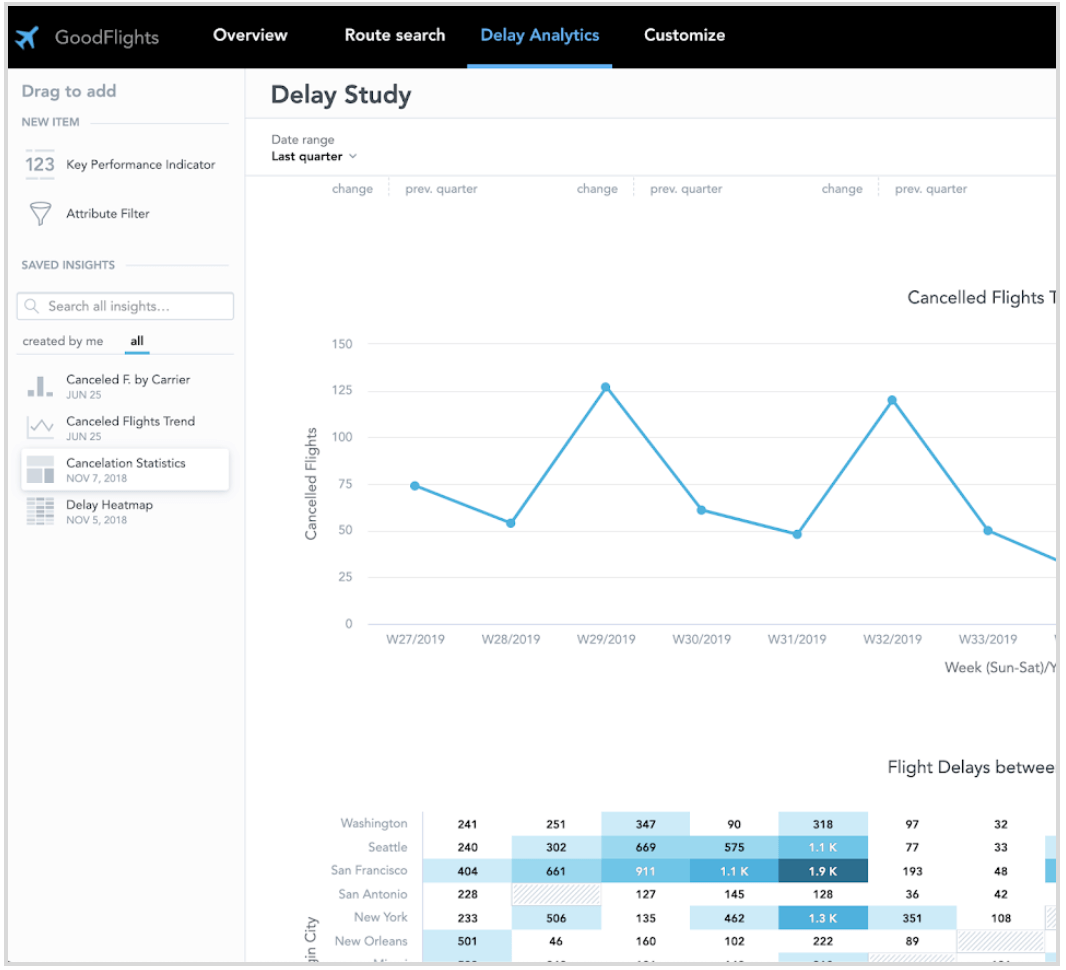
Customization is a key part of any good embedded data analytics solution. Giving end-users the ability to customize everything, including the logical data model, metrics, reports, dashboards, and access permissions, is crucial in setting yourself apart from the competition. GoodData’s workspaces allow this capability, by giving every single customer or tenant their own private workspace, which includes all of the following customizable features:
- Data model: Give your customers the ability to access their custom fields and upload their own data as files - managed separate from the analytics production data
- Metrics: customers can create their own metrics as simple expressions from an existing metrics set
- Reports and dashboards: customs can create new or customise out-of-the-box reports and dashboards using the specific easy-to-use tool embedded in your application
- Manage access: enable your customers to manage access of users or groups to reports and dashboards
Not only does the existence of operate workspaces allow multiple customization options, but it also ensures the privacy and security of all your customers is realized.
Operation
Once data analytics are rolled-out to the customer base, having the ability to monitor usage and engagement of the embedded data analytics is the next important step in the process. Key metrics that you will likely want to monitor include:
Size & scaling: The number of enabled customers, number of users, data size and dashboard executions
Usage & Engagement: How different customers and their users use and engage with specific reports and dashboards
Performance: How data management, report executions and deployment processes are performing
Security audit trail: Tracking logins, logouts, report executions, data refreshes and exports
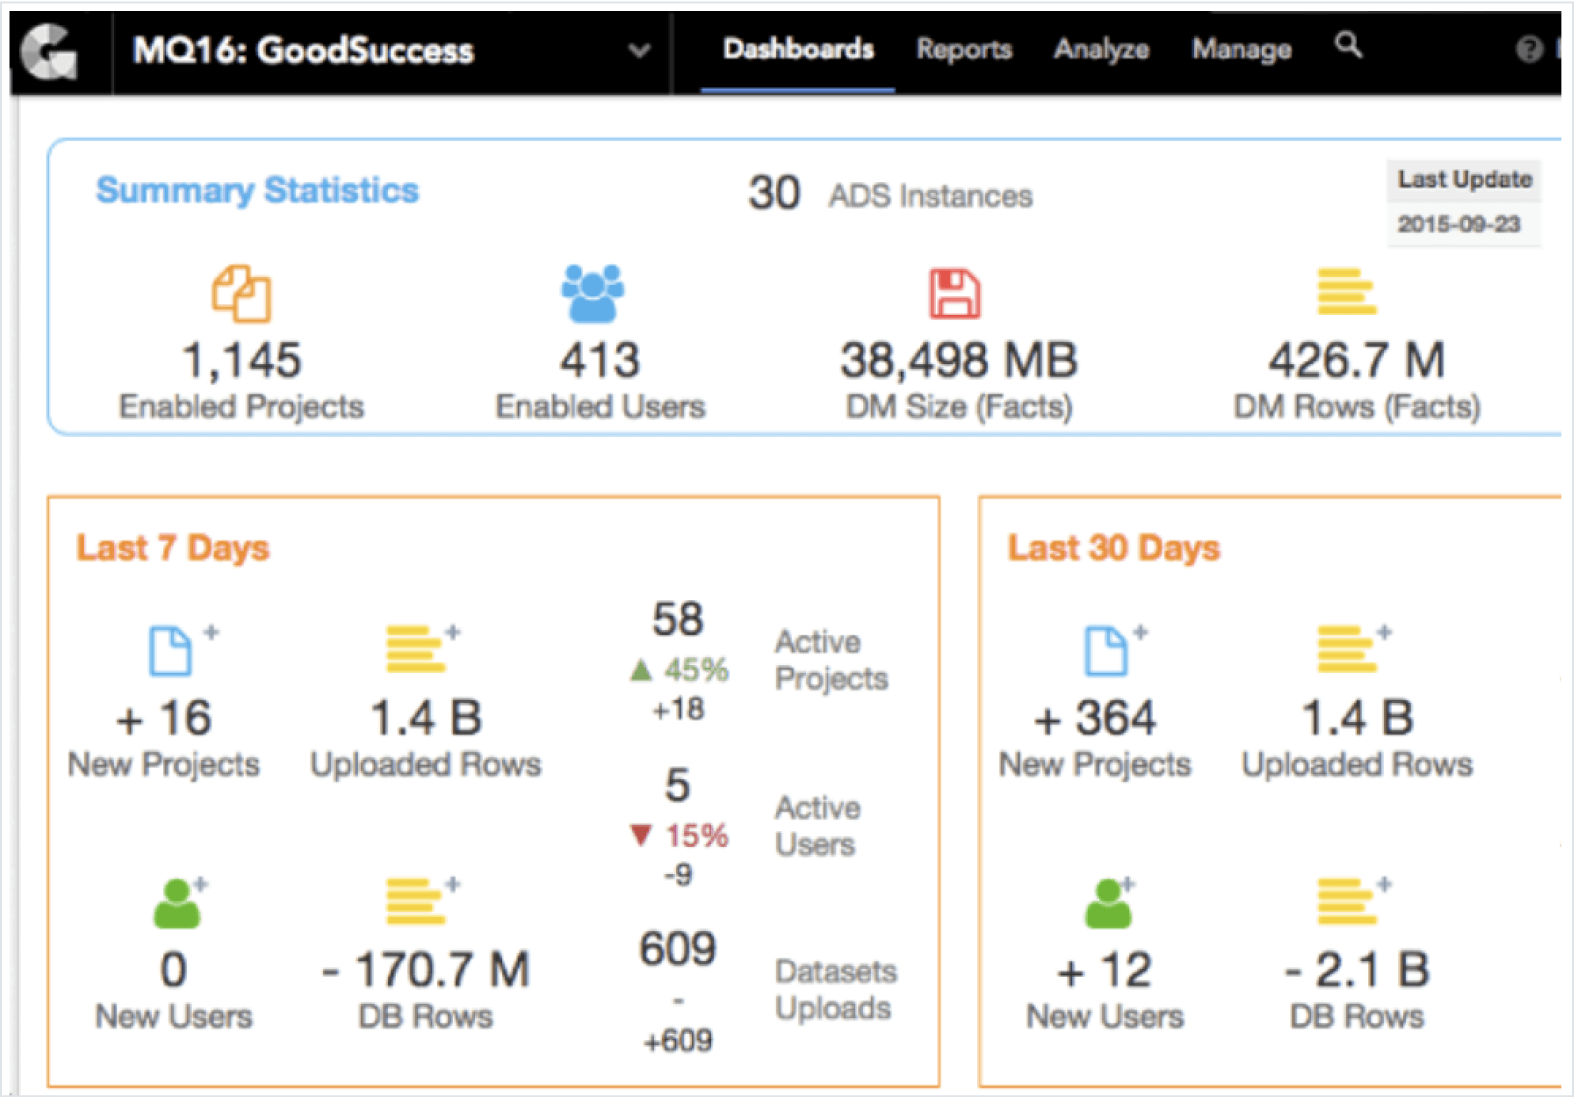
GoodData’s platform gives you complete visibility over your customers’ usage of, and engagement with, your analytics, providing the logging, monitoring, auditing, and alerting capabilities expected from an enterprise-grade platform.
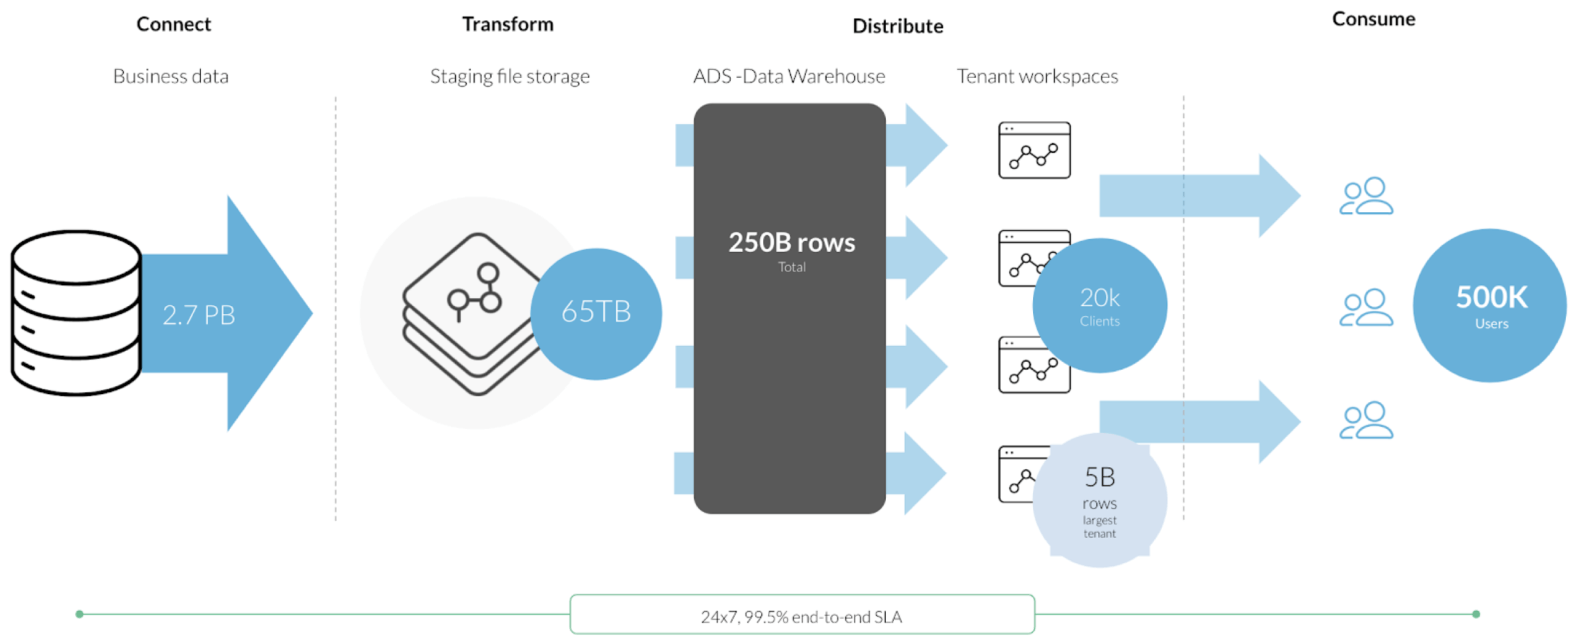
Security is at the forefront of any good company’s priority when it comes to handling data. With strict SLAs in and maintenance and releases performed in zero downtime mode, the GoodData platform ensures dependability at all times. And with the ability to instantly provision hardware and software resources, scalability isn’t compromised.
Pricing
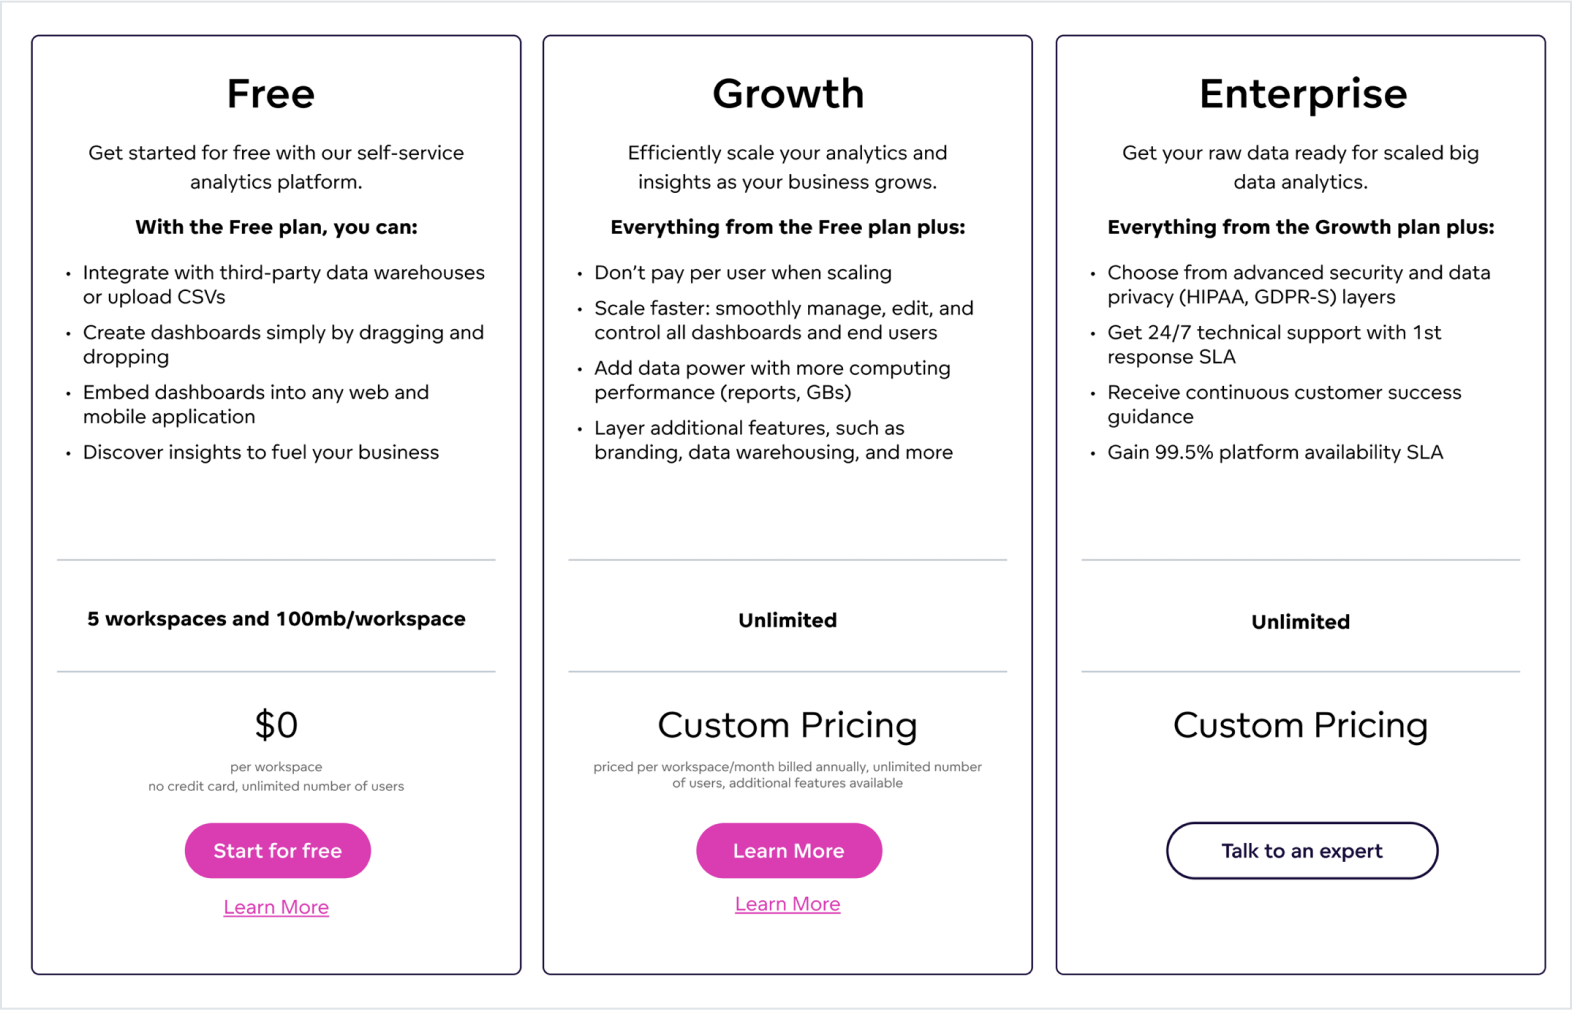
While product capability is of prime importance when rolling out embedded data analytics, of equal consideration is that of both a comprehensive pricing model with the ability to scale as your needs increase.
GoodData has recently expanded its pricing model to include Free and Growth tiers. This new pricing model allows you to trial the adoption of data analytics in your product, free of charge, and then scale up to either Growth or Enterprise tiers as you roll out data analytics across your customer base.
The added benefit of GoodData’s pricing model is the lack of ‘per user’ pricing. You pay per workspace, allowing you the ability to encourage data analytics adoption across your customer base at the user level.
Continue Reading This Article
Enjoy this article as well as all of our content.
Does GoodData look like the better fit?
Get a demo now and see for yourself. It’s commitment-free.
