In general terms, business intelligence and analytics solutions are about giving data visualizations (with valuable business reporting and predictions) to those who need it: which, in today’s data landscape, means as many people as possible.
As this already suggests, the underlying challenge for analytics implementation is to think of how “big” your BI and analytics solution should be to satisfy your organization and people’s needs. And all that breaks down to “what your BI and analytics solution needs to be able to handle and deliver smoothly.”
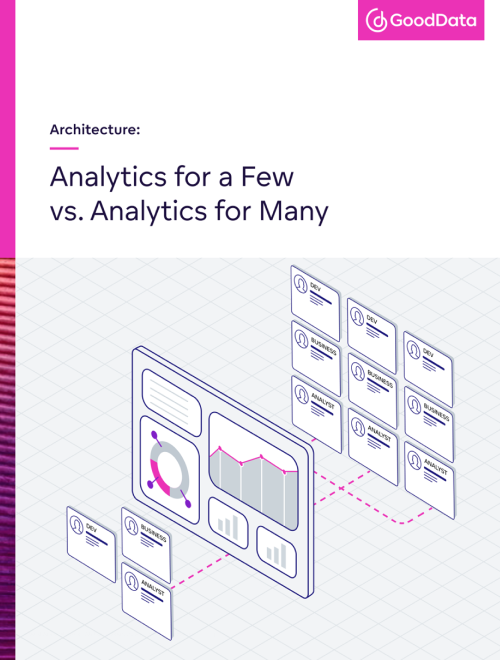
This paper examines the key differences between an analytics solution for a few vs. a solution for many. We have broken down the key differentiators via the set of features each type of solution should offer.
The Differences Between the Two
“Analytics for a few” could mean two things.
- You quite literally only have a few users; let’s say somewhere in the single to double figures range. Moreover, you do not require different users to access different data sets whereby specific groups of users cannot access other groups of users’ data and visualizations.
- Alternatively, you may actually have many users, hundreds or even thousands of them, but without the requirements to have users and data management unified through one (or as few as possible) analytics tools. In other words, using a variety of standalone, non-integrated solutions works well for your organization.
“Analytics for many” also consists of two main use cases.
- The first, like those mentioned above, is an “internal” use case (i.e., designed for internal teams), only, this time, based on the need for unified and streamlined analytics and data management. Your organization’s need for these requirements could be to quickly enable access to customized reports to more teams and stakeholders. It also could be that you need to improve how individual metrics are created and managed across the organization so that all internal teams work with the same definitions of metrics.
- The second use case is the most native to “analytics for many”: where analytics is delivered to business partners or even sold as a (software) service to paying customers (this applies mostly to SaaS companies). In this case, from the very beginning, the focus lies on scalability and change management capabilities, such as releasing new versions of customized dashboards, so that the service, to be provided to customers, works flawlessly.
With that said, the simplest way to think about the “few vs. many” comparison is in terms of how much you will need to scale, unify, and easily manage and separate all of your data and users.
Feature Comparison
Architecture
| Few | Many | |
|---|---|---|
| Freedom of deployment: Fully hosted and Self-hosted (cloud native: your public and private clouds) | No | Yes |
| Data volume flexibility | No | Yes |
| Metrics definitions and change management | Ad-hoc queries | Exposed semantic model as a shared service |
| Open and declarative APIs, integration-aware SDKs, usage of standard protocols | No | Yes |
| Integration with 3rd-party BI tools, ML notebooks, and data apps | No | Yes |
| Easily readable metadata for all analytical objects | No | Yes |
| Direct query to data | No | Yes |
| Support for a multi-user-group environment (multitenancy) | No | Yes |
Dashboards and Reports
| Few | Many | |
|---|---|---|
| Self-service dashboard creation and customization for business users/ end users | Yes | Yes |
| Intuitive drag-&-drop dashboard and visualization builder to create a new chart or dashboard from scratch or adjust preset ones | Yes | Yes |
| Business users/end users can compose own metrics from preset metrics | Nice to have | Yes |
| Responsive and user-friendly, easily shared via access rights, scheduled emails, and file exports | Yes | Yes |
| Theme (colors and so on) interface customization per group of users (e.g. your customers or teams) | No | Yes |
Embedding
| Few | Many | |
|---|---|---|
| SSO | No | Yes |
| White labeling | Nice to have | Yes |
| Direct embedding: iFrame | Nice to have | Yes |
| Embedding SDKs | No | Yes |
| Development operations to integrate analytics into the organization’s product, portal, or app | No | Yes |
Scaling and Change Management
| Few | Many | |
|---|---|---|
| Multi-tenancy: scalability to any number of user groups (departments, teams, and clients) | No | Yes |
| Streamlined change management to roll out changes to all user groups without breaking their customizations | No | Yes |
| Possibility to change data sources without breaking data model, metrics, or dashboards | No | Yes |
| Automation of data, users, and access rights provisioning | No | Yes |
Data Integration
| Few | Many | |
|---|---|---|
| Ability to use multiple data sources | Nice to have | Yes |
| Federated queries (combination of different data sources) | No | Yes |
Data Security, Compliance, and Services
| Few | Many | |
|---|---|---|
| End-to-end security from dashboards to data, ensuring separation of users (multilayered approach to protect information) | Not necessarily | Yes |
| Compliant with SOC 2, ISO 27001:2013, CCPA, GDPR & HIPAA | Not necessarily (depends on industry) | Required (multi-industry customers) |
| Guaranteed SLA | Not necessarily | Yes |
| Data permissions for different users and user groups up to row-based security (Client IDs) | No | Yes |
| Professional services (implementation and consulting services) | No | Yes |
Pricing
| Few | Many | |
|---|---|---|
| Pricing model | Per user/query | Per customer/tenant (regardless of users) |
Summary
As you can see, there are many aspects to think about when delivering analytics to hundreds or thousands of users; whether that’s an internal use case with employees as the end users, or an external one where your customers (and their customers) form the user base. However, as mentioned above, there are a few specific areas where attention should be especially focused, those being:
- Scalability: in terms of user number, cost, and data, and performance
- Unified access: analytics availability through a seamless interface
- Management: the easy roll of changes as well as separation of user groups
Ready To Learn More?
Ready to get more in-depth and explore how best to launch analytics specific to your use case? Do so with our “Best Practices for Launching BI and Analytics” e-book or, alternatively, schedule a demo call and let our experts answer your questions about these analytics features and the GoodData platform.
Continue Reading This Article
Enjoy this article as well as all of our content.
Does GoodData look like the better fit?
Get a demo now and see for yourself. It’s commitment-free.


