The AI-accelerated BI tool
Use AI to rapidly build scalable BI solutions that give end users exactly what they need — from trustworthy and tested data to an intuitive no-code UI.


Create AI-fueled dashboards and interactive visualizations
Enable users to build charts and dashboards with drag-and-drop UI. AI-powered features like forecasting, key driver analysis, and NLQ mean faster insights and faster decisions.
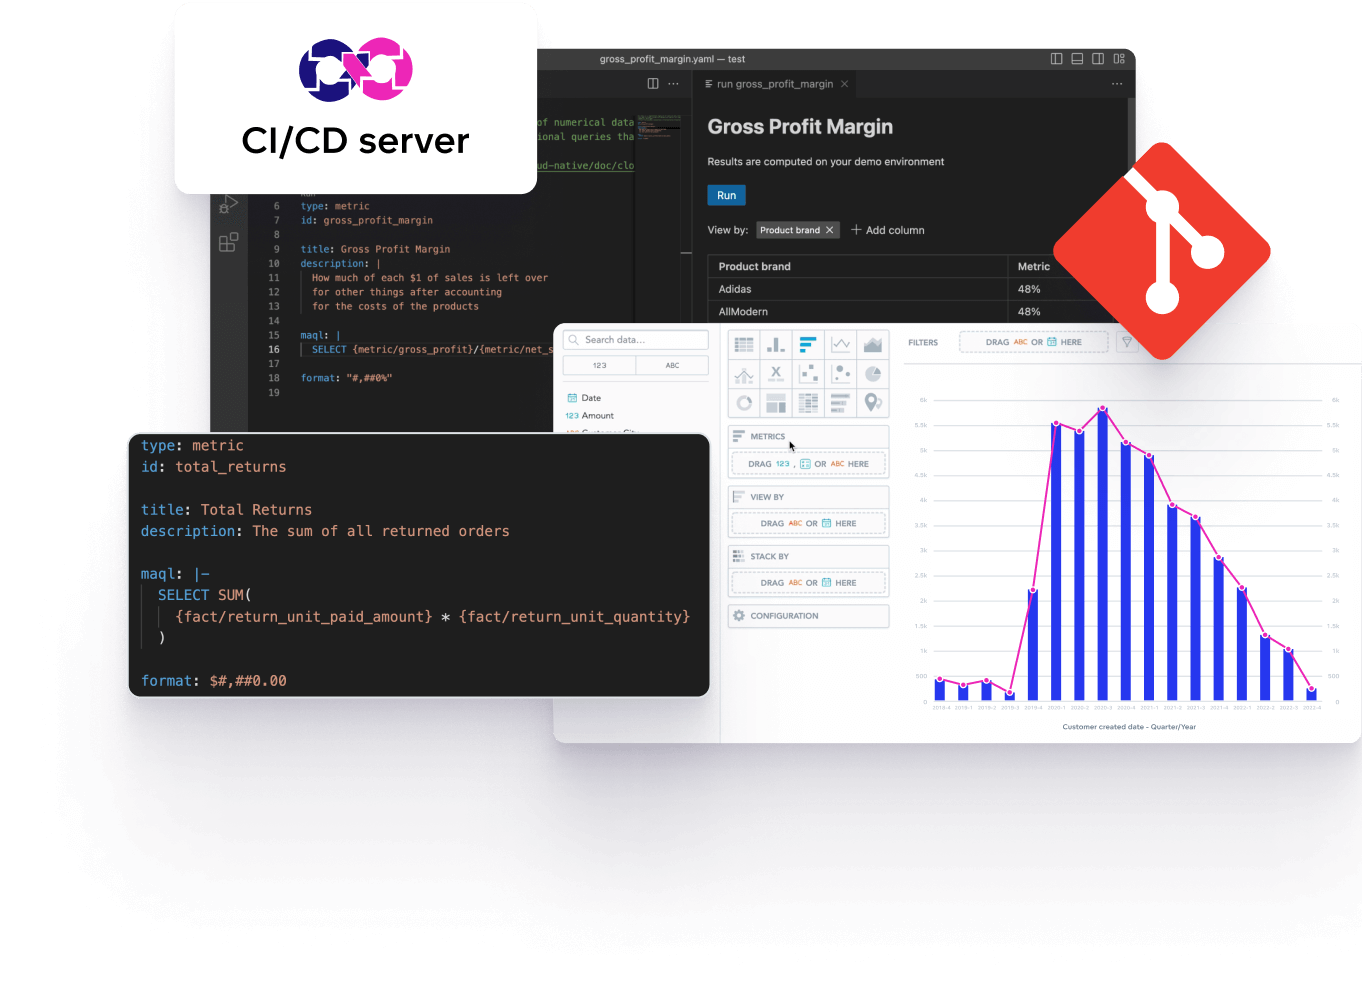
Boost efficiency with code-based automation
Create business intelligence solutions faster than ever before with our code-based developer tools and blueprints. Integrate analytics with CI/CD pipelines to automate development.
Distribute BI reports wherever your users need them
Seamlessly embed interactive charts and dashboards into your apps, web portals, and workflows.
- Embed via React SDK, Web Components, or iFrame.
- Customize and white label to match your brand.
Unite your teams in a single environment
Leverage one central hub for your DevOps, DataOps, and BI teams.
- Tools like GoodData for VS Code make it easy to share insights, findings, and code.
- Users with all skill levels can collaborate with pro-code, low-code, or no-code UI.
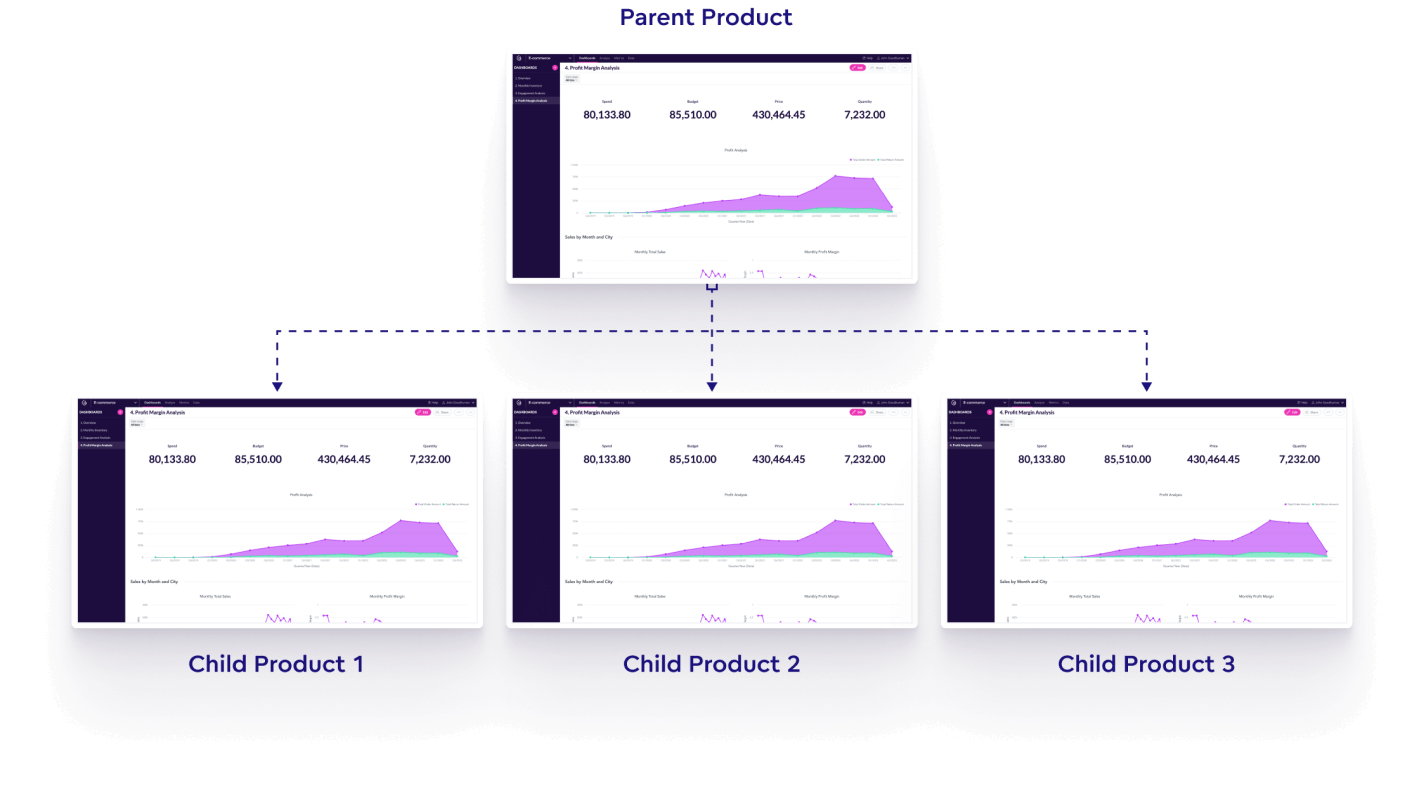
Scale your BI with our multi-tenant architecture
Dynamically scale your business intelligence and accommodate increases in data volume, end users, and business partners.
- Distribute personalized analytics instances to teams, partners, or customers via multitenancy.
- Advanced caching delivers great performance and keeps cloud data warehouse costs low.
Ensure trust in your data, from source to dashboard
Take advantage of comprehensive testing, validation, and monitoring for consistent and accurate data, no matter where it is consumed.
- Everything is under strict version control, with iterations stored and revertible.
- Robust semantic layer ensures a single source of truth.
Secure your data, users, and business


Features BI builders love
GoodData connects with