This documentation is for an older version of GoodData.
Go to the latest version of this article.
Interactive Code Examples
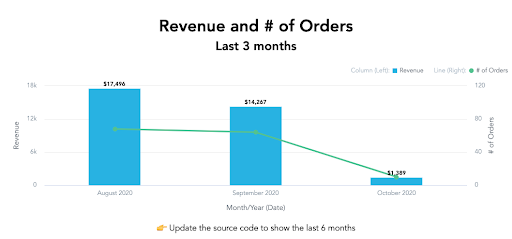
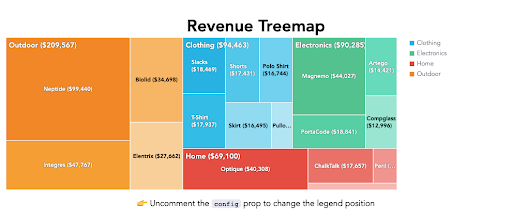
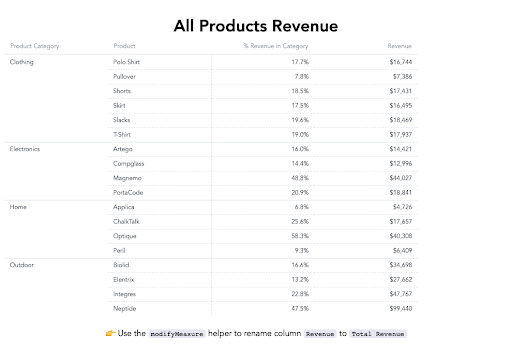
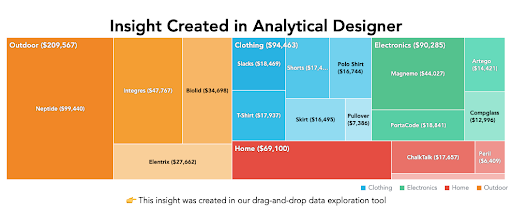
We have created a number of simple interactive examples using CodeSandbox.io. Each example points to a CodeSandbox screen that includes a simple GoodData.UI code next to a resulting visualization.
Feel free to play with the sample code in your browser to see how the visualizations update just after changing the component properties - for your convenience, we have added hints to most of the examples.
Let’s start with a simple headline widget!
| Headline |
|
| ComboChart |
|
| RelativeDateFilter |
|
| ChartConfig |
|
| PivotTable |
|
| InsightView |
|
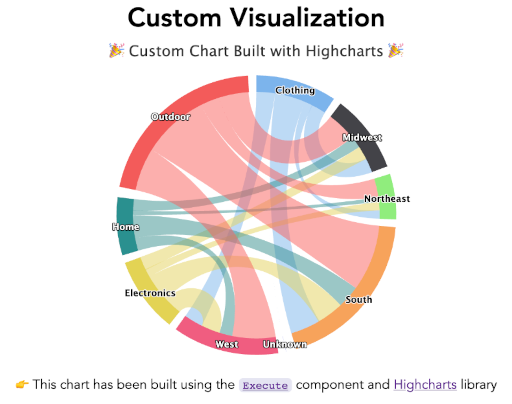
| Execute |
|
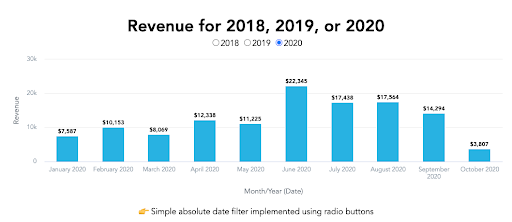
| Year Filter |
|
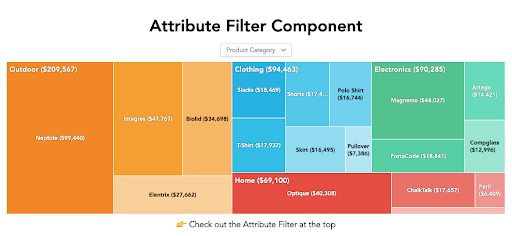
| AttributeFilter |
|
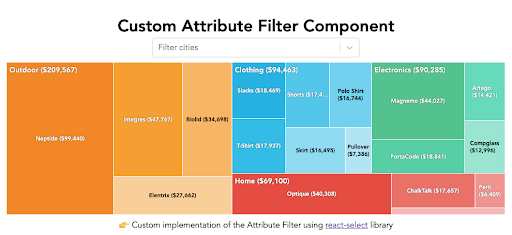
| Custom Attribute Filter |
|
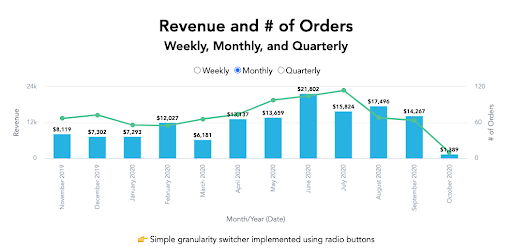
| Granularity |
|
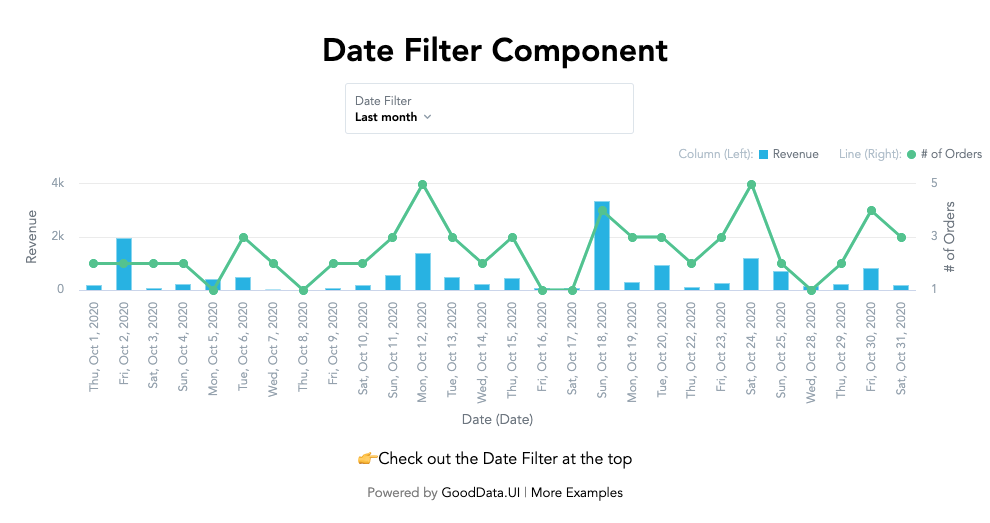
| DateFilter |
|
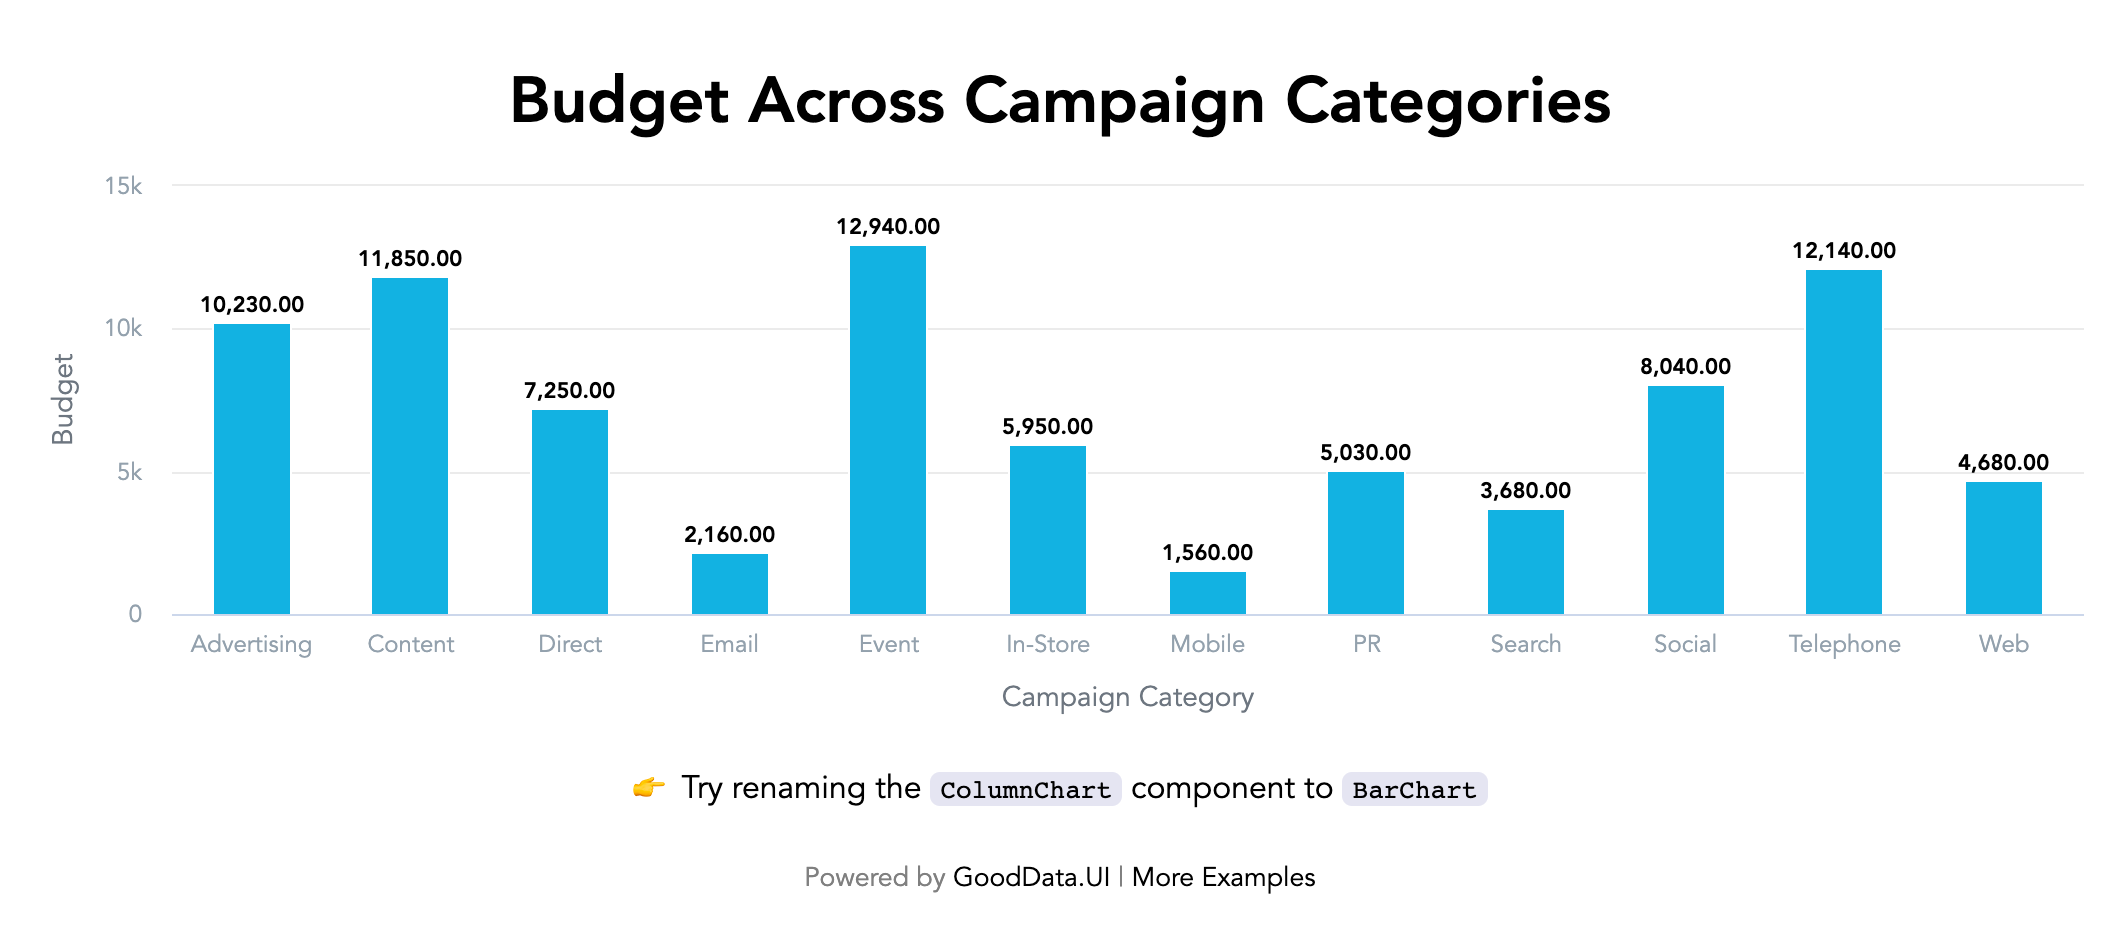
| ColumnChart |
|
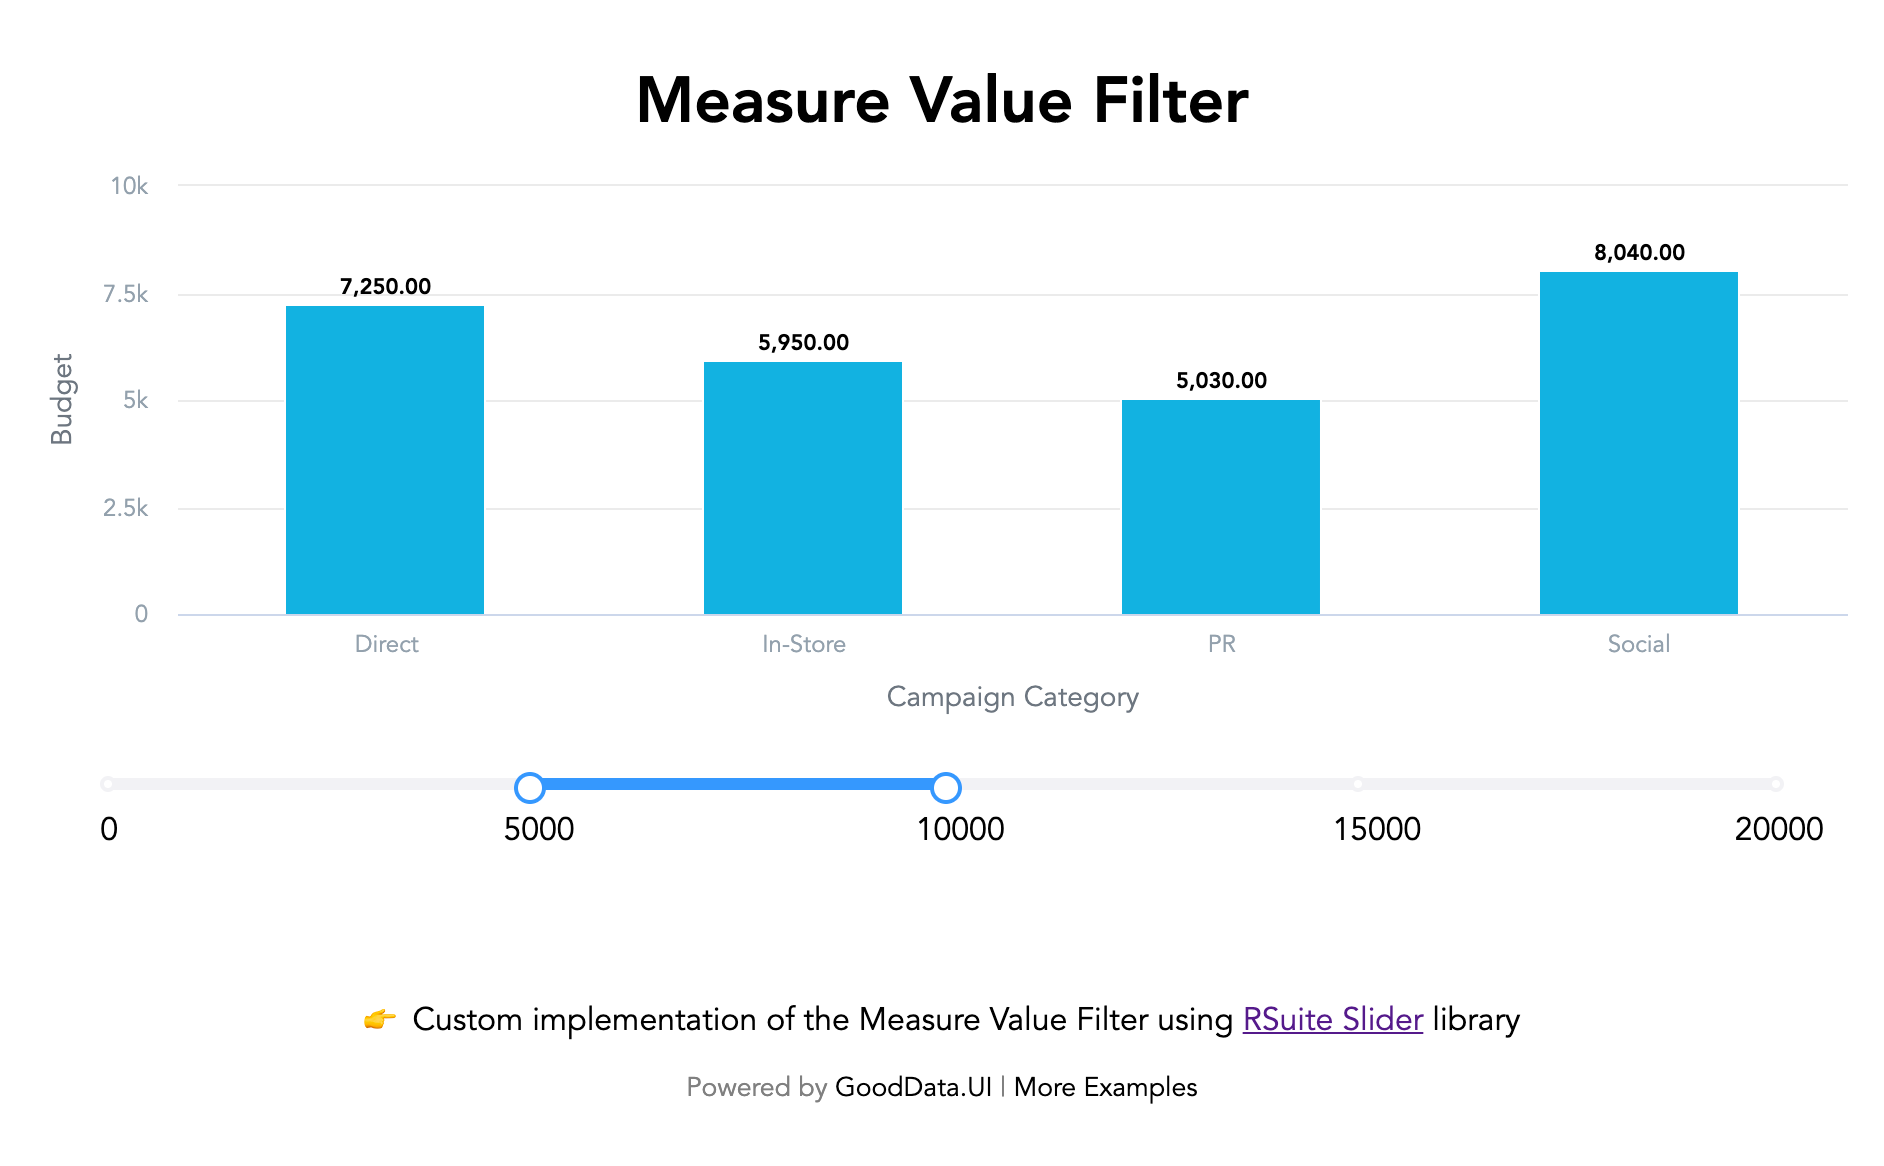
| Measure Value Filter |
|


