This documentation is for an older version of GoodData.
Go to the latest version of this article.
Filters
When filtering, you want to remove specific values from the original data in a Visualization, so it shows only the relevant subset. Filtering allows you to narrow the scope of a visualization without changing the visualization itself.
You can create filters based on attribute values, metric values, or dates.
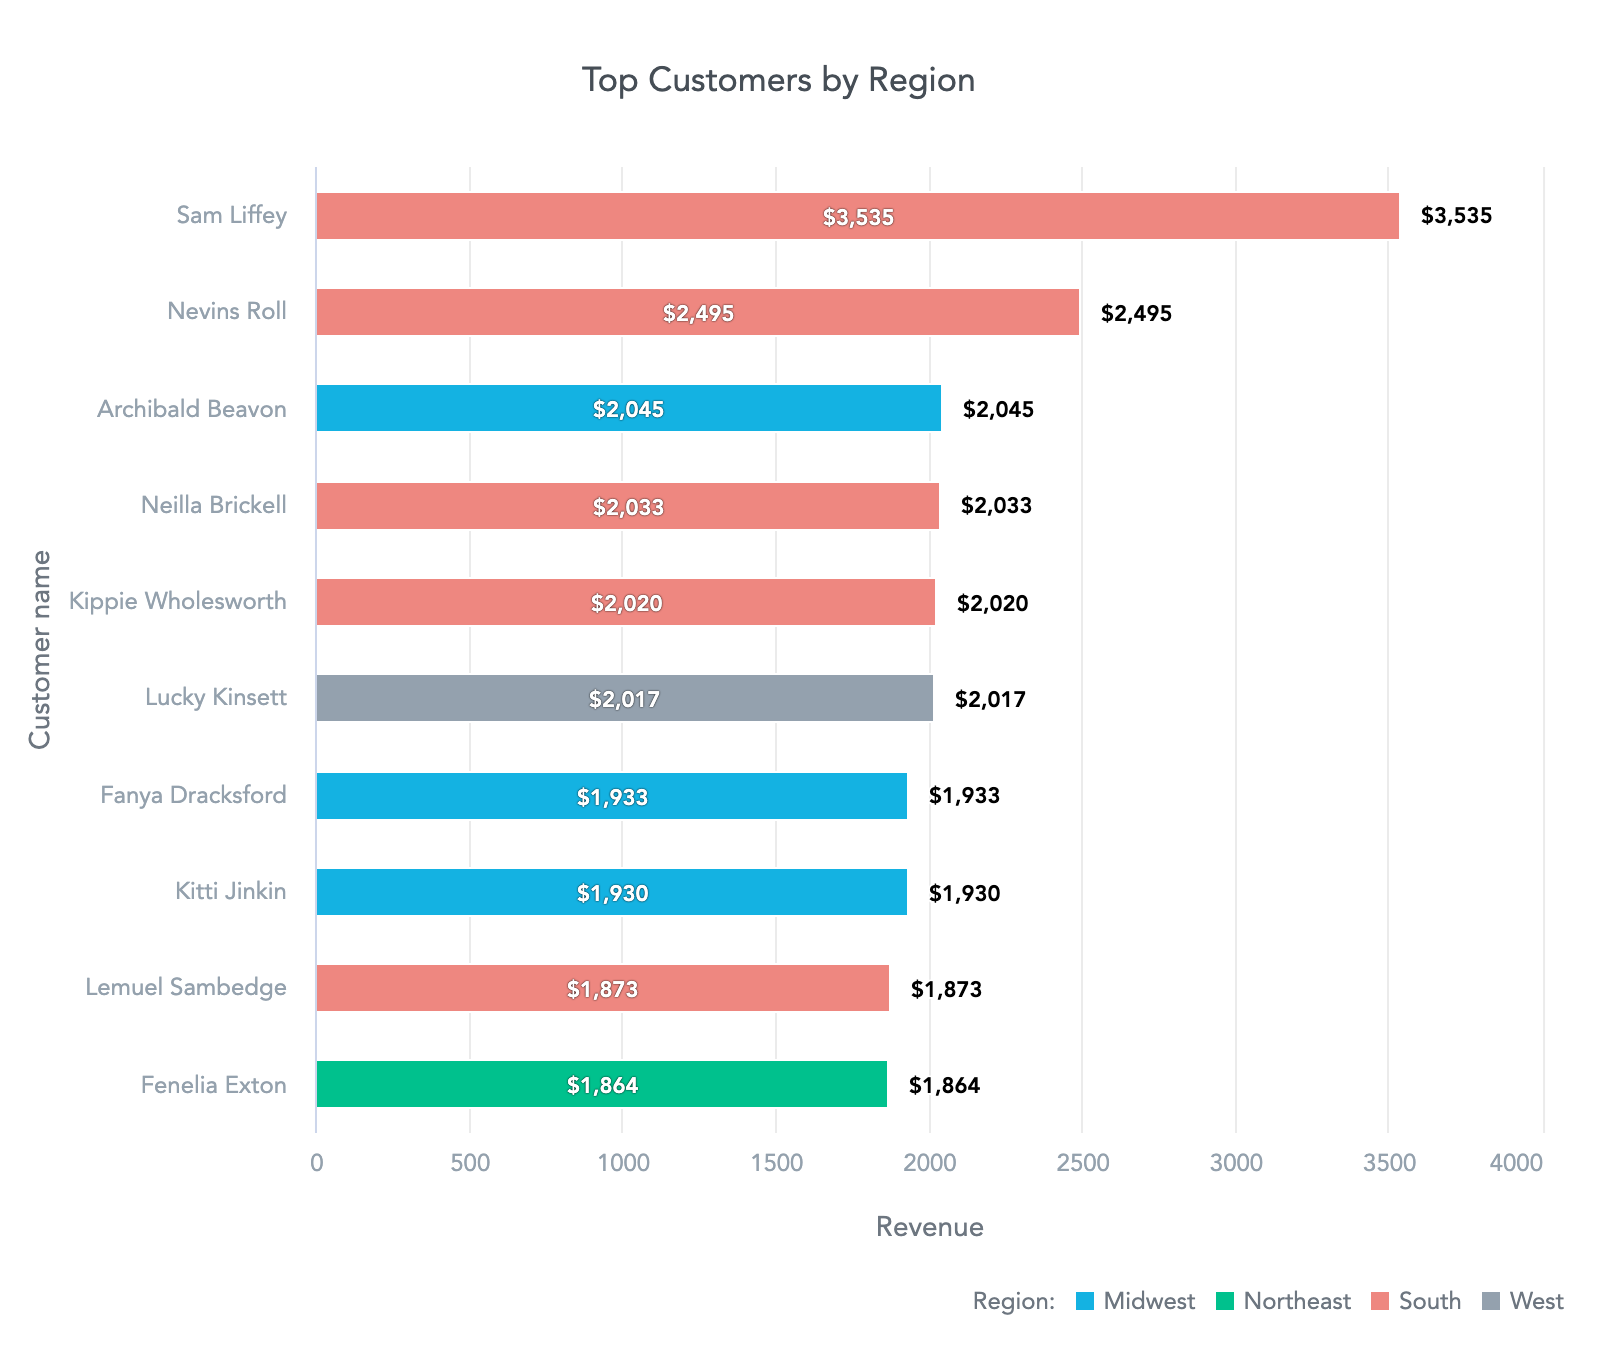
For example, if you have a visualization showing the Top customer per region:

You may want to display the data:
only for a specific period (dateFilter):
- last month
- previous year
- last two weeks

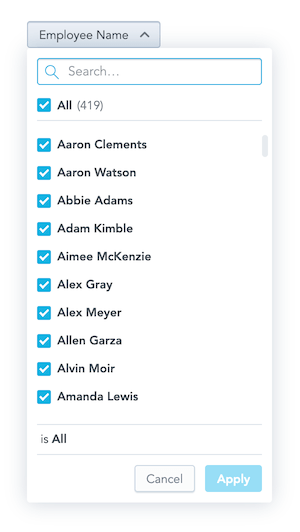
only for a specific customer (attributeFilter):
- Kitti Jinki
- Aaron Clements
- some combination of customers

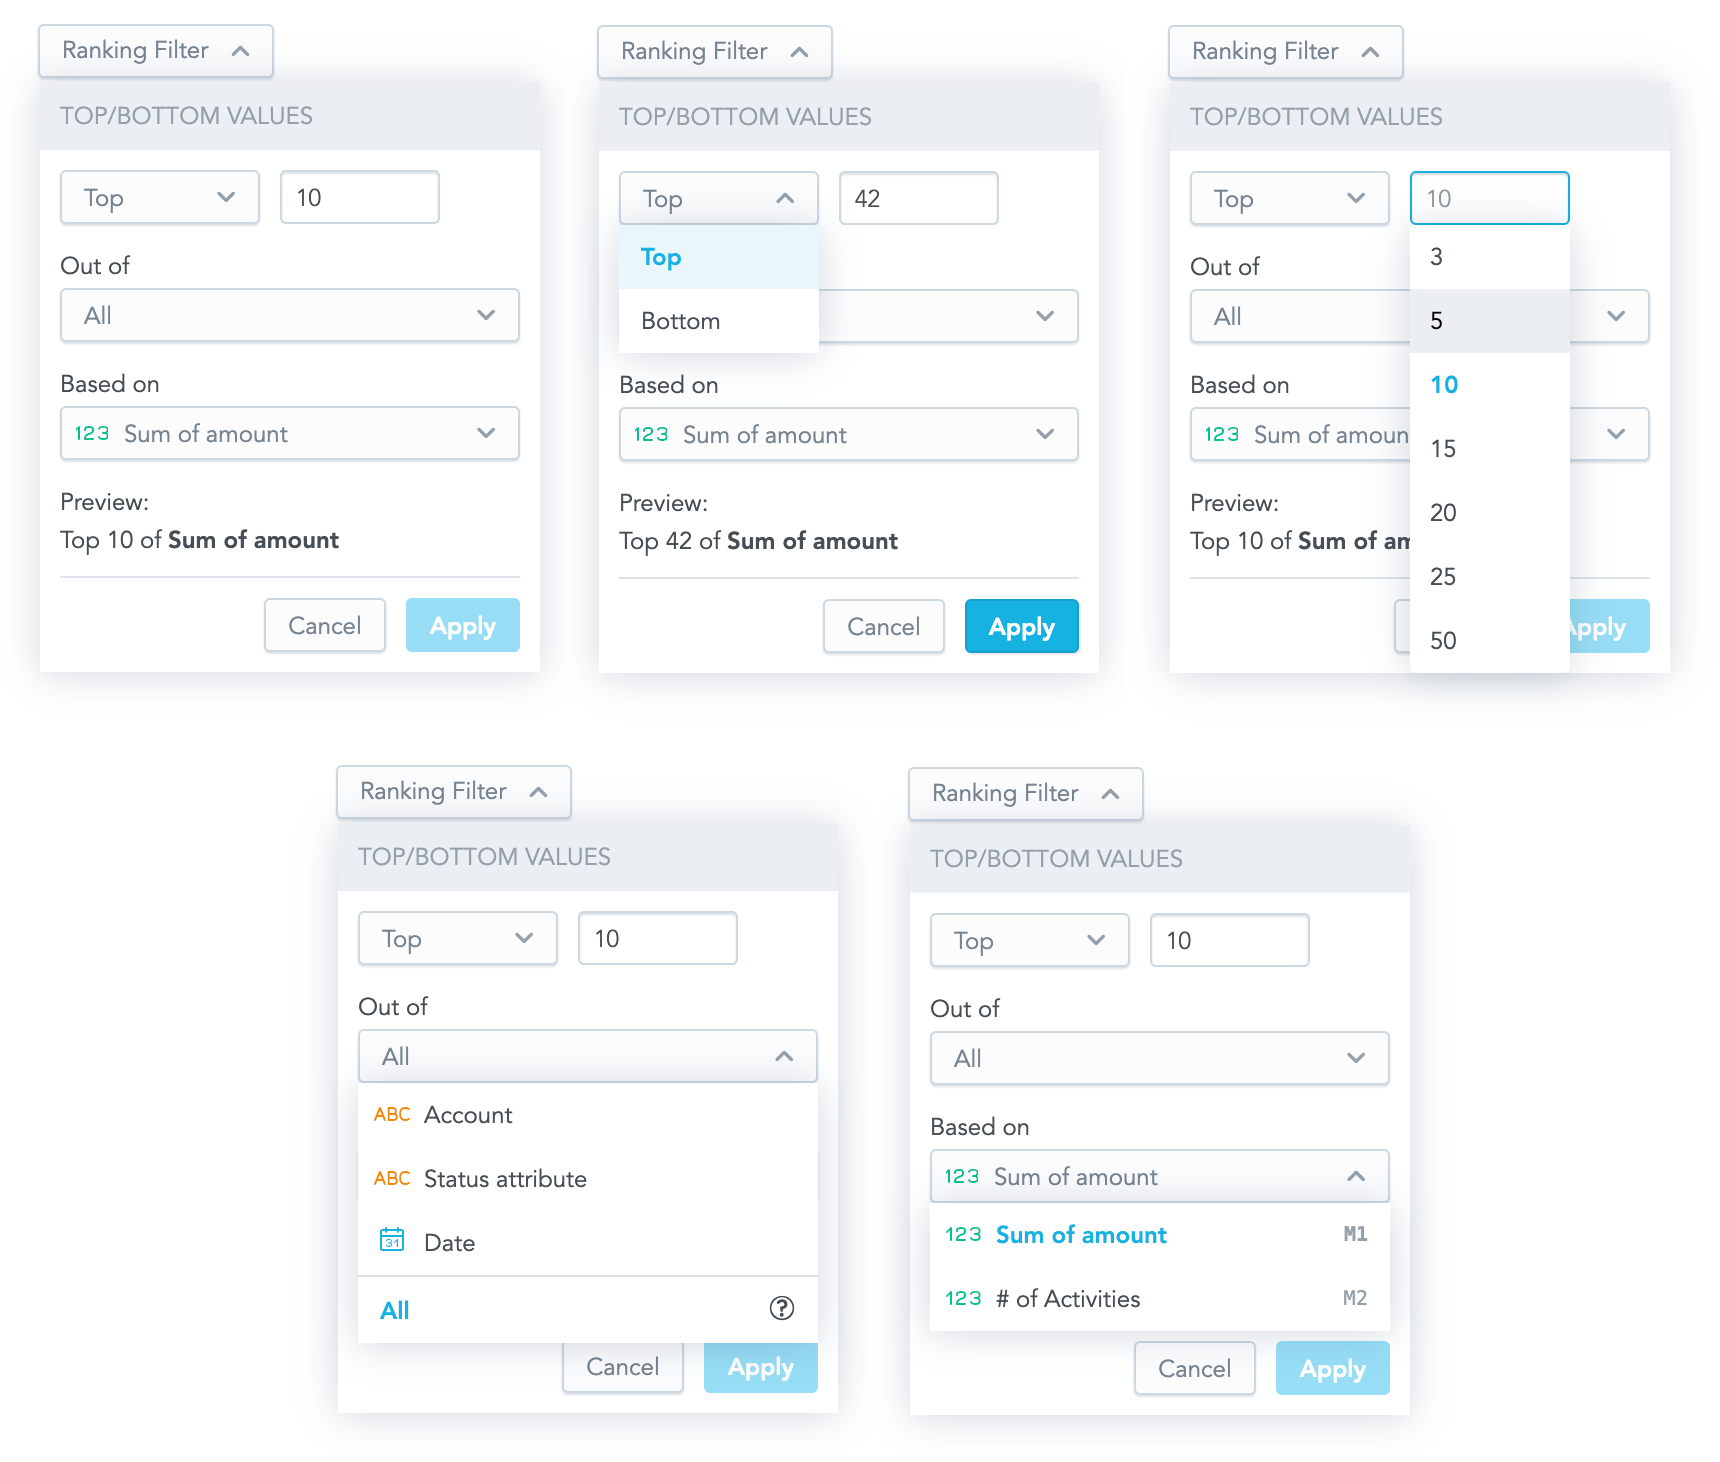
only the top/least sold products (rankingFilter):
- top 10 customers by # of orders
- bottom 10 customers but their ARR
- top 3 customers by their ARR

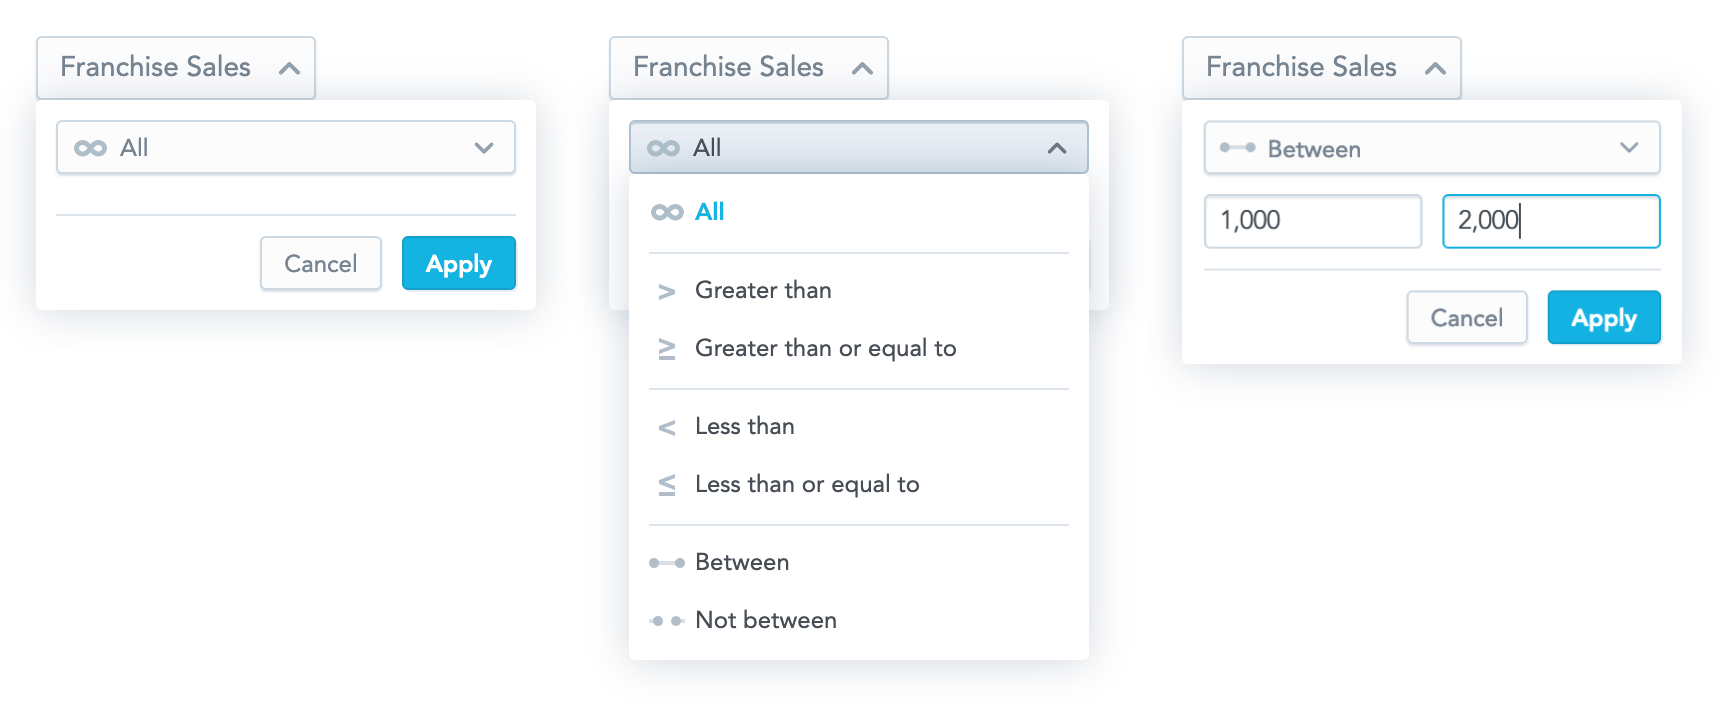
only products within the custom range (measureValueFilter):
- customers with ARR over 1000k $
- customers with ARR less than 100k $
- customers with ARR between 100k $ and 1000k $
