Advanced Modelling Use Cases
Every database is different, and sometimes one or more of the following edge case scenarios may need to be considered when modelling the data.
Multiple Datasets Mapped to the Same Table
This is typically needed when one table represents multiple logical entities, and each entity should be represented by a separate dataset in the LDM.
While the LDM Modeler supports mapping of multiple datasets to the same table, publishing an LDM with such mapping fails.
To avoid this issue, create multiple views on top of the table and map each dataset to a separate view.
For example, you have two tables, users and tickets.
- The
userstable contains ticket creators and assignees. - The
ticketstable contains theassignee_idandcreator_idcolumns.
To avoid mapping multiple datasets to the users table, do the following:
- In the database, create two views on top of the
userstable:v_users_assigneesandv_users_creators. - In the LDM, create three datasets:
assignees,creators, andtickets. - Map the
ticketsdataset to theticketstable. - Map the
assigneesdataset to thev_users_assigneesview. - Map the
creatorsdataset to thev_users_creatorsview. - Create a relationship from the
assigneesdataset to the theticketsdataset using theassignee_idcolumn as a primary key in theassigneesdataset. - Create a relationship from the
creatorsdataset to theticketsdataset using thecreator_idcolumn as a primary key in thecreatorsdataset.
Using Multiple Data Sources in an LDM
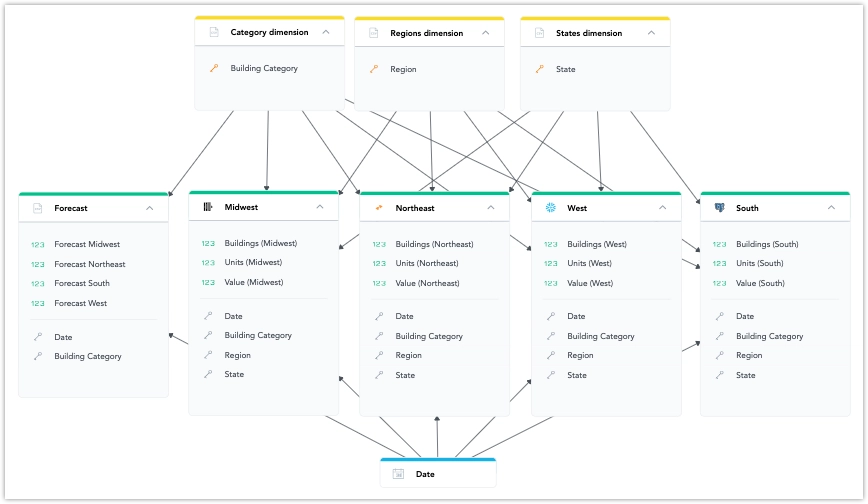
- You can use datasets from different data sources in an LDM. They can be connected using common attribute or date dimension datasets.
- The list of data sources prioritizes those already used in the current model. You can change the data source in dataset mapping.
Limitations
- Using multiple data sources in an LDM is not compatible with the Unique Data Sources for Tenants feature.
Understanding Data Federation, Data Blending, and Data Joins
Data Federation:
Data federation creates a virtual layer that lets users access and query data from multiple sources without moving or copying it.Data Blending:
Data blending combines specific subsets of data from multiple sources for analysis in a single visualization.Data Joins:
The key difference between data blending and traditional joins is the timing of the operation:- In traditional joins, the join is usually performed before aggregation within the database.
- In data blending, the operation is typically applied after aggregation, using data that has already been processed from different sources.
Blending Data from Multiple Sources in a Single Visualization
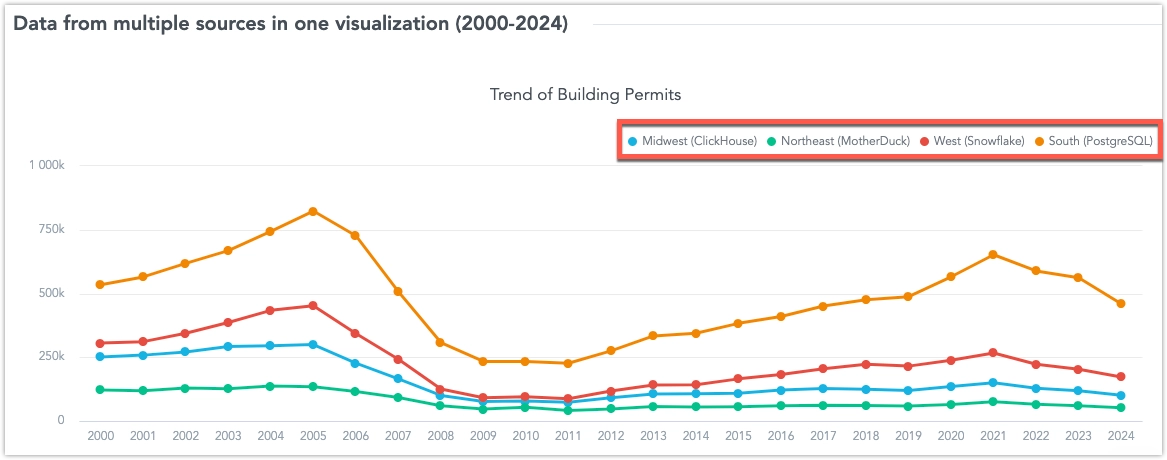
You can create visualizations that use multiple metrics from different data sources. These metrics are blended into one common result set using shared conformed dimension attributes. This approach allows you to connect data from multiple sources in real-time, giving you a complete view of your business without the need for complex data movement.
The common attributes can be:
- An attribute of a date dimension dataset referenced in each data source used for data blending.
- An attribute defined as a primary key in a dimension dataset, present as a foreign key in each data source used for data blending.
These common dimension attributes can be used for breaking down metrics, grouping, slicing, or filtering in a visualization that uses blended data.
Attributes are defined by their primary label (e.g., Federal Information Processing Standard state code). Optionally, you can define a secondary label (e.g., a user-friendly display name like “California”) in the dimension dataset. In this case, blended visualizations will display this label, even if the secondary label is not present in all data sources.
However, using secondary labels for common attributes requires retrieving all dimension attribute values during queries, which can slow down processing. For this reason, we recommend avoiding secondary labels for attributes with high cardinality.
Limitations
Metrics from different sources can only be sliced or filtered using attributes that are:
- References to common dimension datasets.
- Present in each data source involved in the visualization.
Only fact-based metrics can be used.
The Show as Percent feature works only with a single non-date attribute.
A fact table can be directly linked to a dataset, but there can only be one data source change in a single path of relationships.
For example:
Country (Snowflake) -> County (BigQuery) -> City (Snowflake) -> Facts (Snowflake)
In this example, the path changes data sources twice (from Snowflake to BigQuery and back to Snowflake), which is not supported.

