4. Create Visualization
Now you can start creating visualizations. Visualizations include charts, graphs, maps, and other graphical elements that help users interpret data trends, patterns, and insights effectively.
Steps:
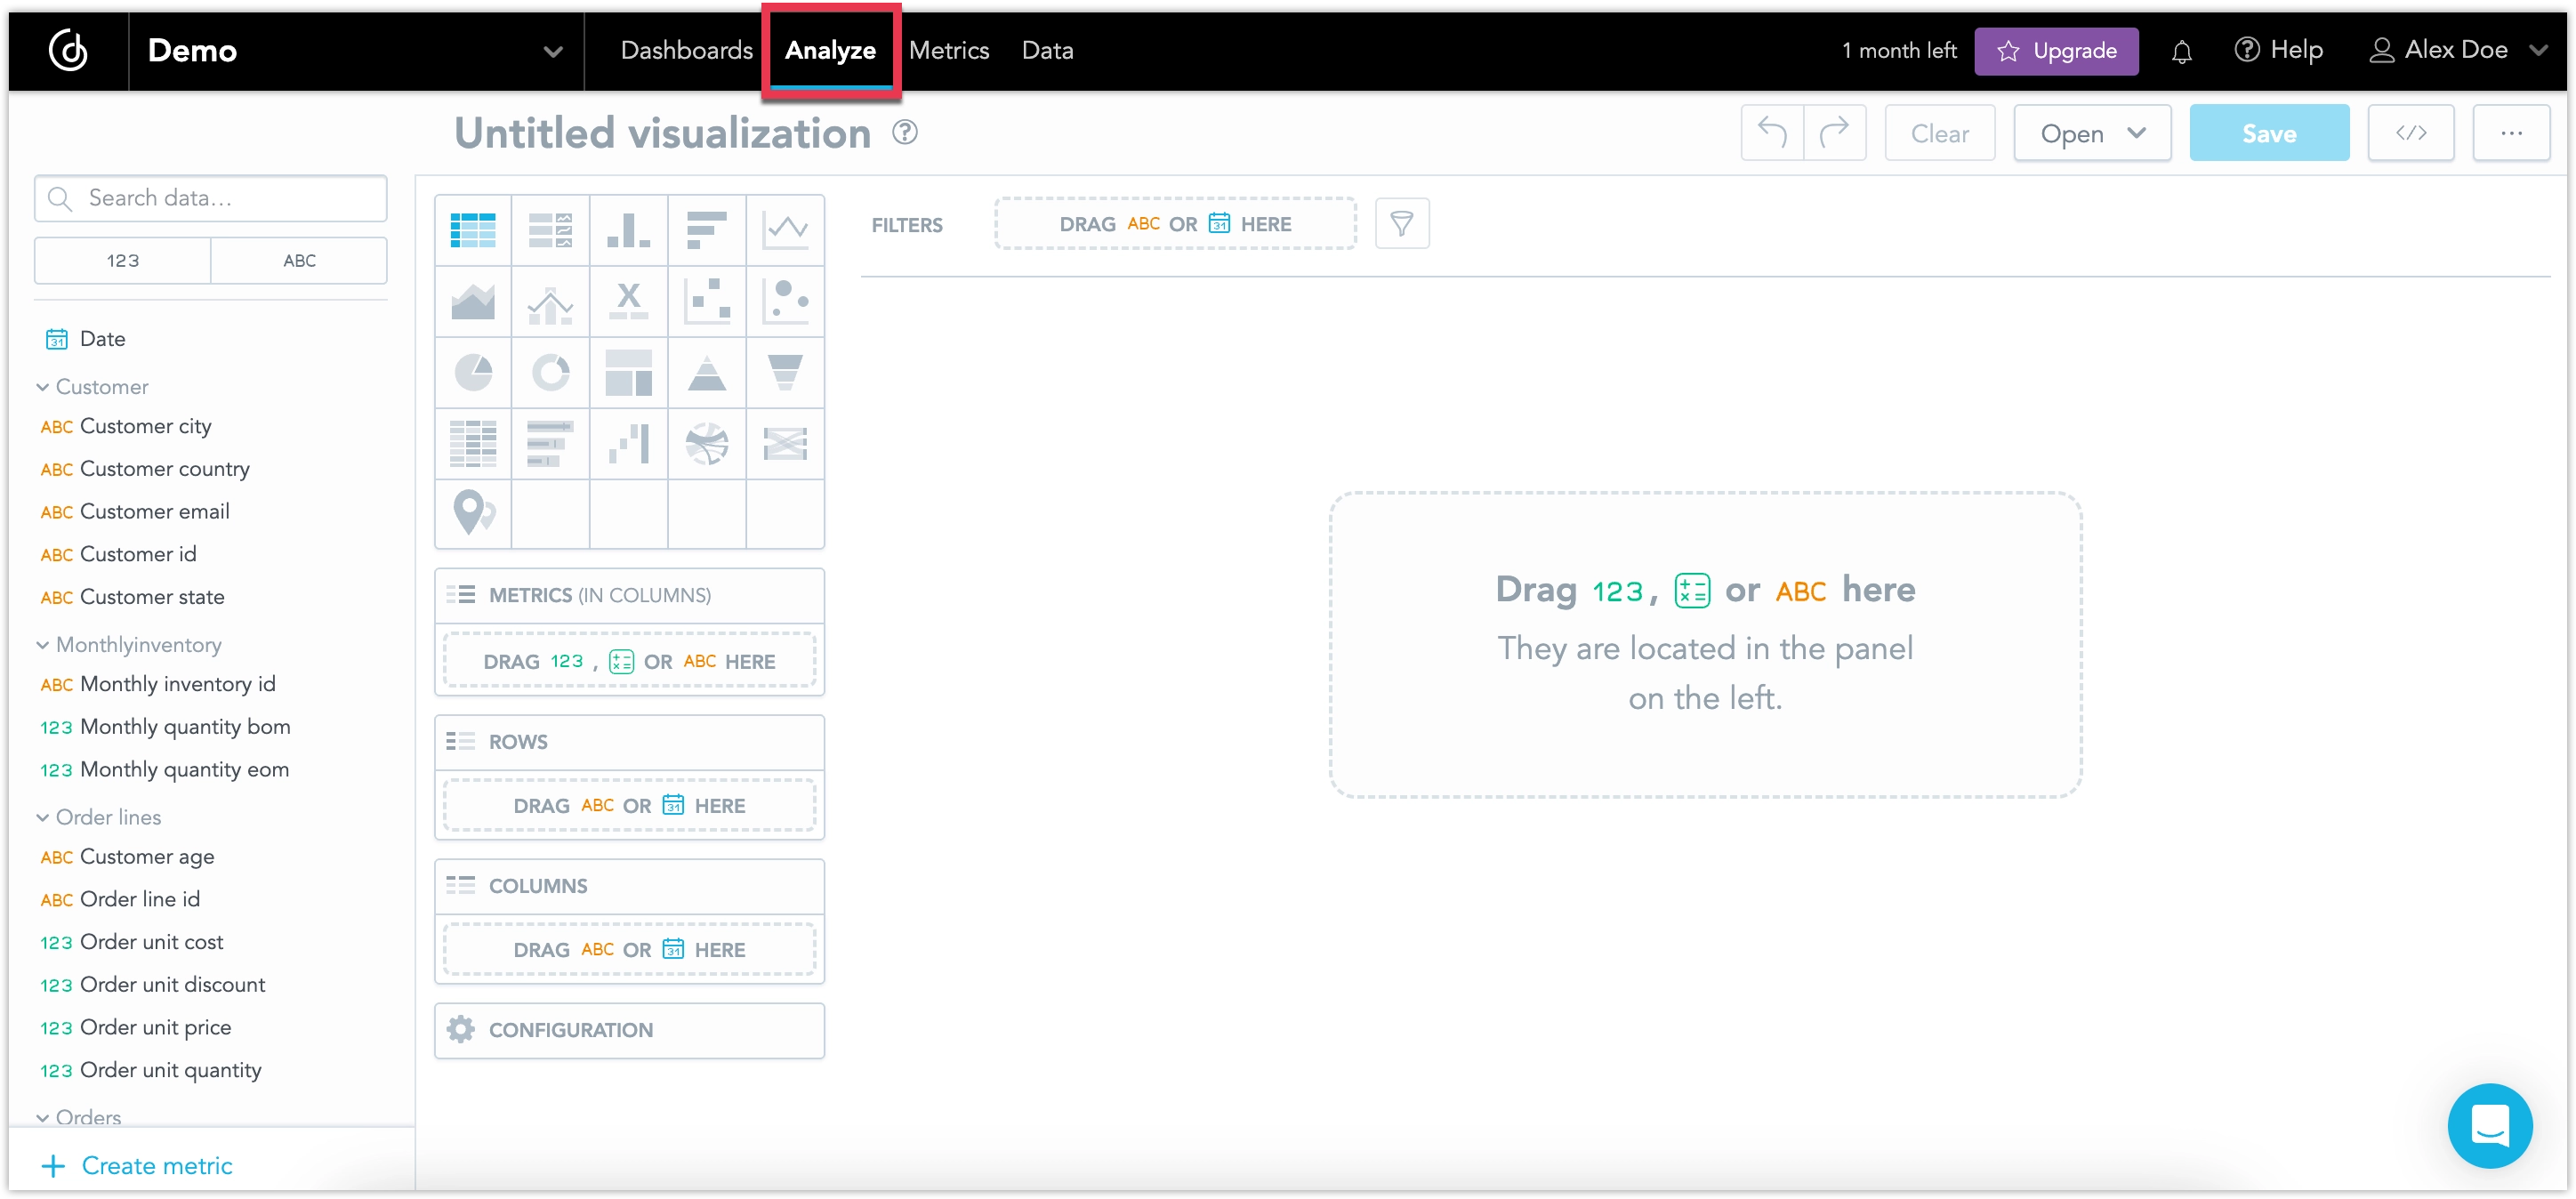
In your workspace, switch to the Analyze tab.
This opens the Analytical Designer, which is where you create or edit your visualizations.
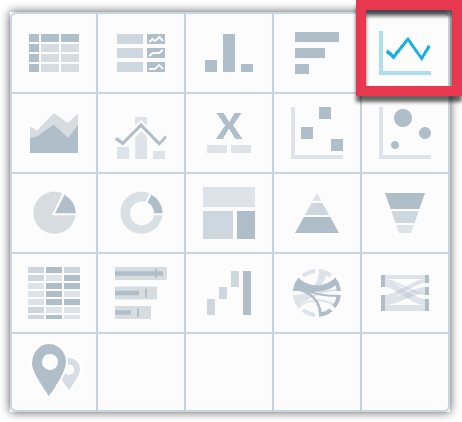
Start by selecting the type of visualization you would like to create, in this example you will use the Line chart.
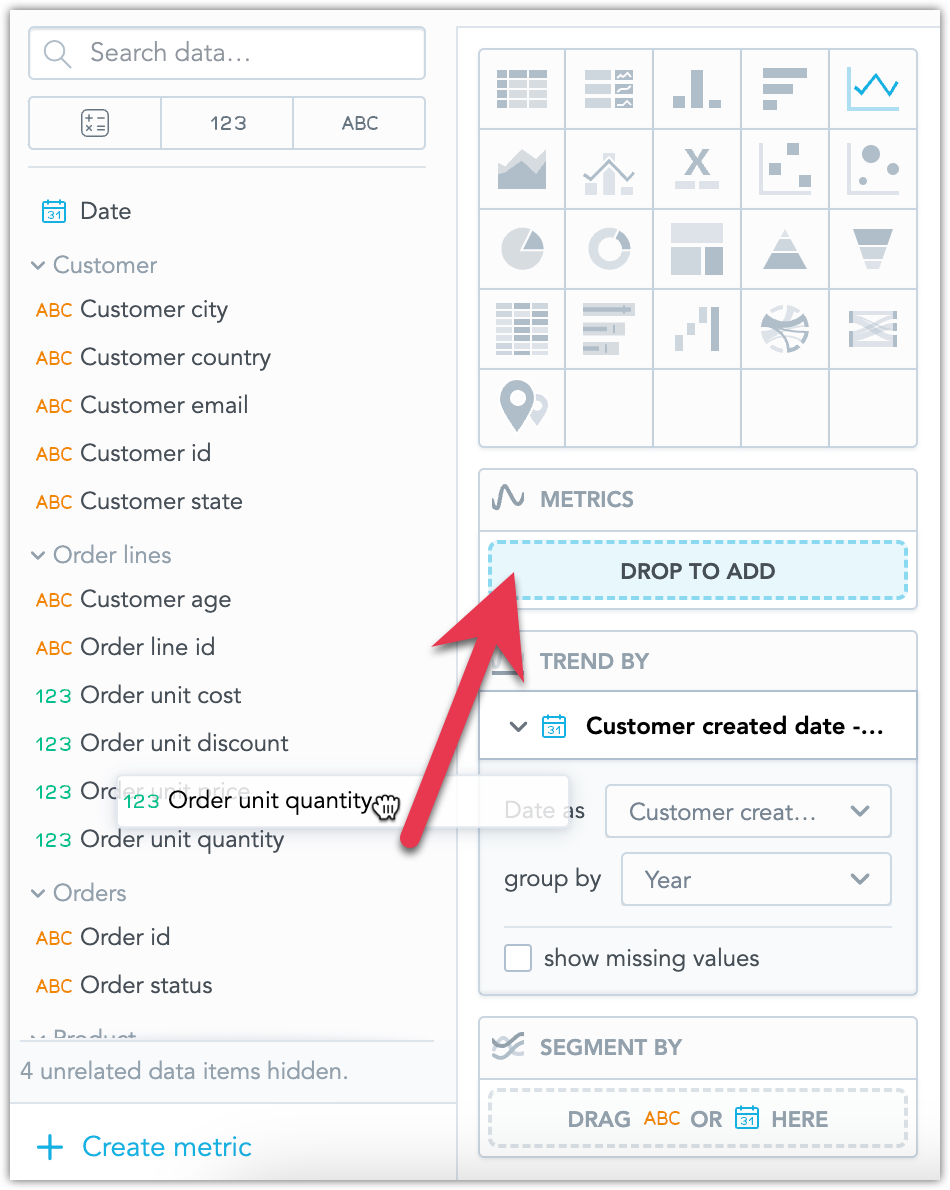
Drag the Date attribute into the Trend by bucket.
This is what will make up the x-axis of the line chart.
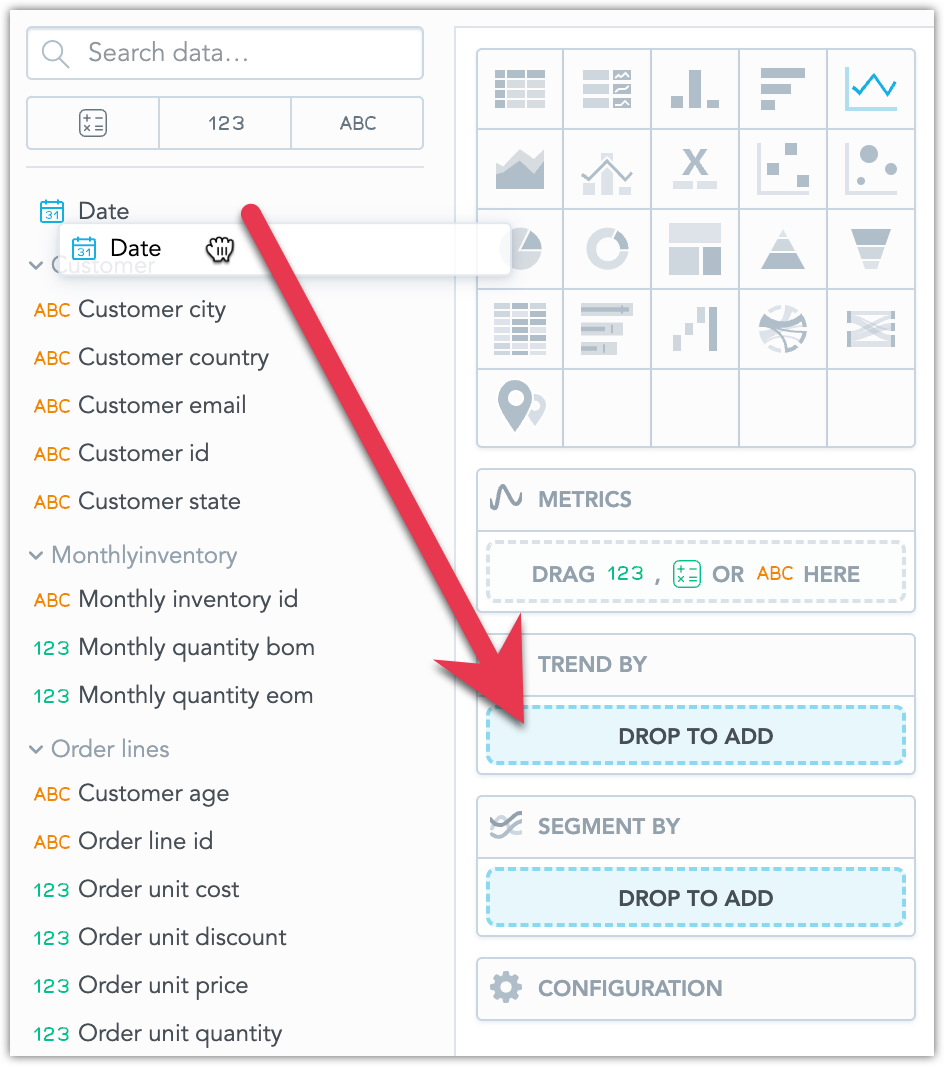
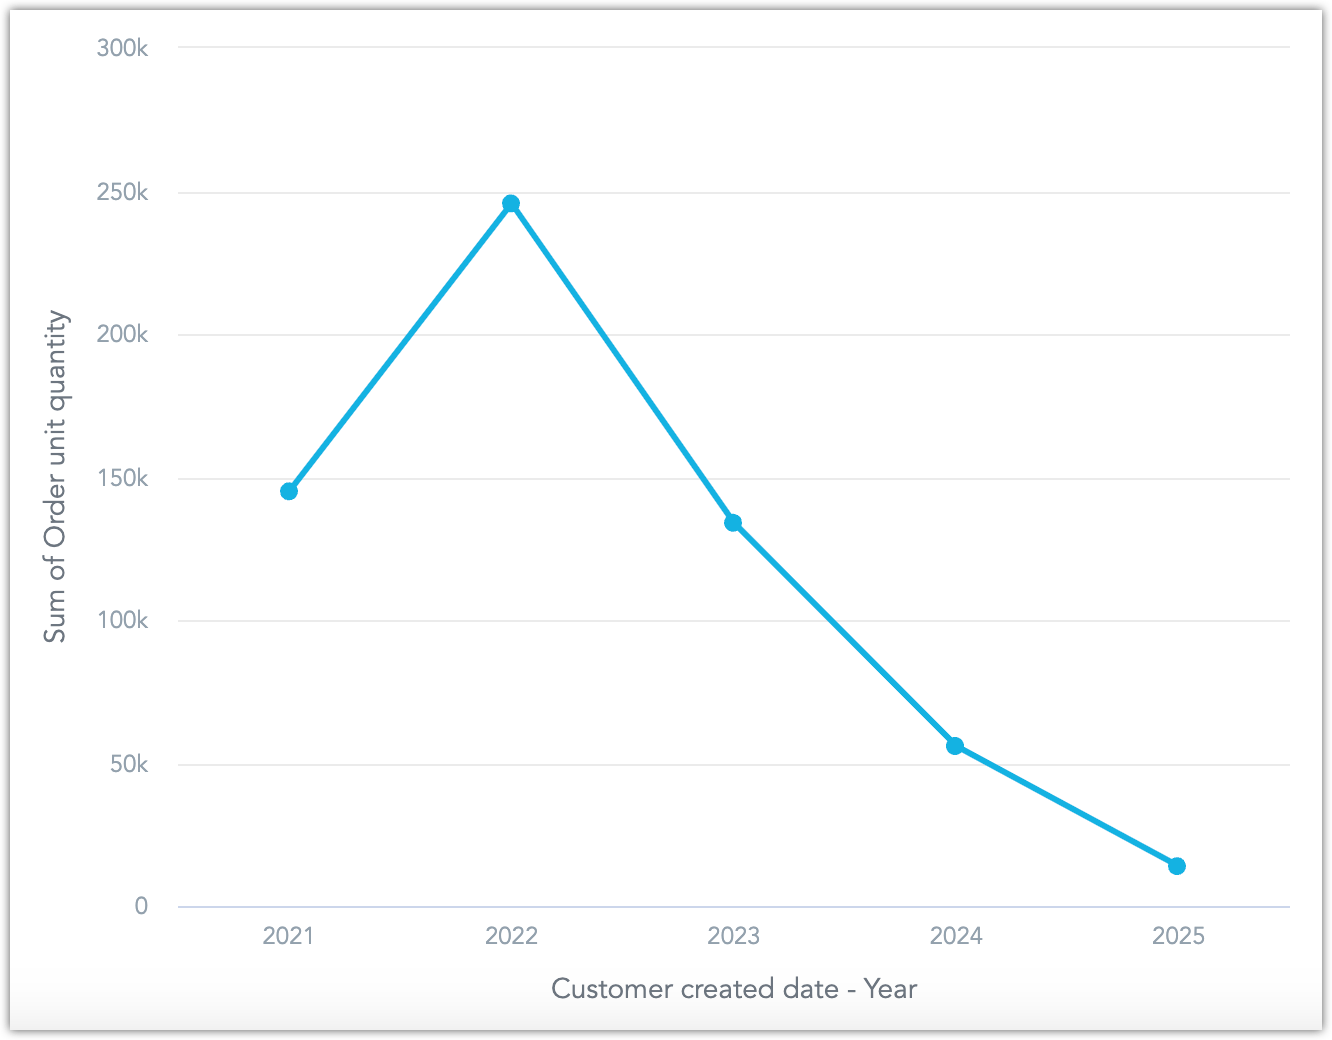
Drag the Order unit quantity fact into the Metrics bucket.
This is what will make up the y-axis of the line chart.
Your line chart is now rendered:
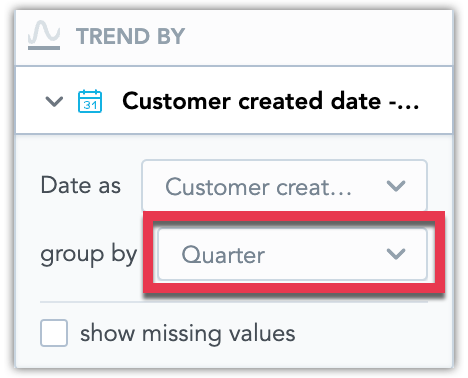
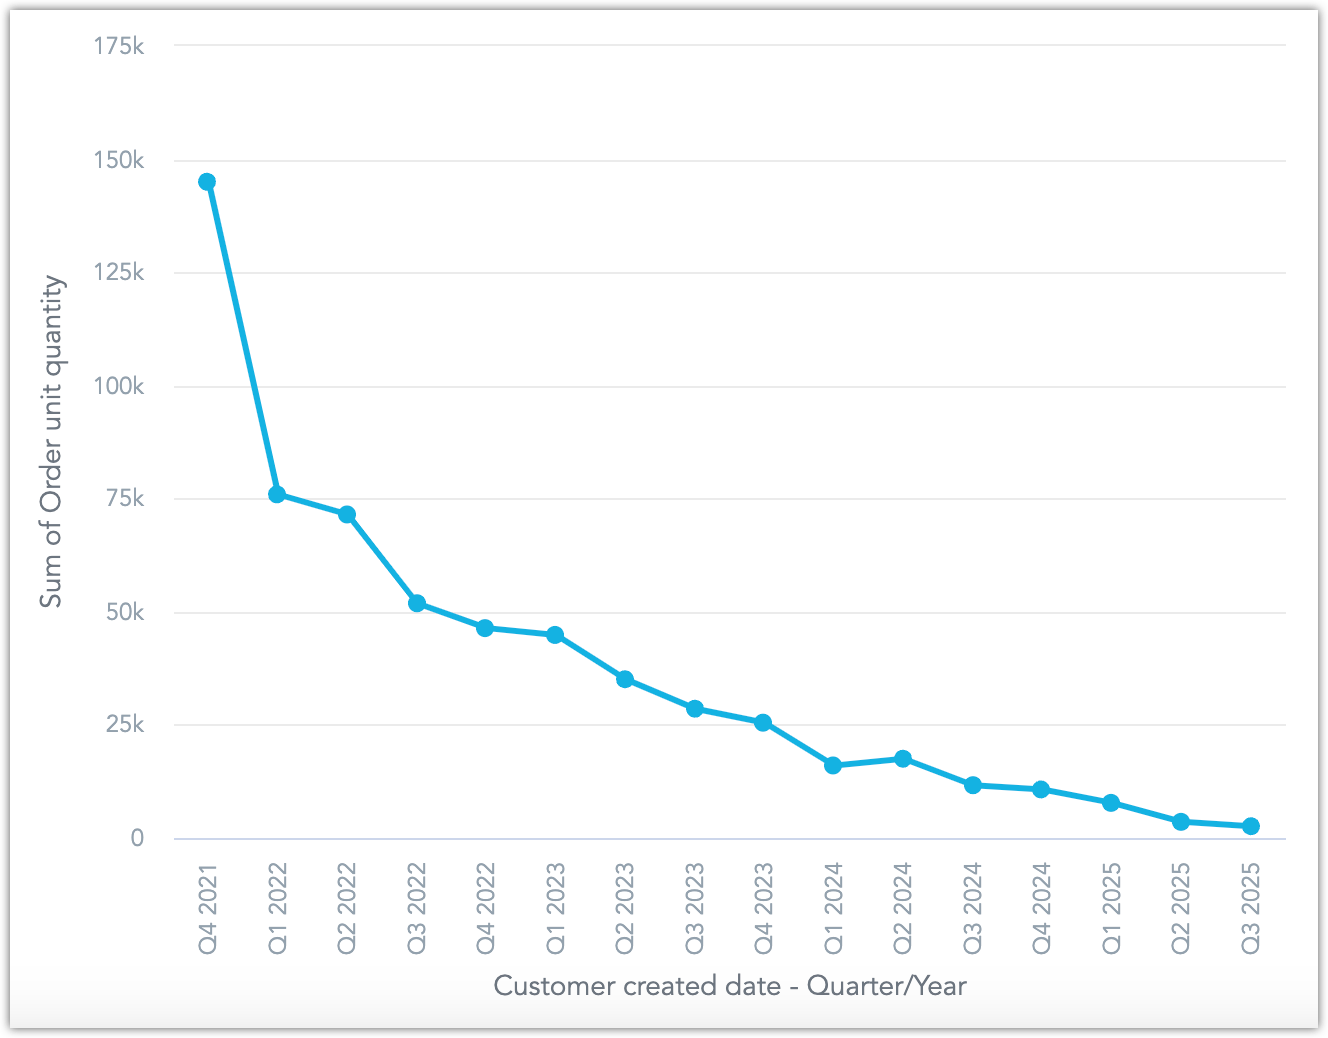
In the Trend by bucket, change the group by granularity from Year to Quarter.
Your line chart is now broken down into quarter year intervals:
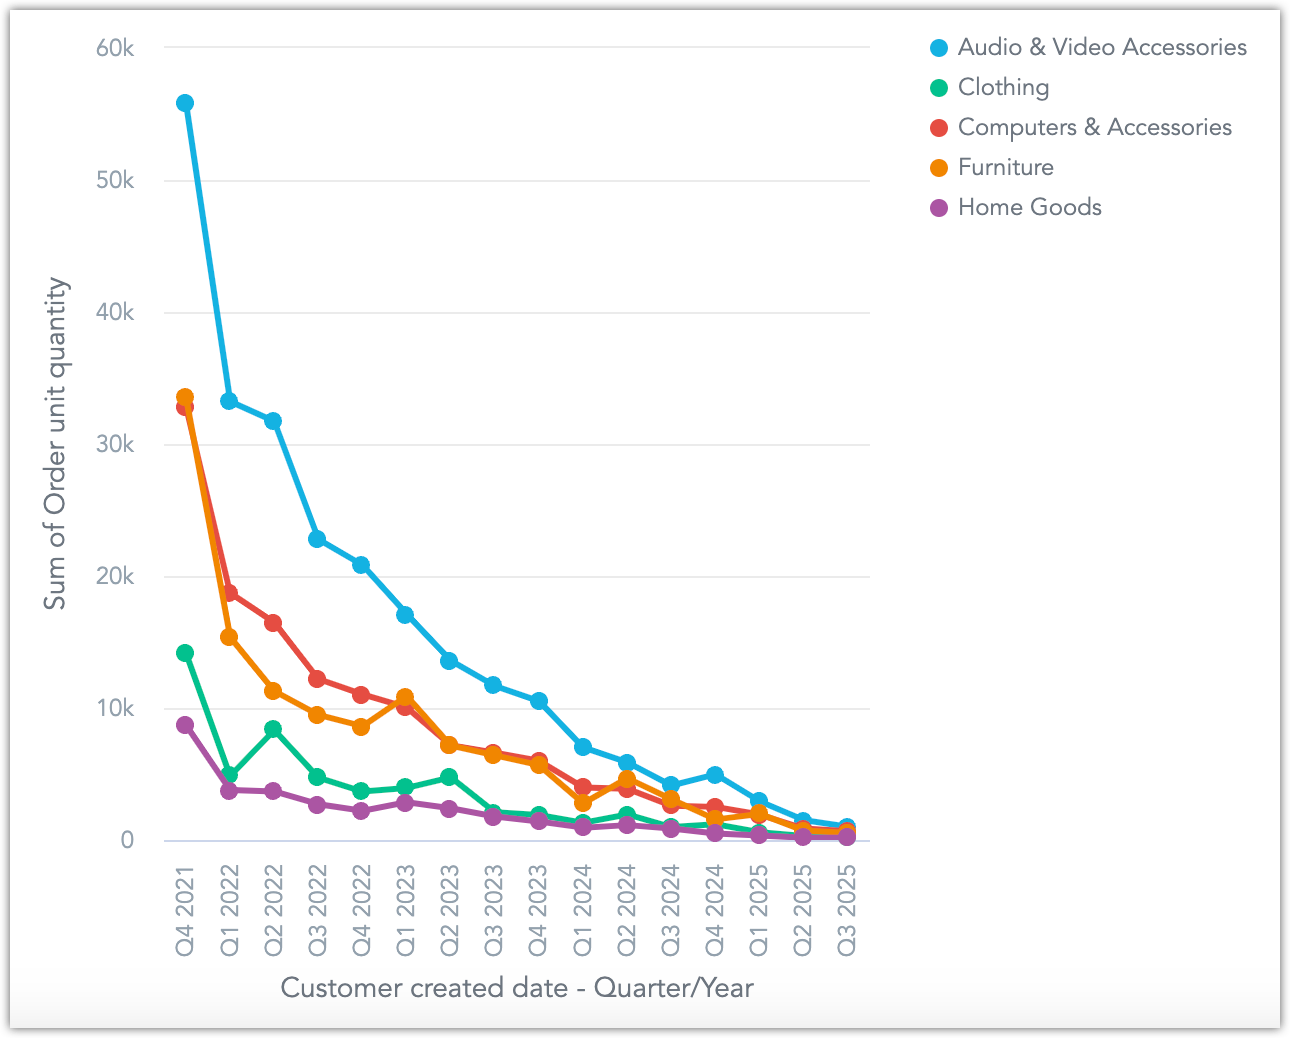
Drag the Product category attribute into the Segment by bucket.
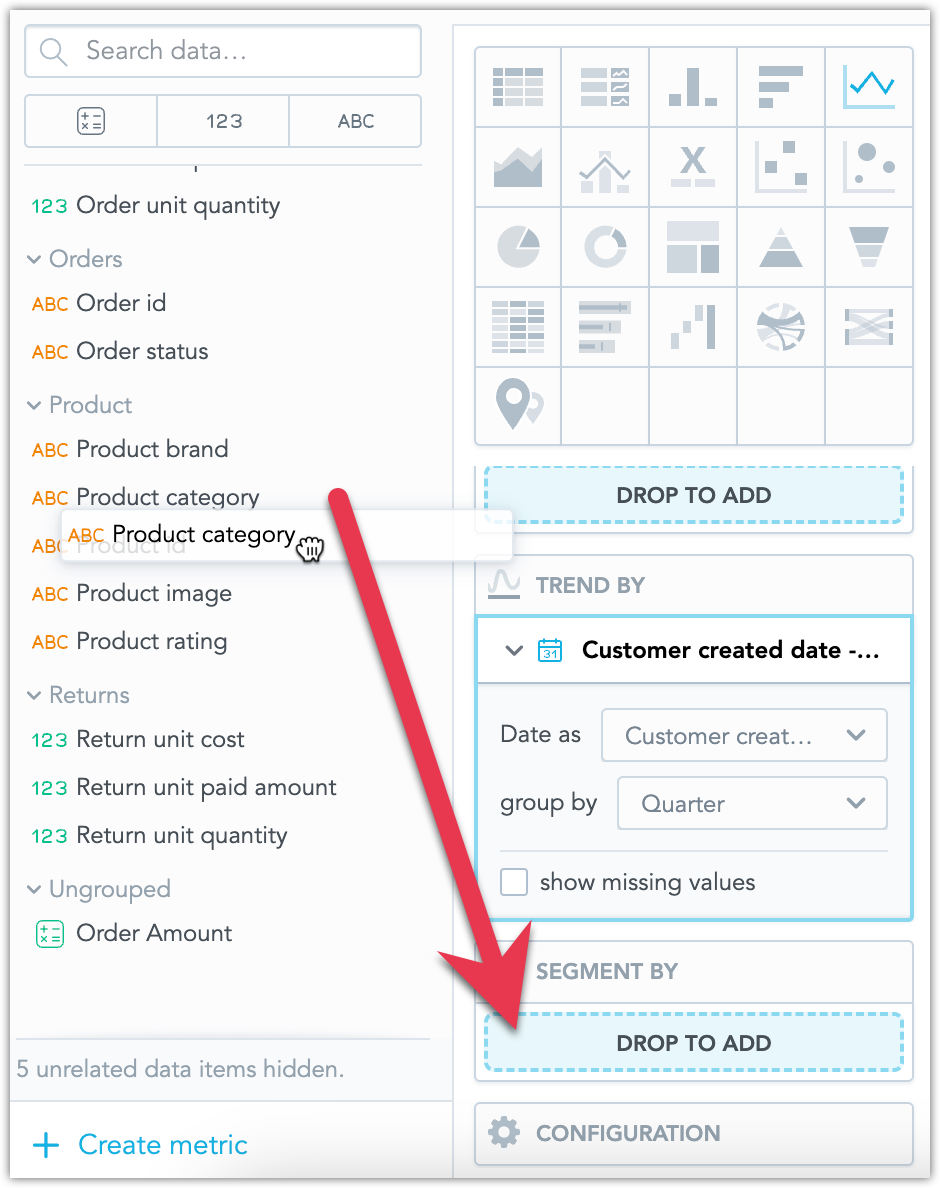
This divides your data into individual product category segments:
Drag the Product category attribute into the Filters bucket.
This will let you filter what data you want your visualization to display.
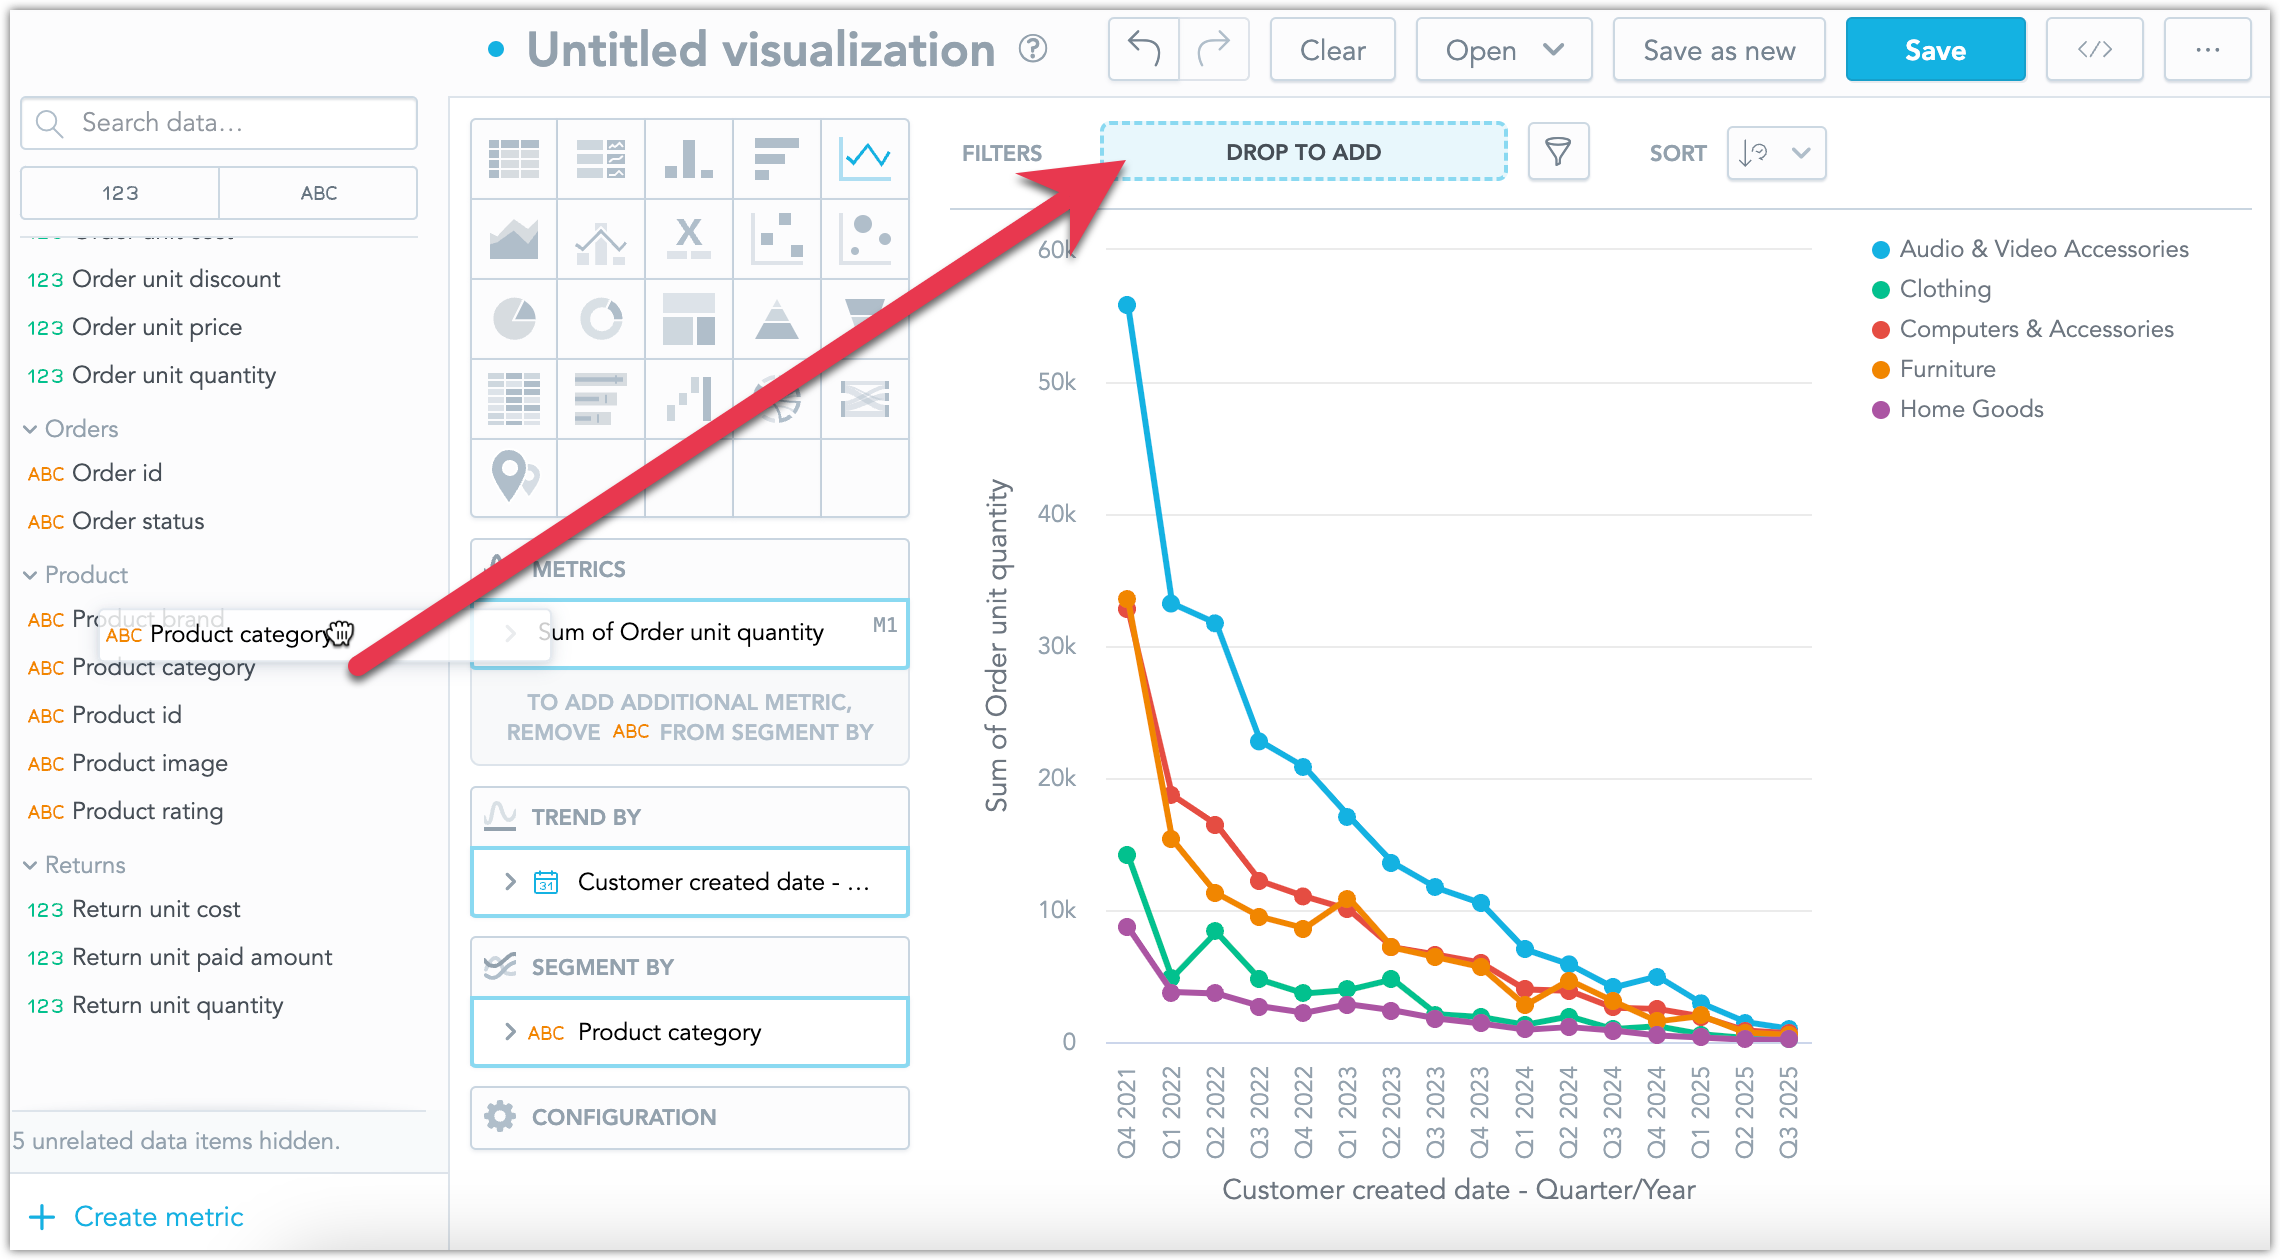
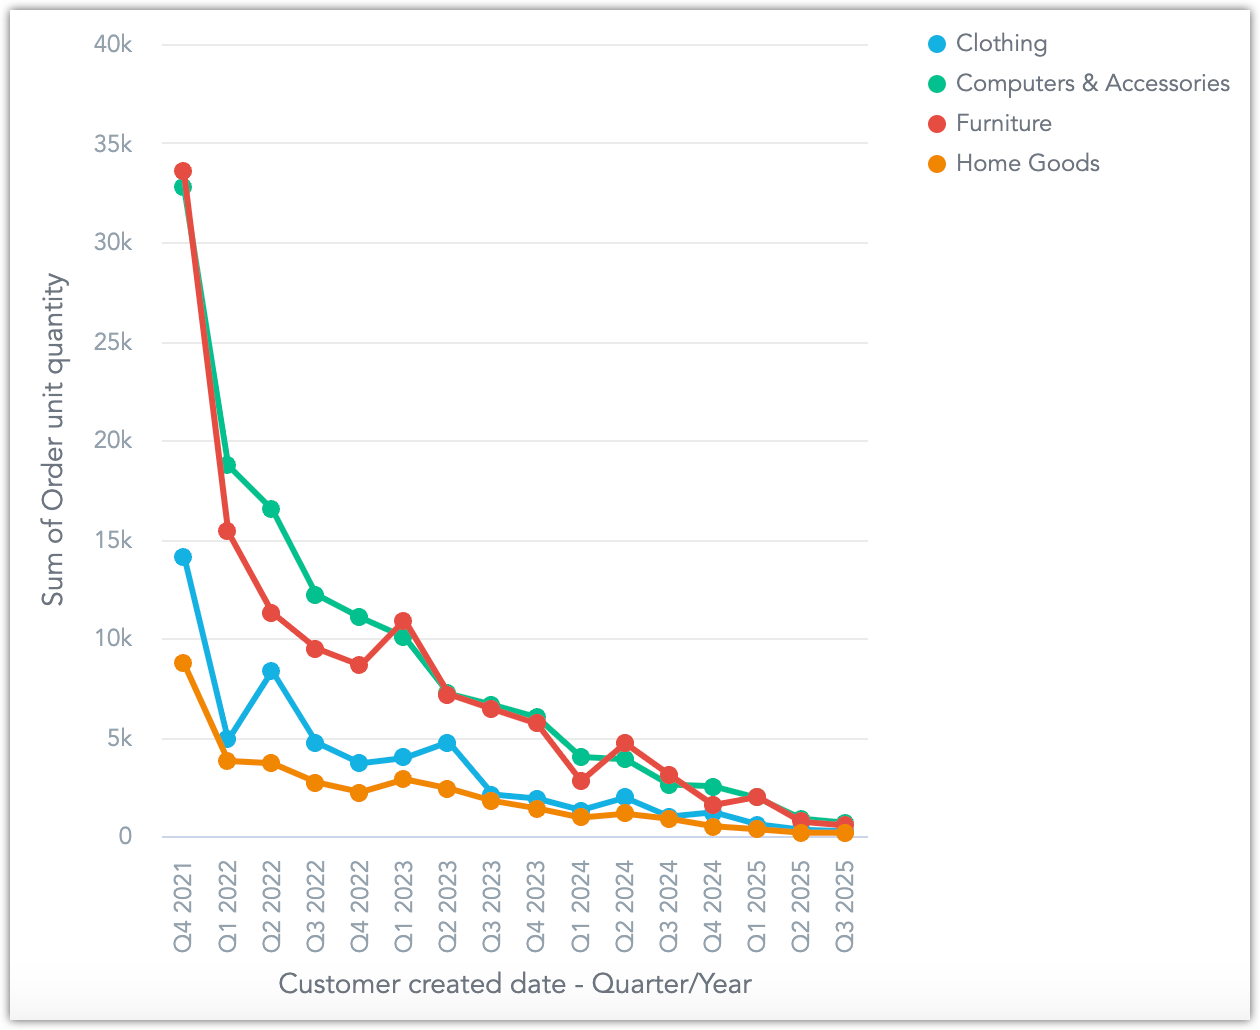
Open the Product category filter, deselect Audio & Video Accessories and click Apply.
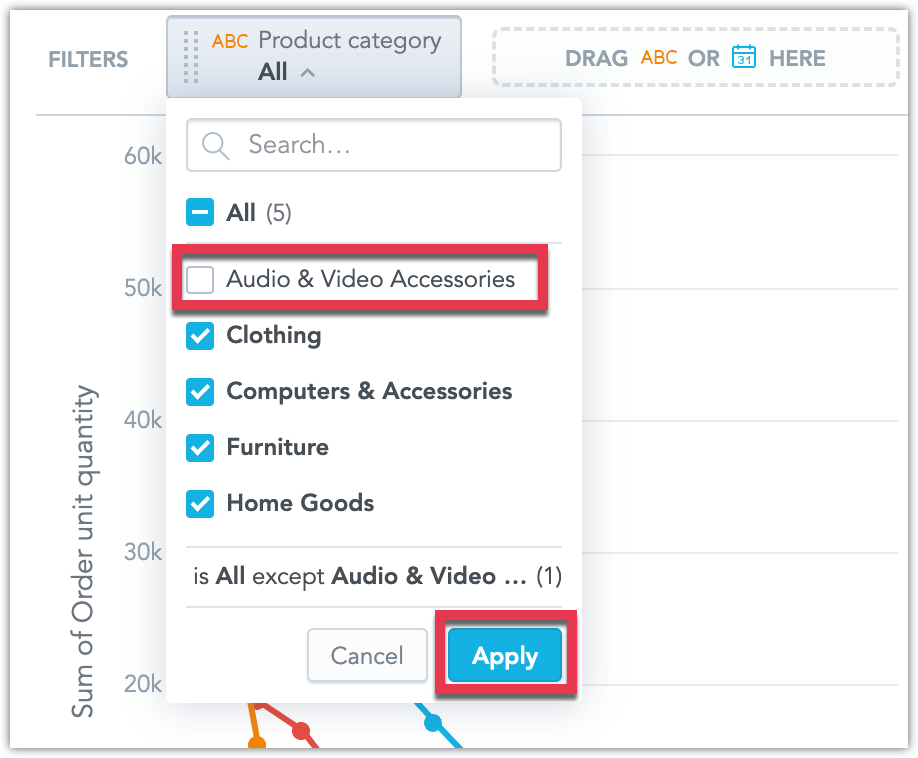
Data with Audio & Video Accessories product category is now filtered out:
Name your visualization and Save it.
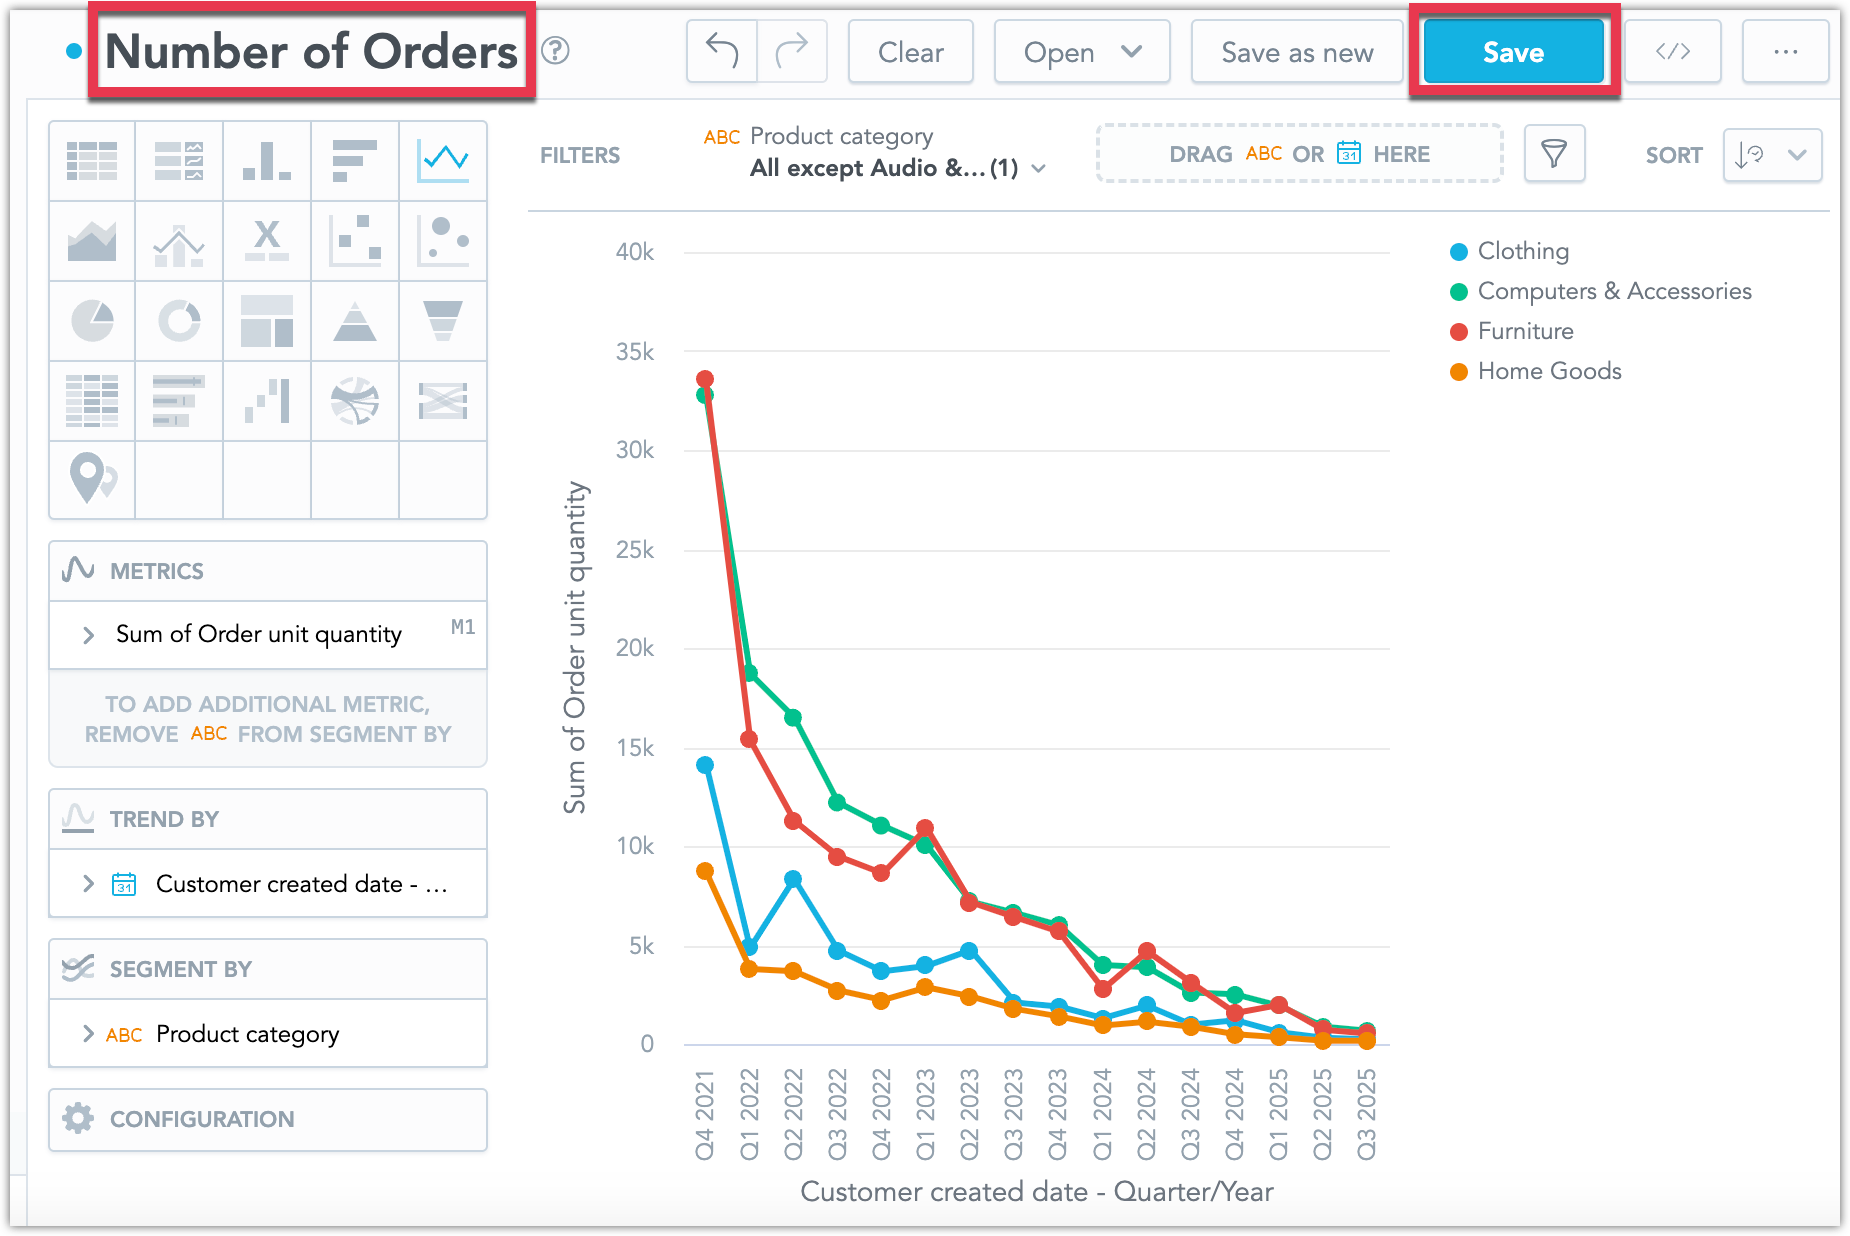
You have created your first visualization!
Of course there are many other types of customizations you can make to your visualization, you can read about them in the Create Visualizations section of the documentation.
To create a visualization, submit a POST request to /api/v1/entities/workspaces/<WORKSPACE_ID>/visualizationObjects:
curl $HOST_URL/api/v1/entities/workspaces/<WORKSPACE_ID>/visualizationObjects \
  -H "Content-Type: application/vnd.gooddata.api+json" \
  -H "Accept: application/vnd.gooddata.api+json" \
  -H "Authorization: Bearer <API_TOKEN>" \
  -X POST \
  -d '{
  "data": {
    "id": "myObjectId123",
    "type": "visualizationObject",
    "attributes": {
      "title": "Number of Orders API",
      "description": "",
      "content": {
        "buckets": [
          {
            "items": [
              {
                "measure": {
                  "localIdentifier": "a62c290c70424904b385b5dd5b0b5bcc",
                  "definition": {
                    "measureDefinition": {
                      "item": {
                        "identifier": {
                          "id": "order_unit_quantity",
                          "type": "fact"
                        }
                      },
                      "aggregation": "sum",
                      "filters": []
                    }
                  },
                  "title": "Sum of Order unit quantity",
                  "format": "#,##0.00"
                }
              }
            ],
            "localIdentifier": "measures"
          },
          {
            "items": [
              {
                "attribute": {
                  "localIdentifier": "a64f156989ee4eeab59370db228121be",
                  "displayForm": {
                    "identifier": {
                      "id": "customer_created_date.quarter",
                      "type": "label"
                    }
                  }
                }
              }
            ],
            "localIdentifier": "trend"
          },
          {
            "items": [
              {
                "attribute": {
                  "localIdentifier": "59bc5473489e47f4b61da45cb27f0293",
                  "displayForm": {
                    "identifier": {
                      "id": "product_category",
                      "type": "label"
                    }
                  }
                }
              }
            ],
            "localIdentifier": "segment"
          }
        ],
        "filters": [
          {
            "negativeAttributeFilter": {
              "localIdentifier": "1acfac45fb7f4bab9bb0a6b77e0f1dc3",
              "displayForm": {
                "identifier": {
                  "id": "product_category",
                  "type": "label"
                }
              },
              "notIn": {
                "values": [
                  "Audio & Video Accessories"
                ]
              }
            }
          }
        ],
        "sorts": [],
        "properties": {},
        "visualizationUrl": "local:line",
        "version": "2"
      }
    }
  }
}' | jq .