6. Create Dashboard
A dashboard helps you summarize information on various aspects of your data. You can add visualizations to your dashboard and then embed it into any application if you want to present it to stakeholders.
Steps:
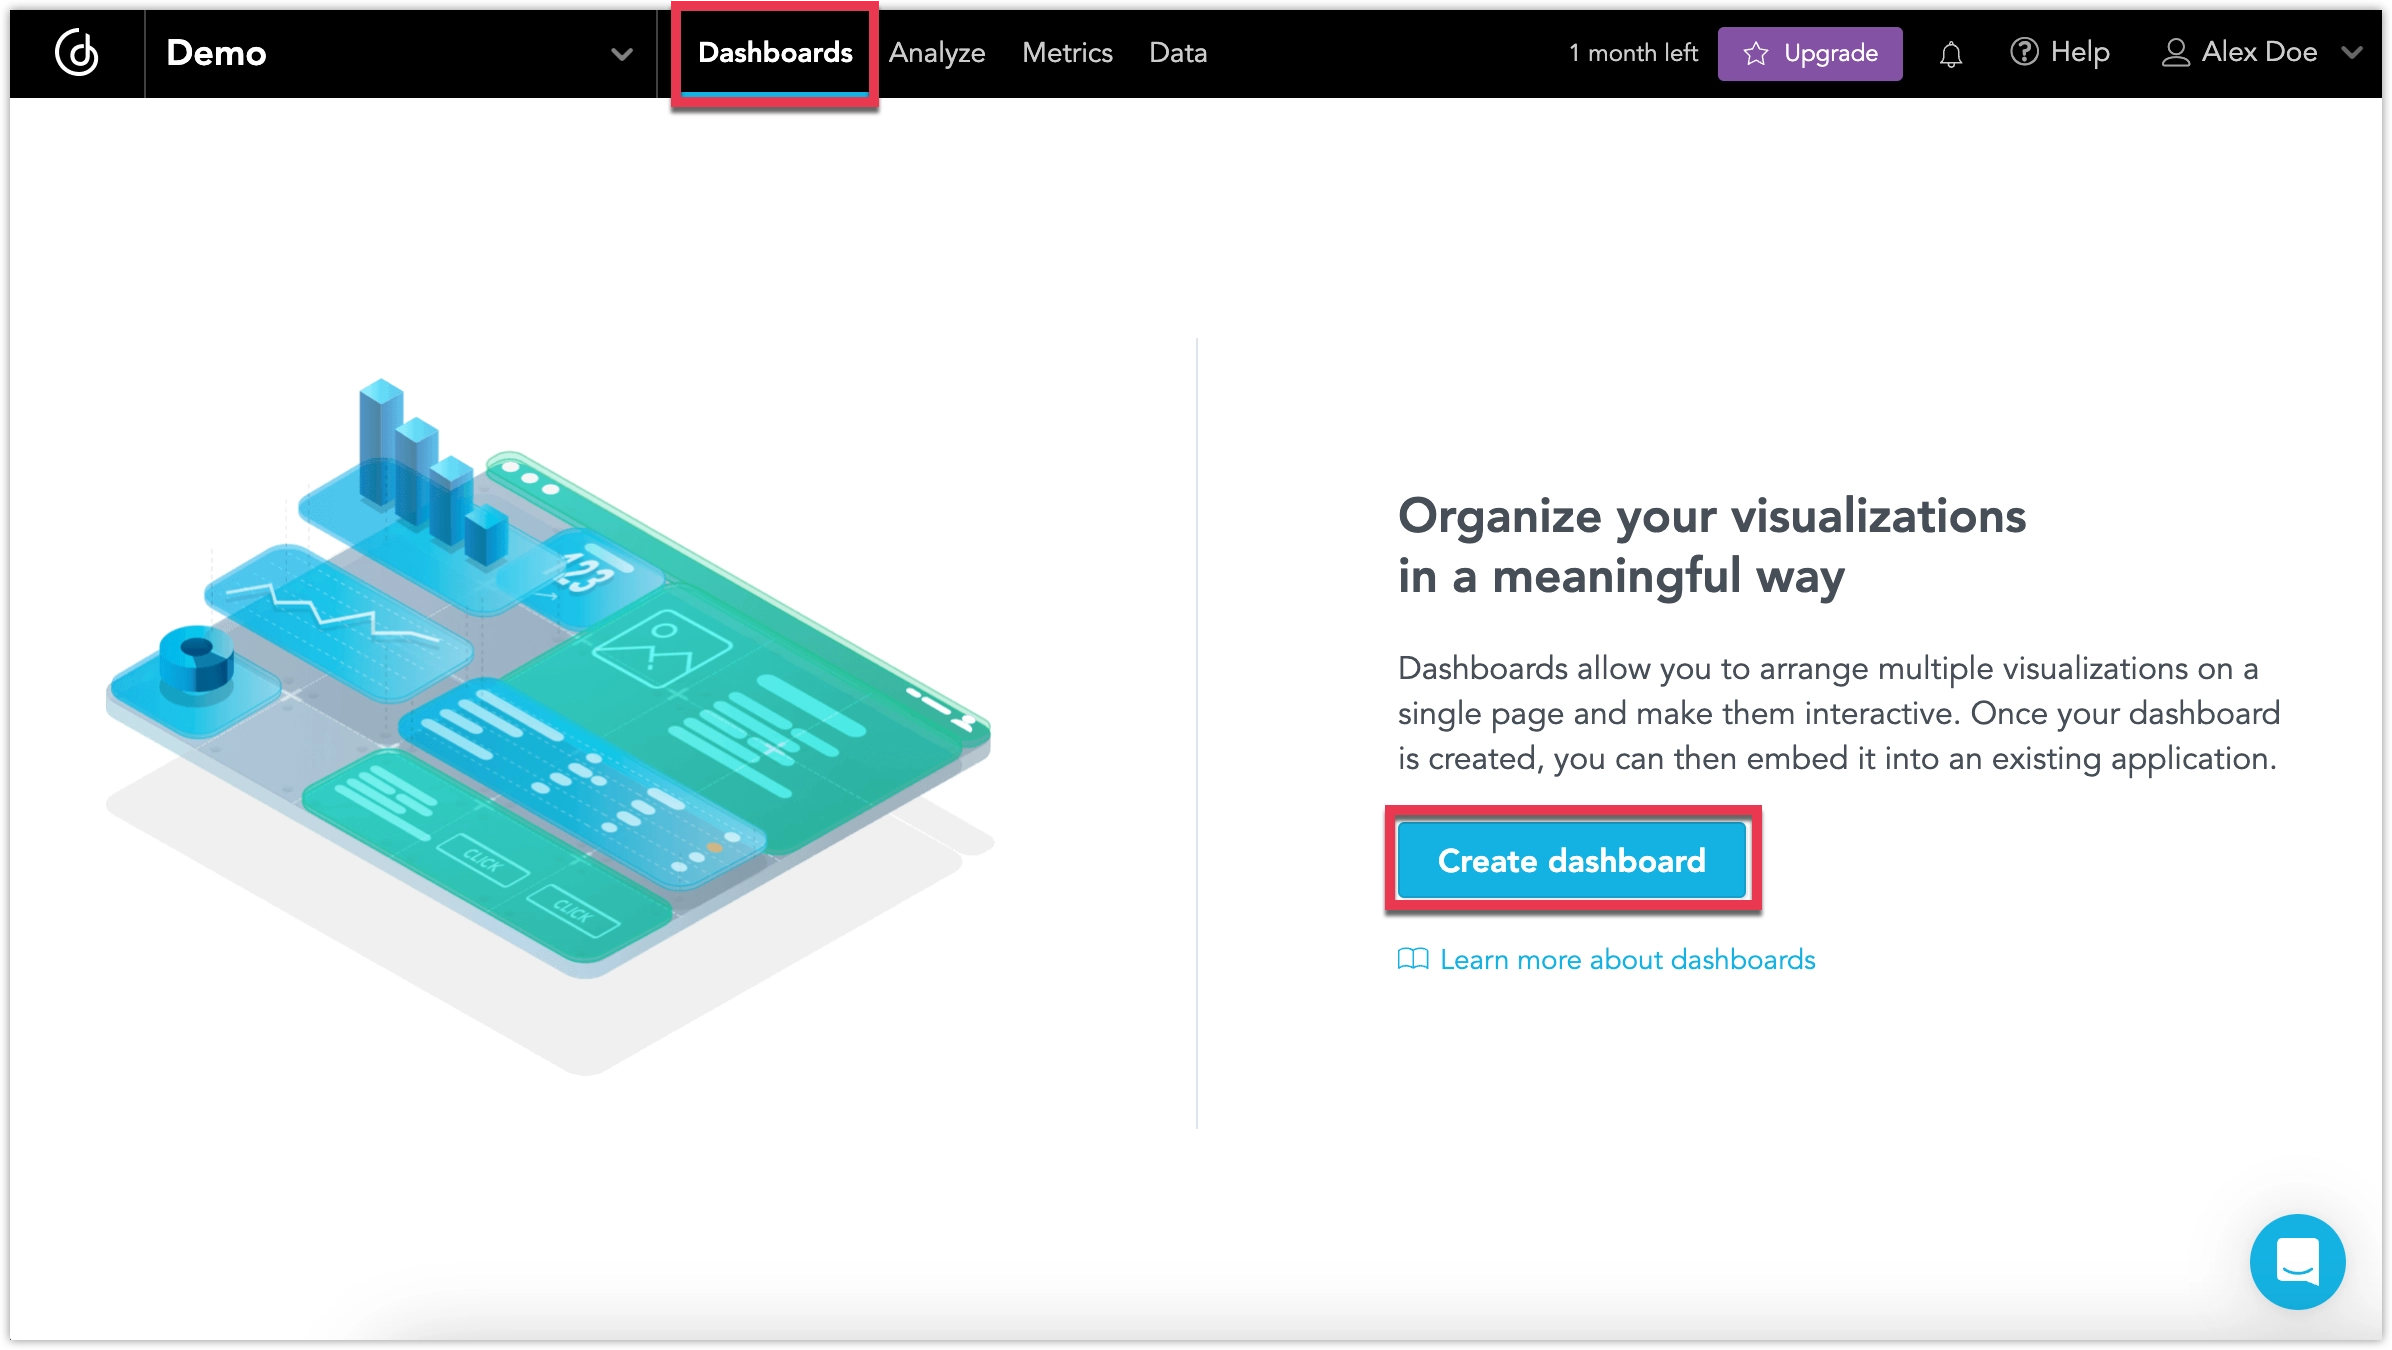
In your workspace, switch to the Dashboards tab and select Create dashboard.
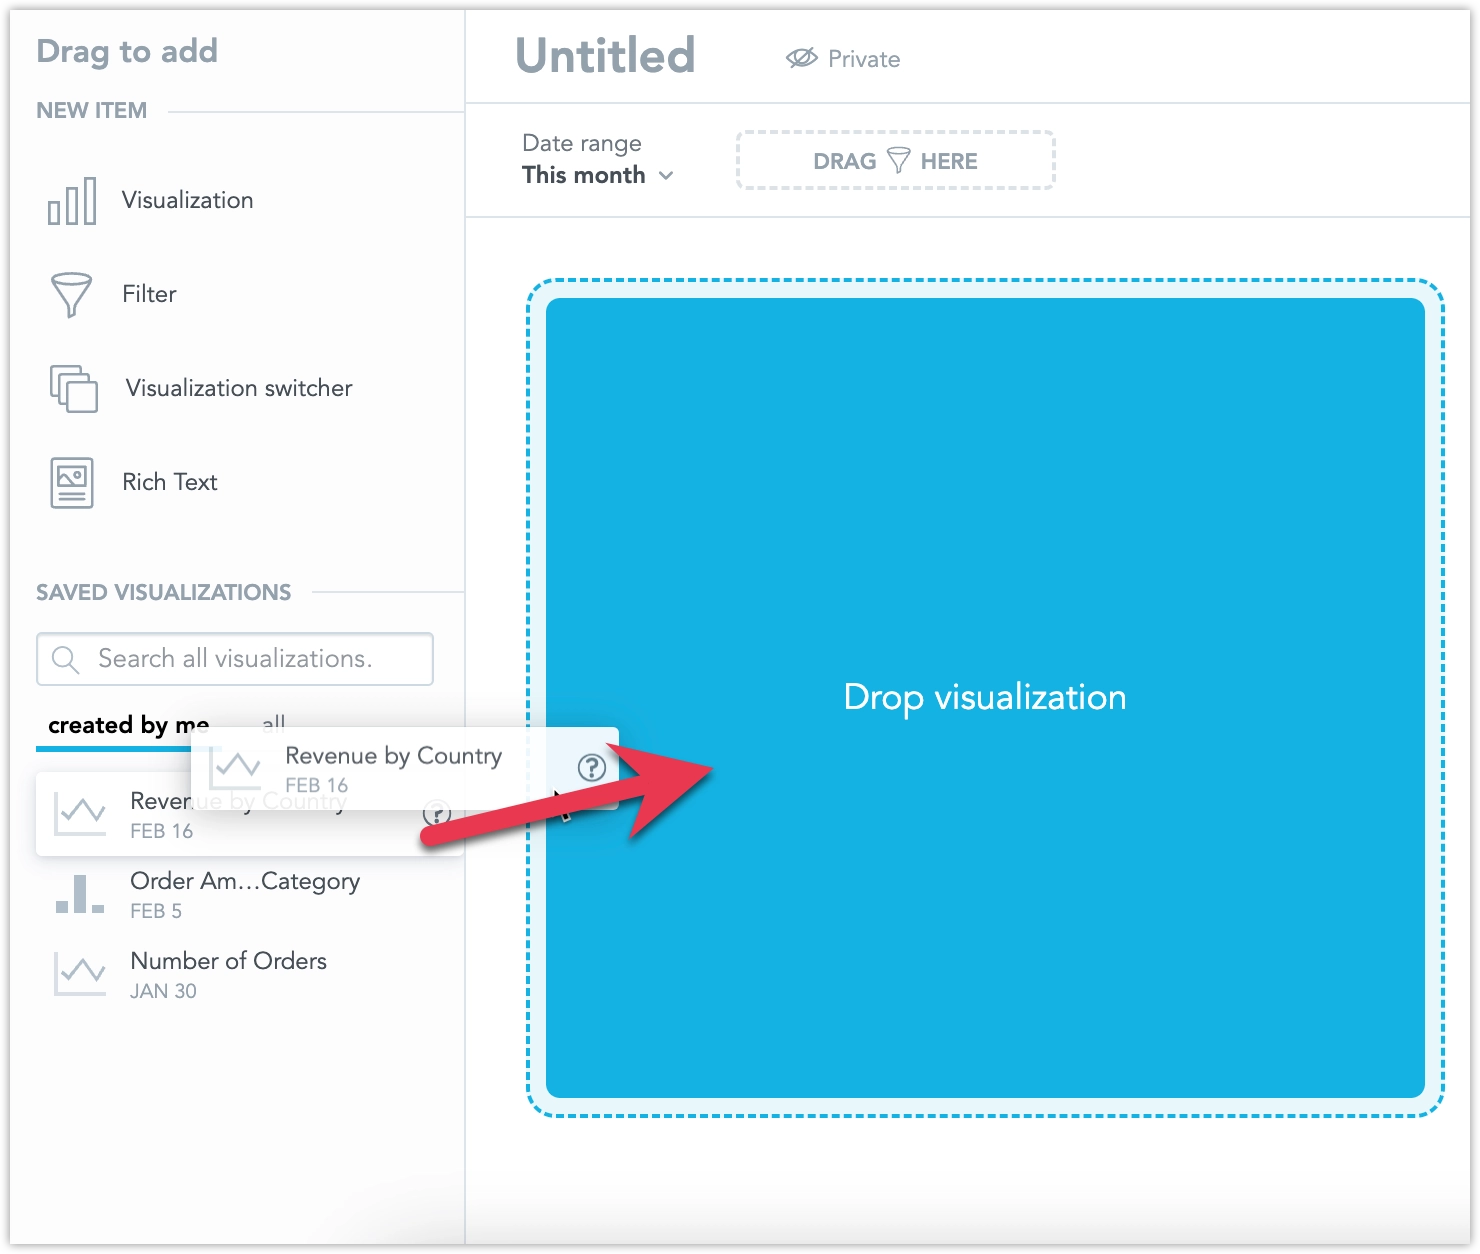
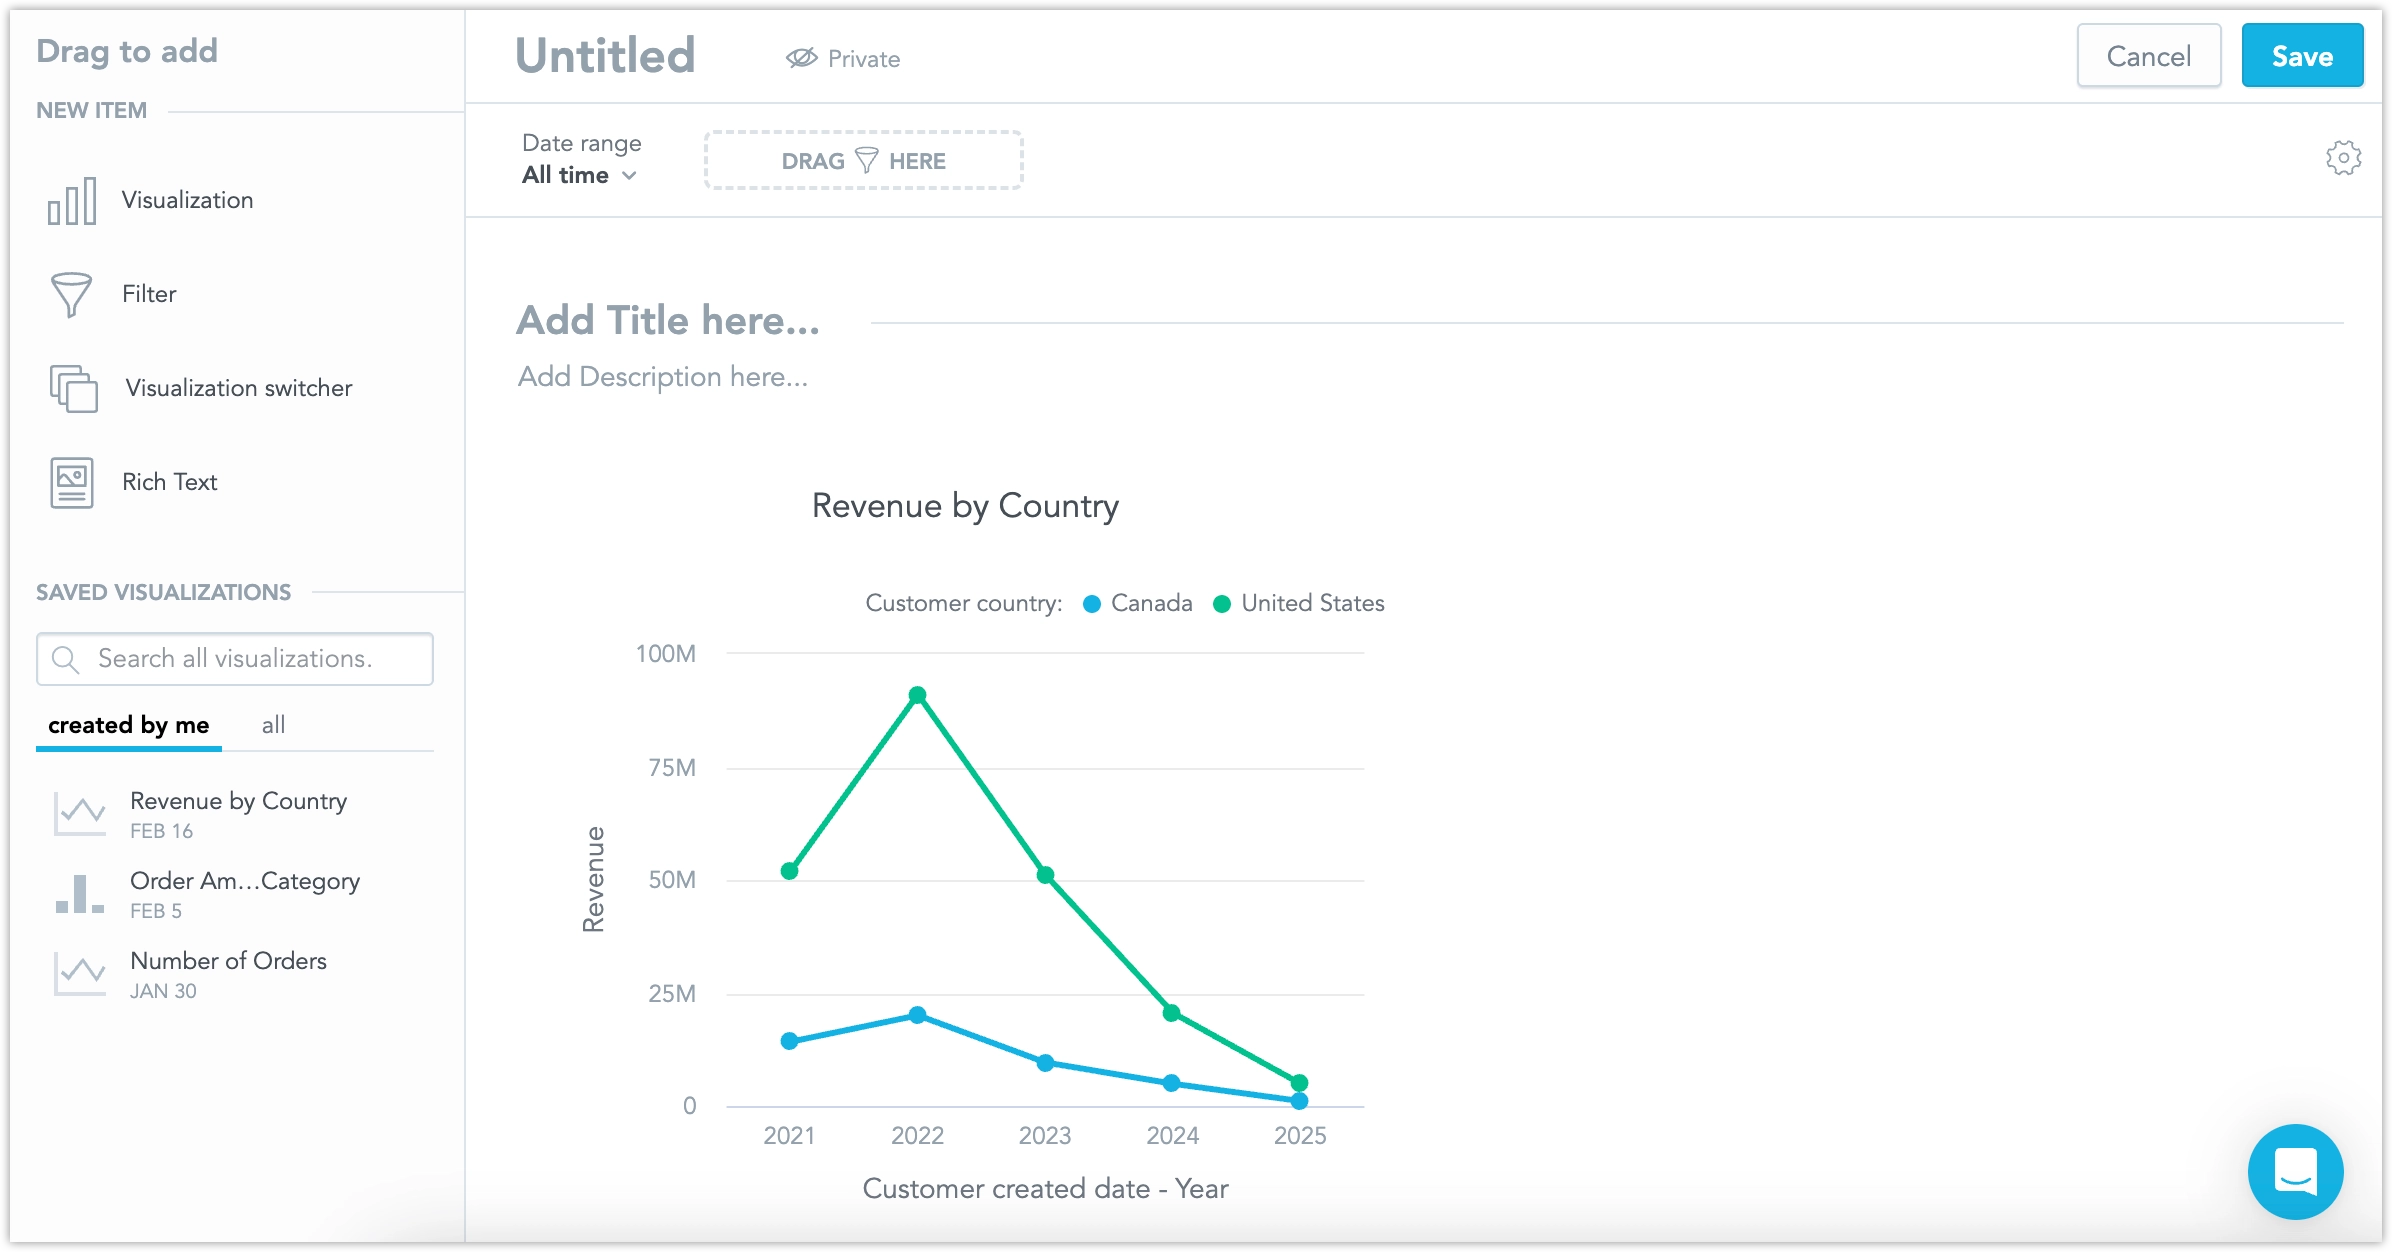
Drag and drop the Revenue by Country visualization from the Saved visualizations catalog into the dashboard:
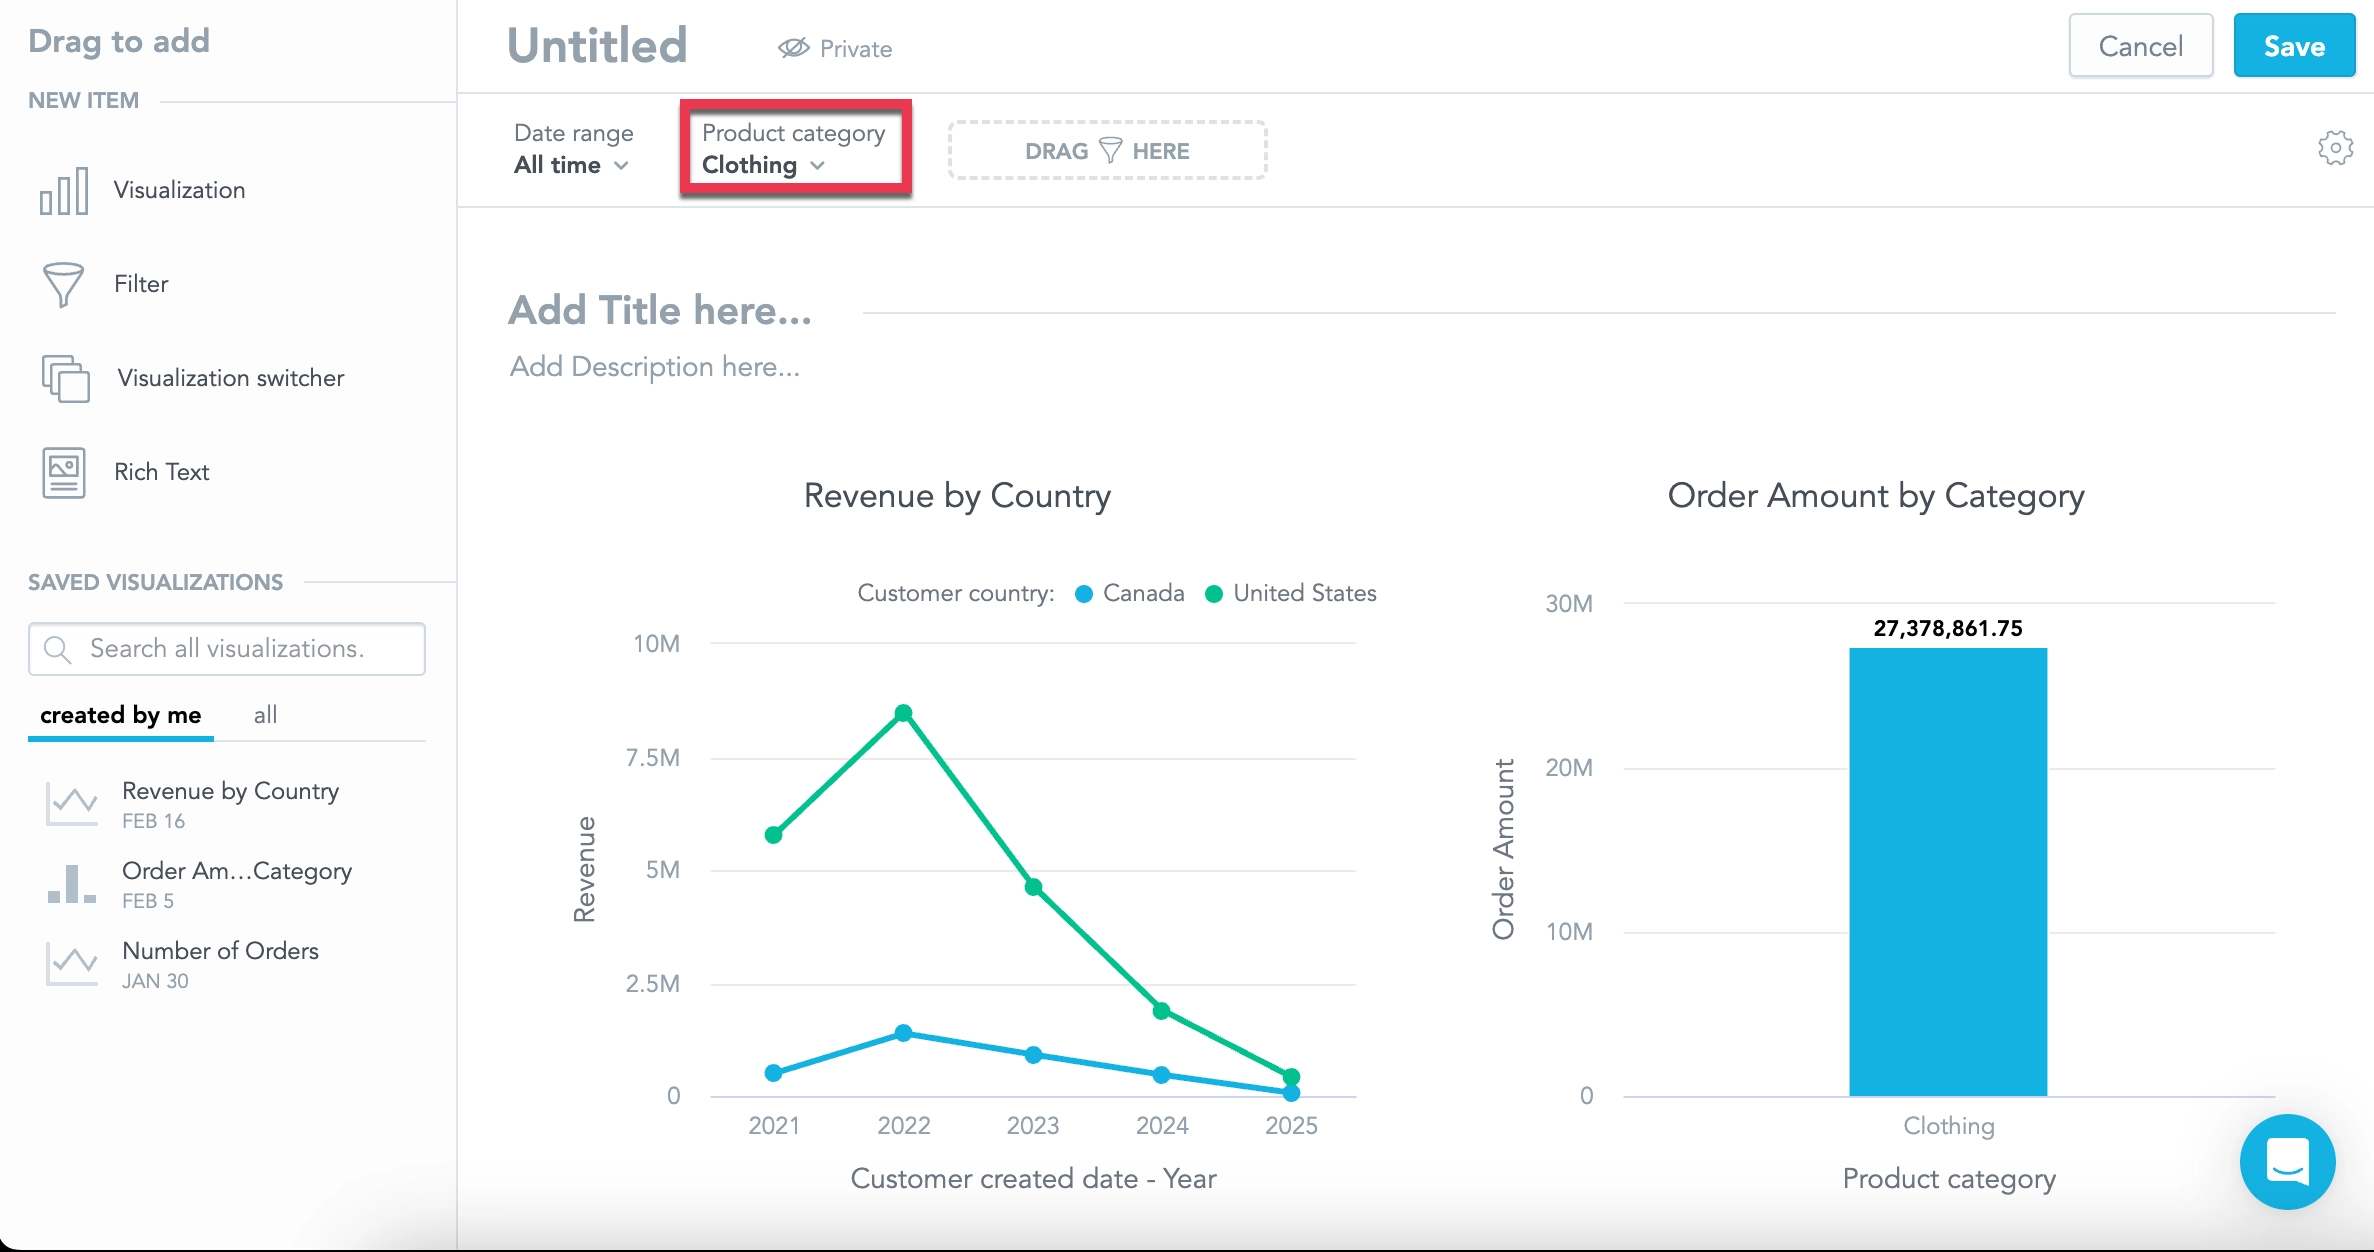
The Revenue by Country visualization is now part of the dashboard. However you might notice it looks different than when you first created it:
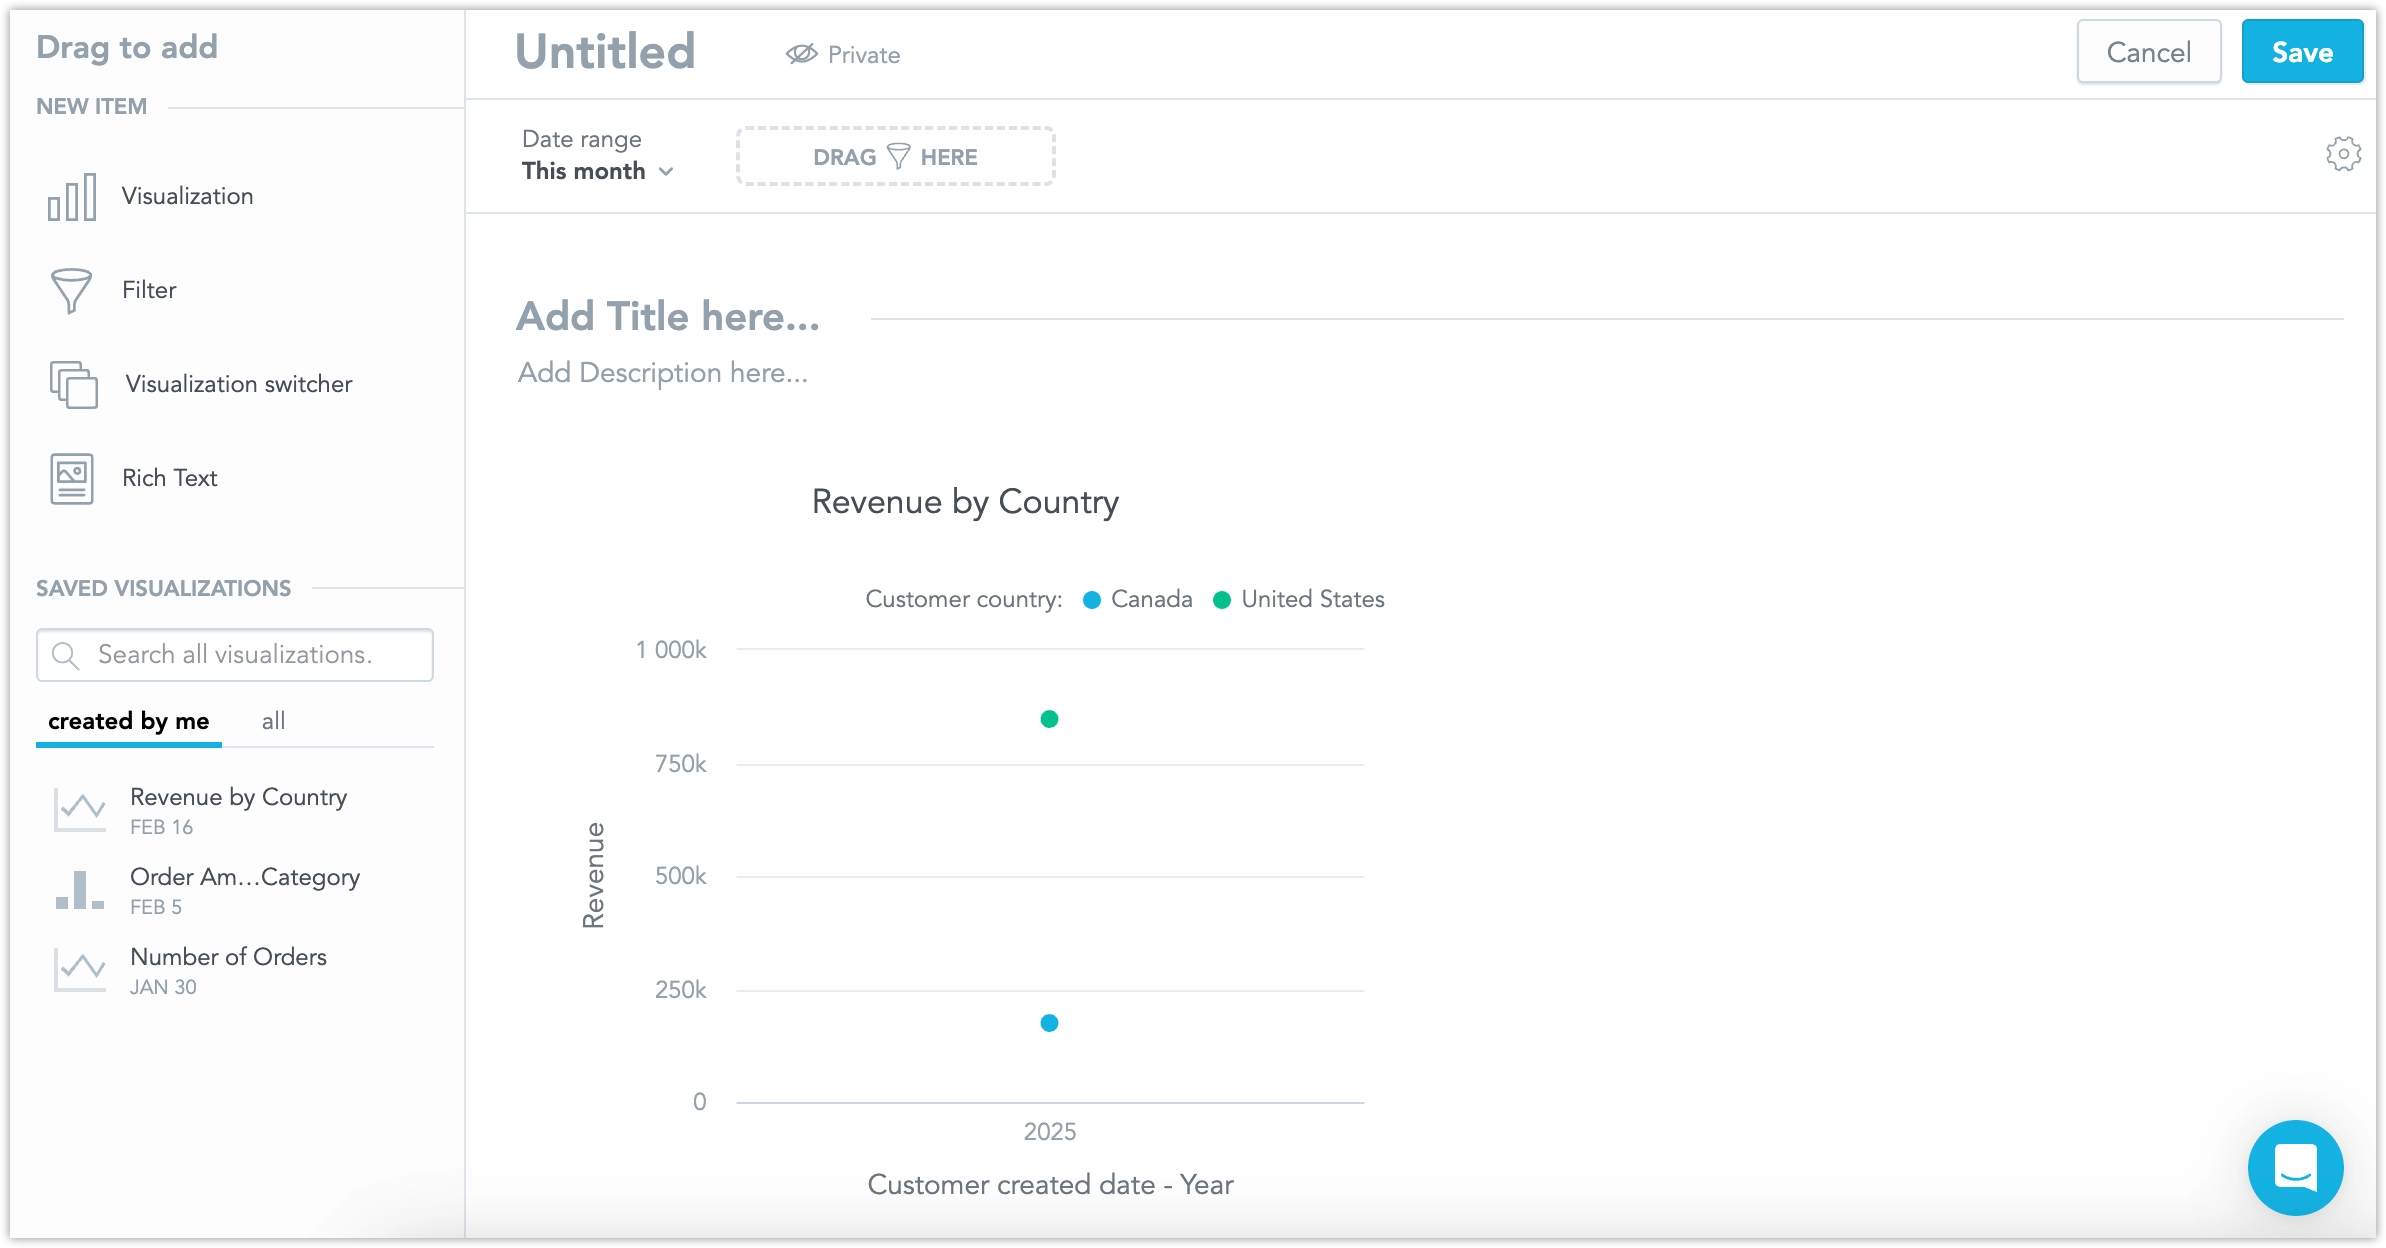
This is because by default new dashboards contain a Date range filter set to just the previous month, next you will need to change this filter.
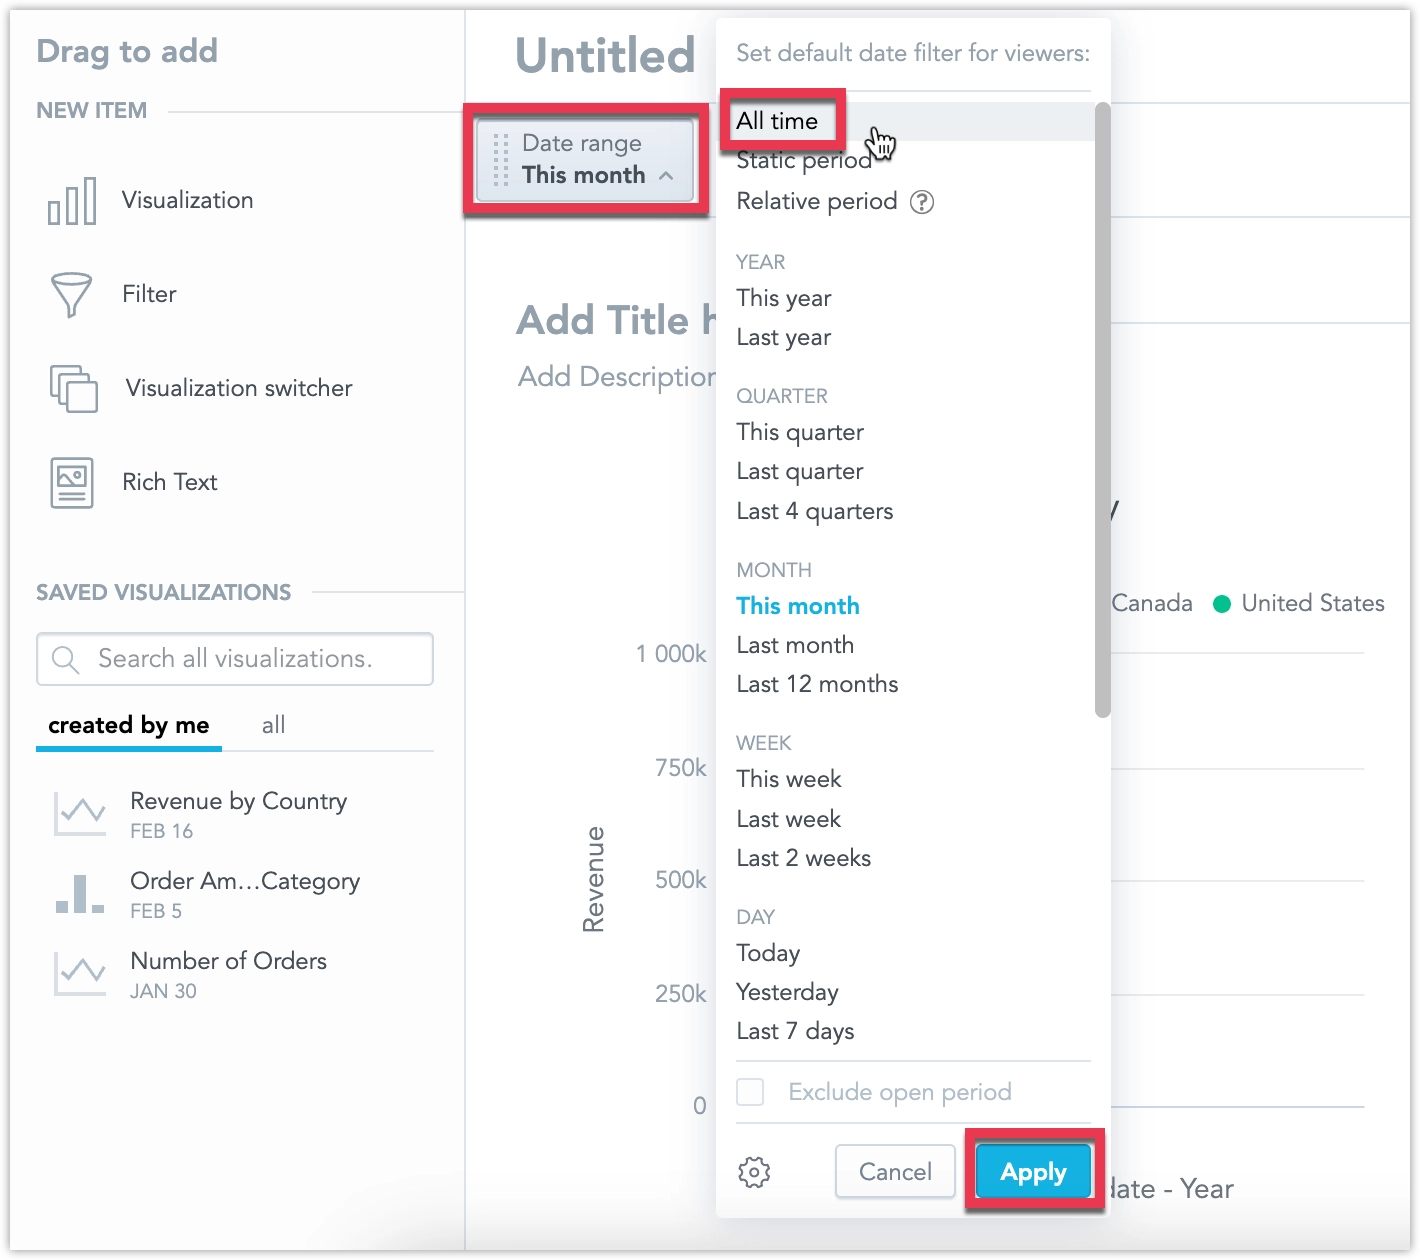
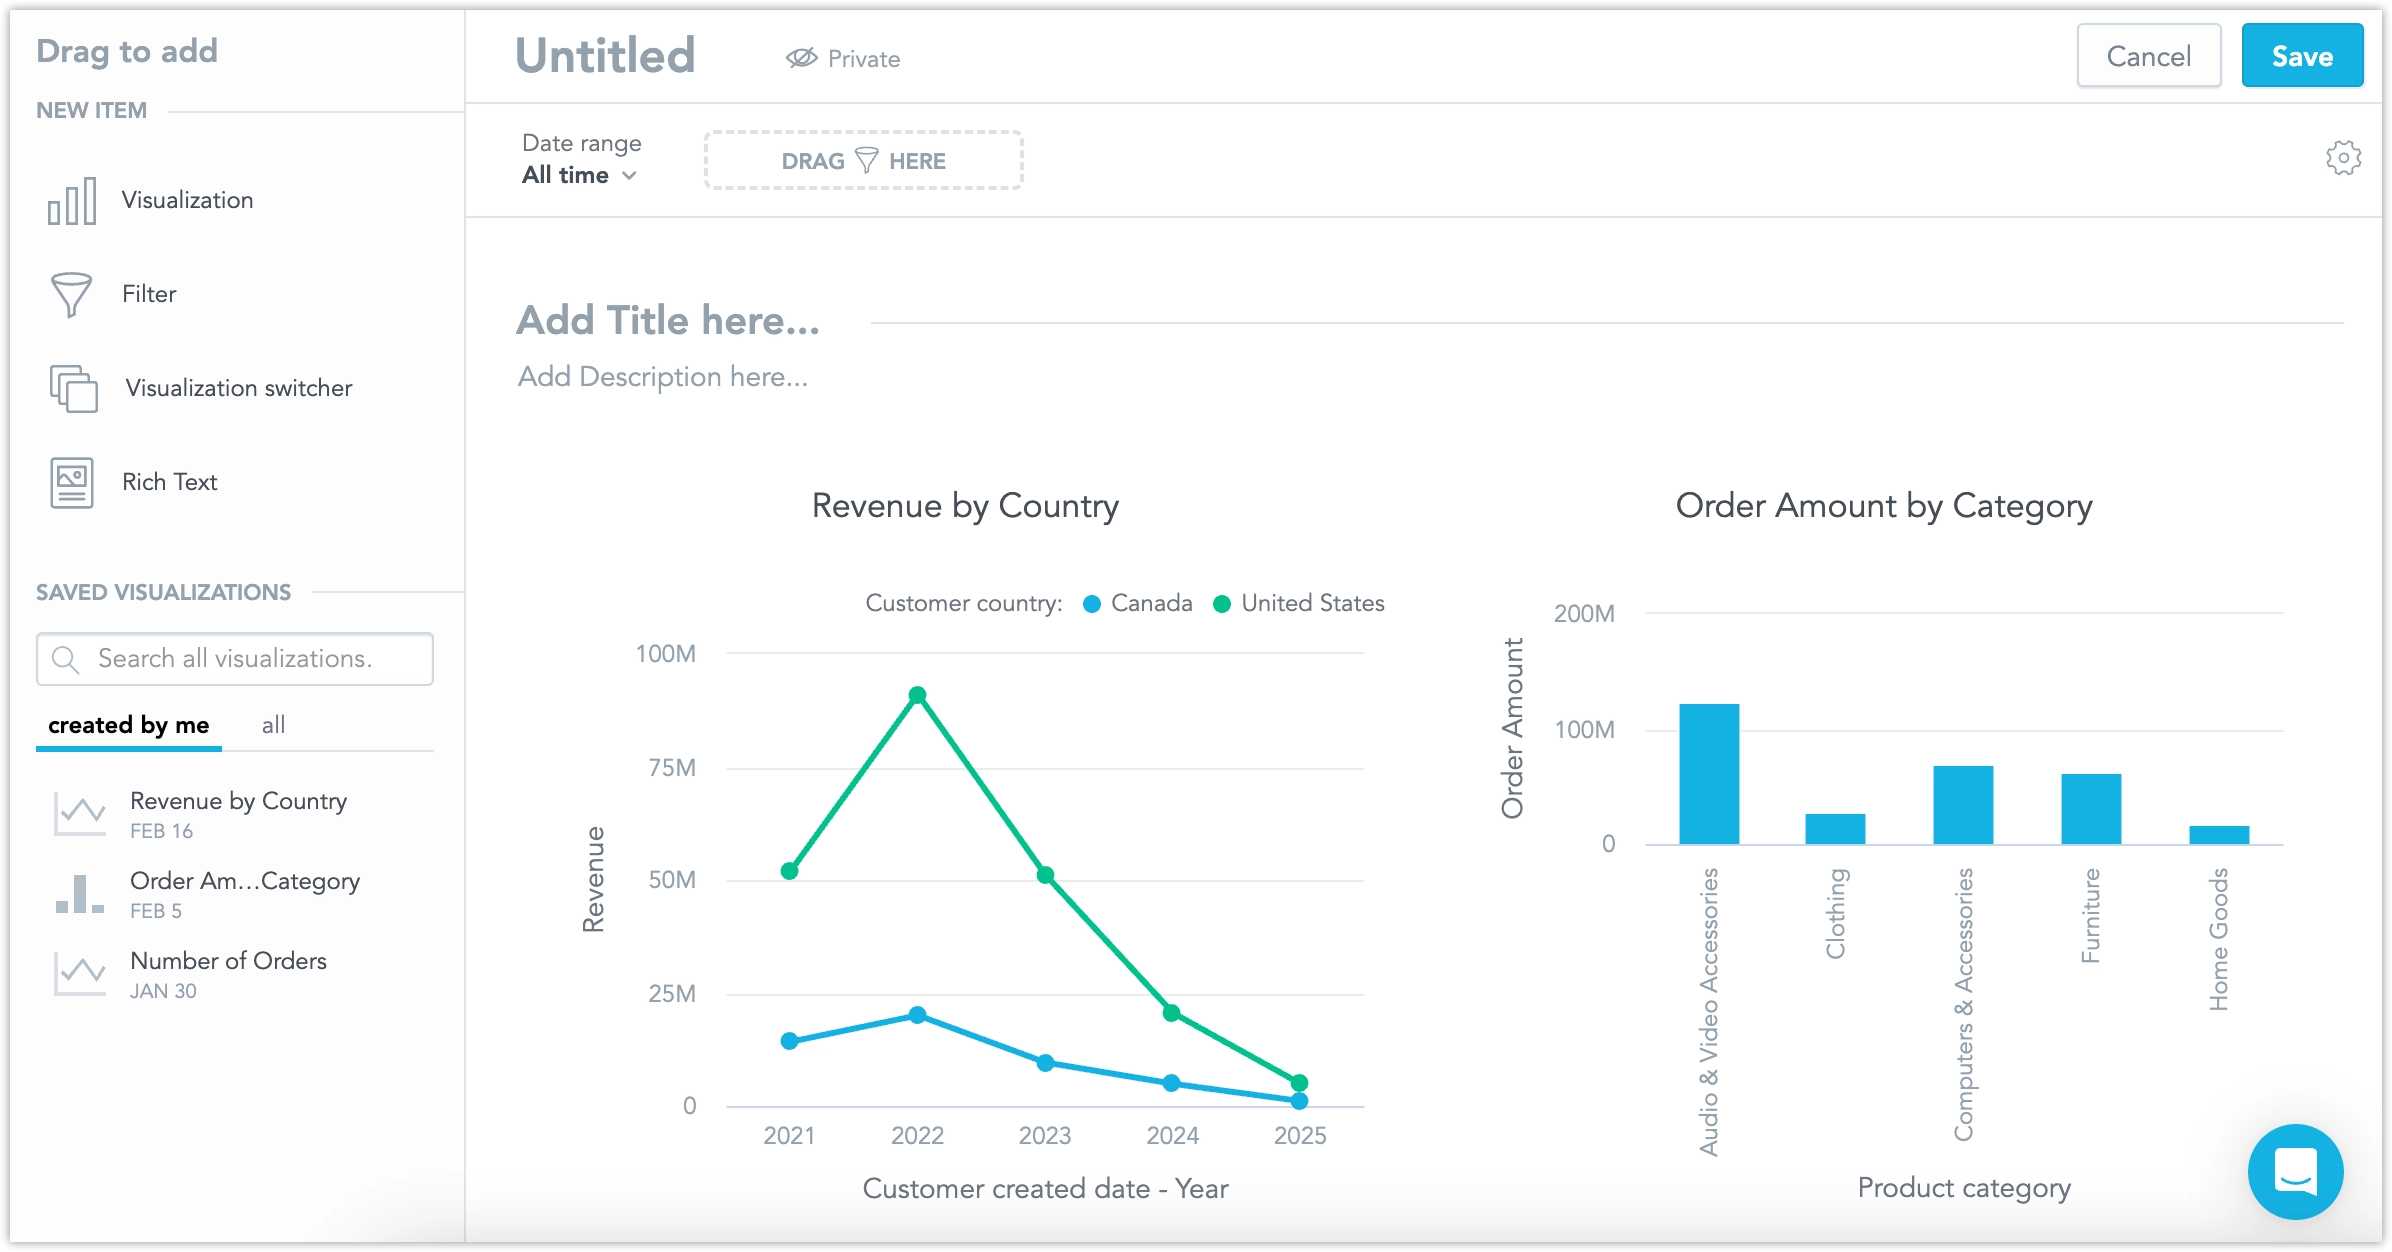
In the Date range filter, select All and click Apply.
Visualizations on this dashboard now display all data as expected:
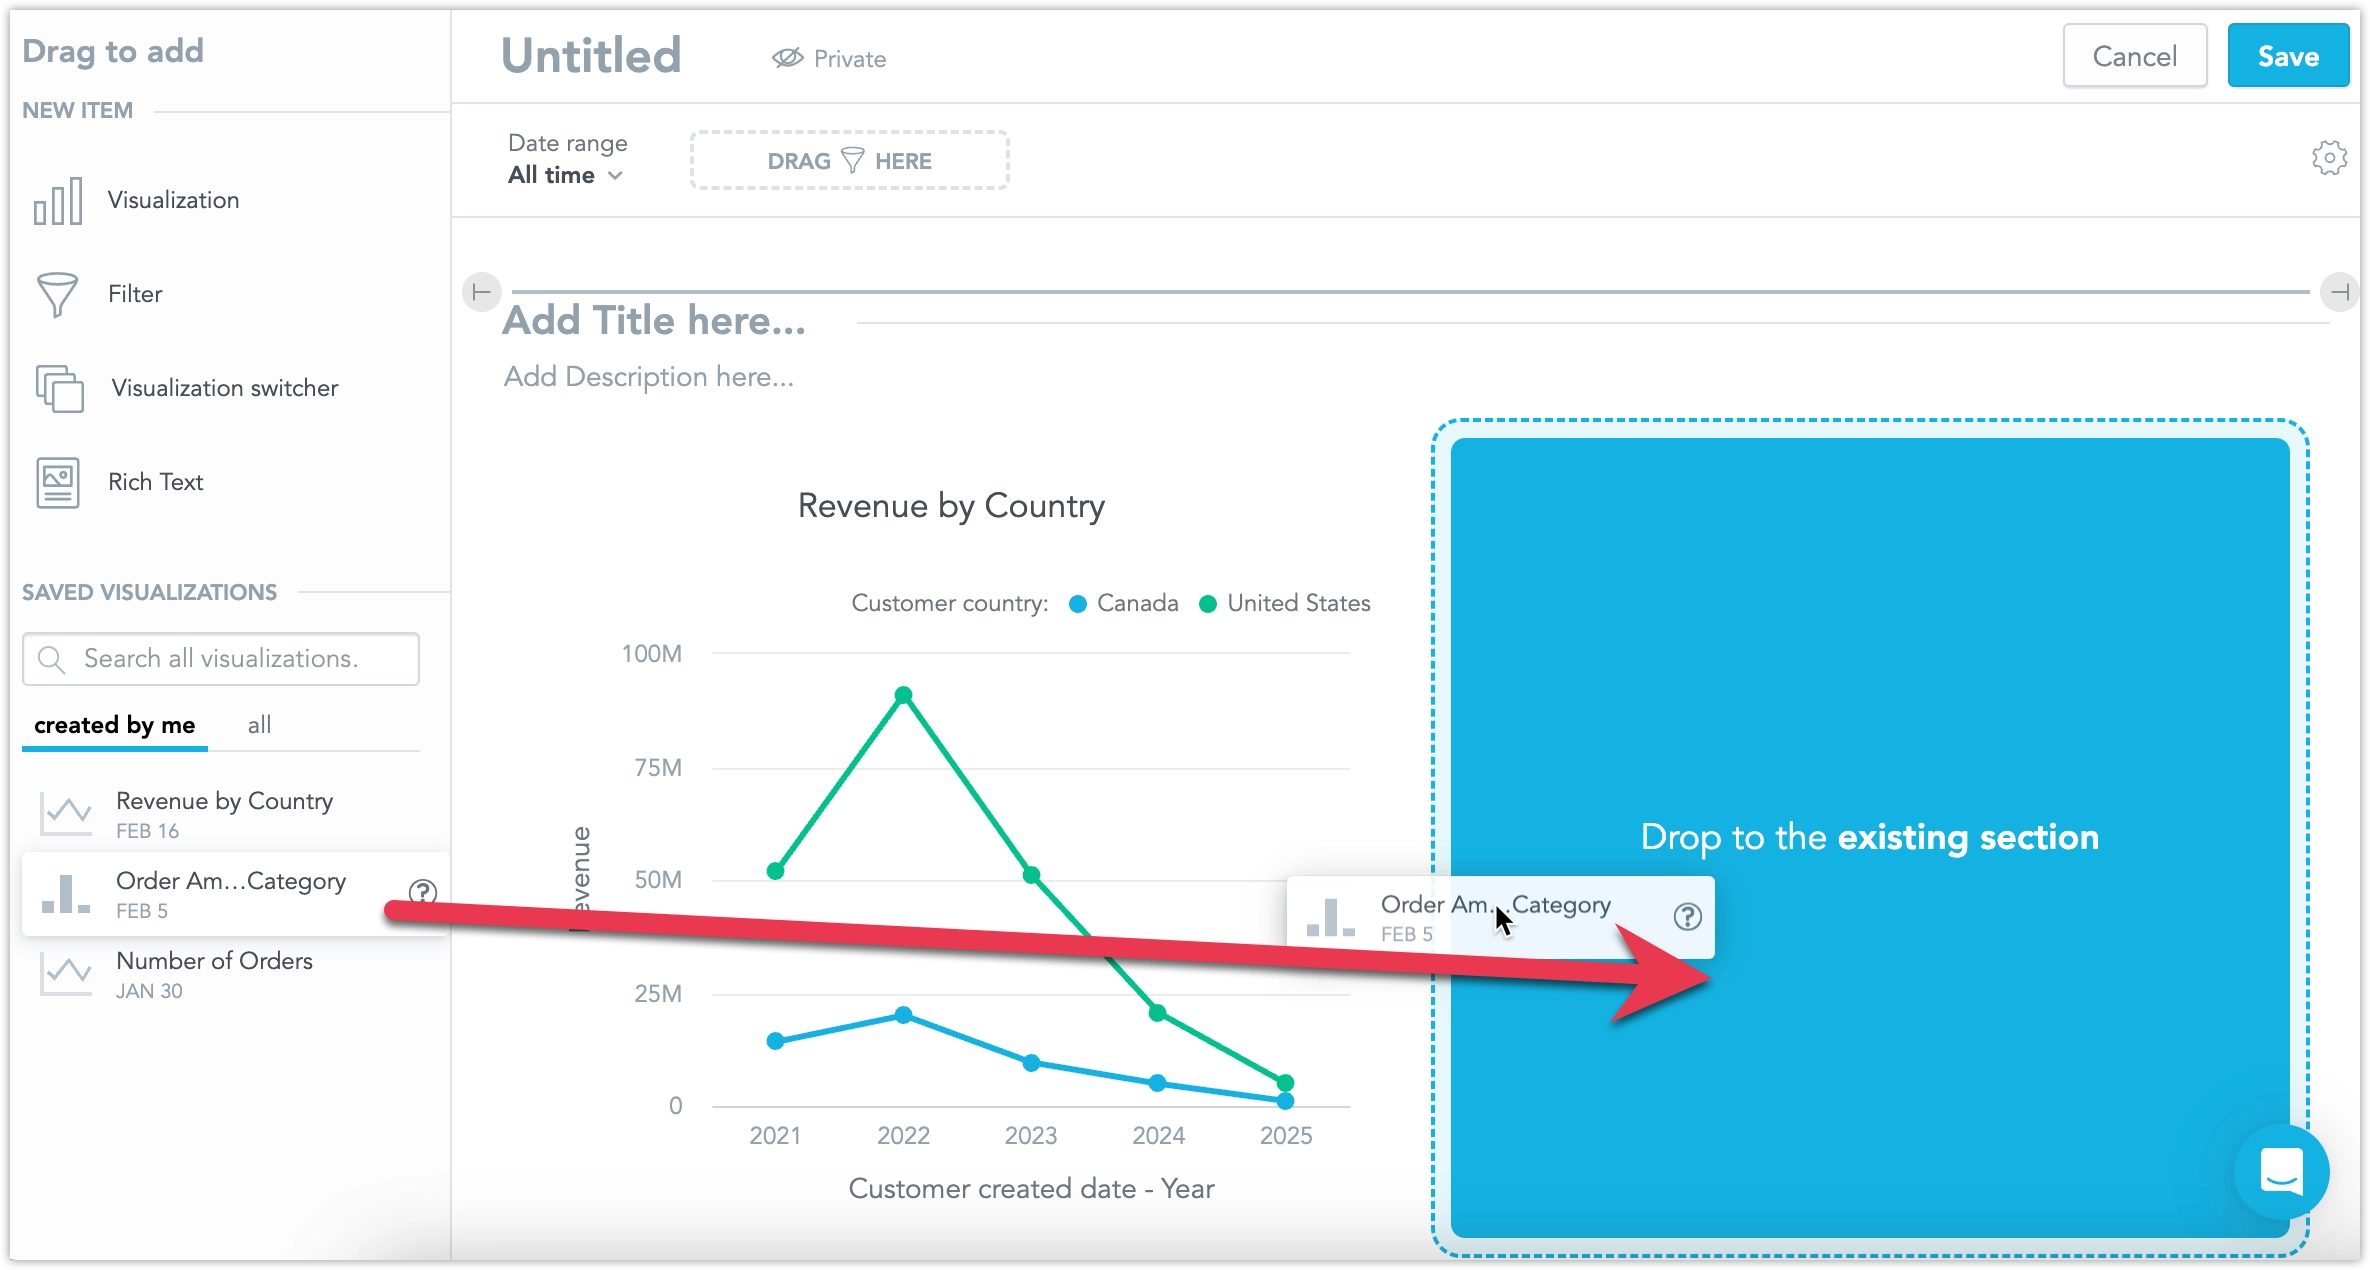
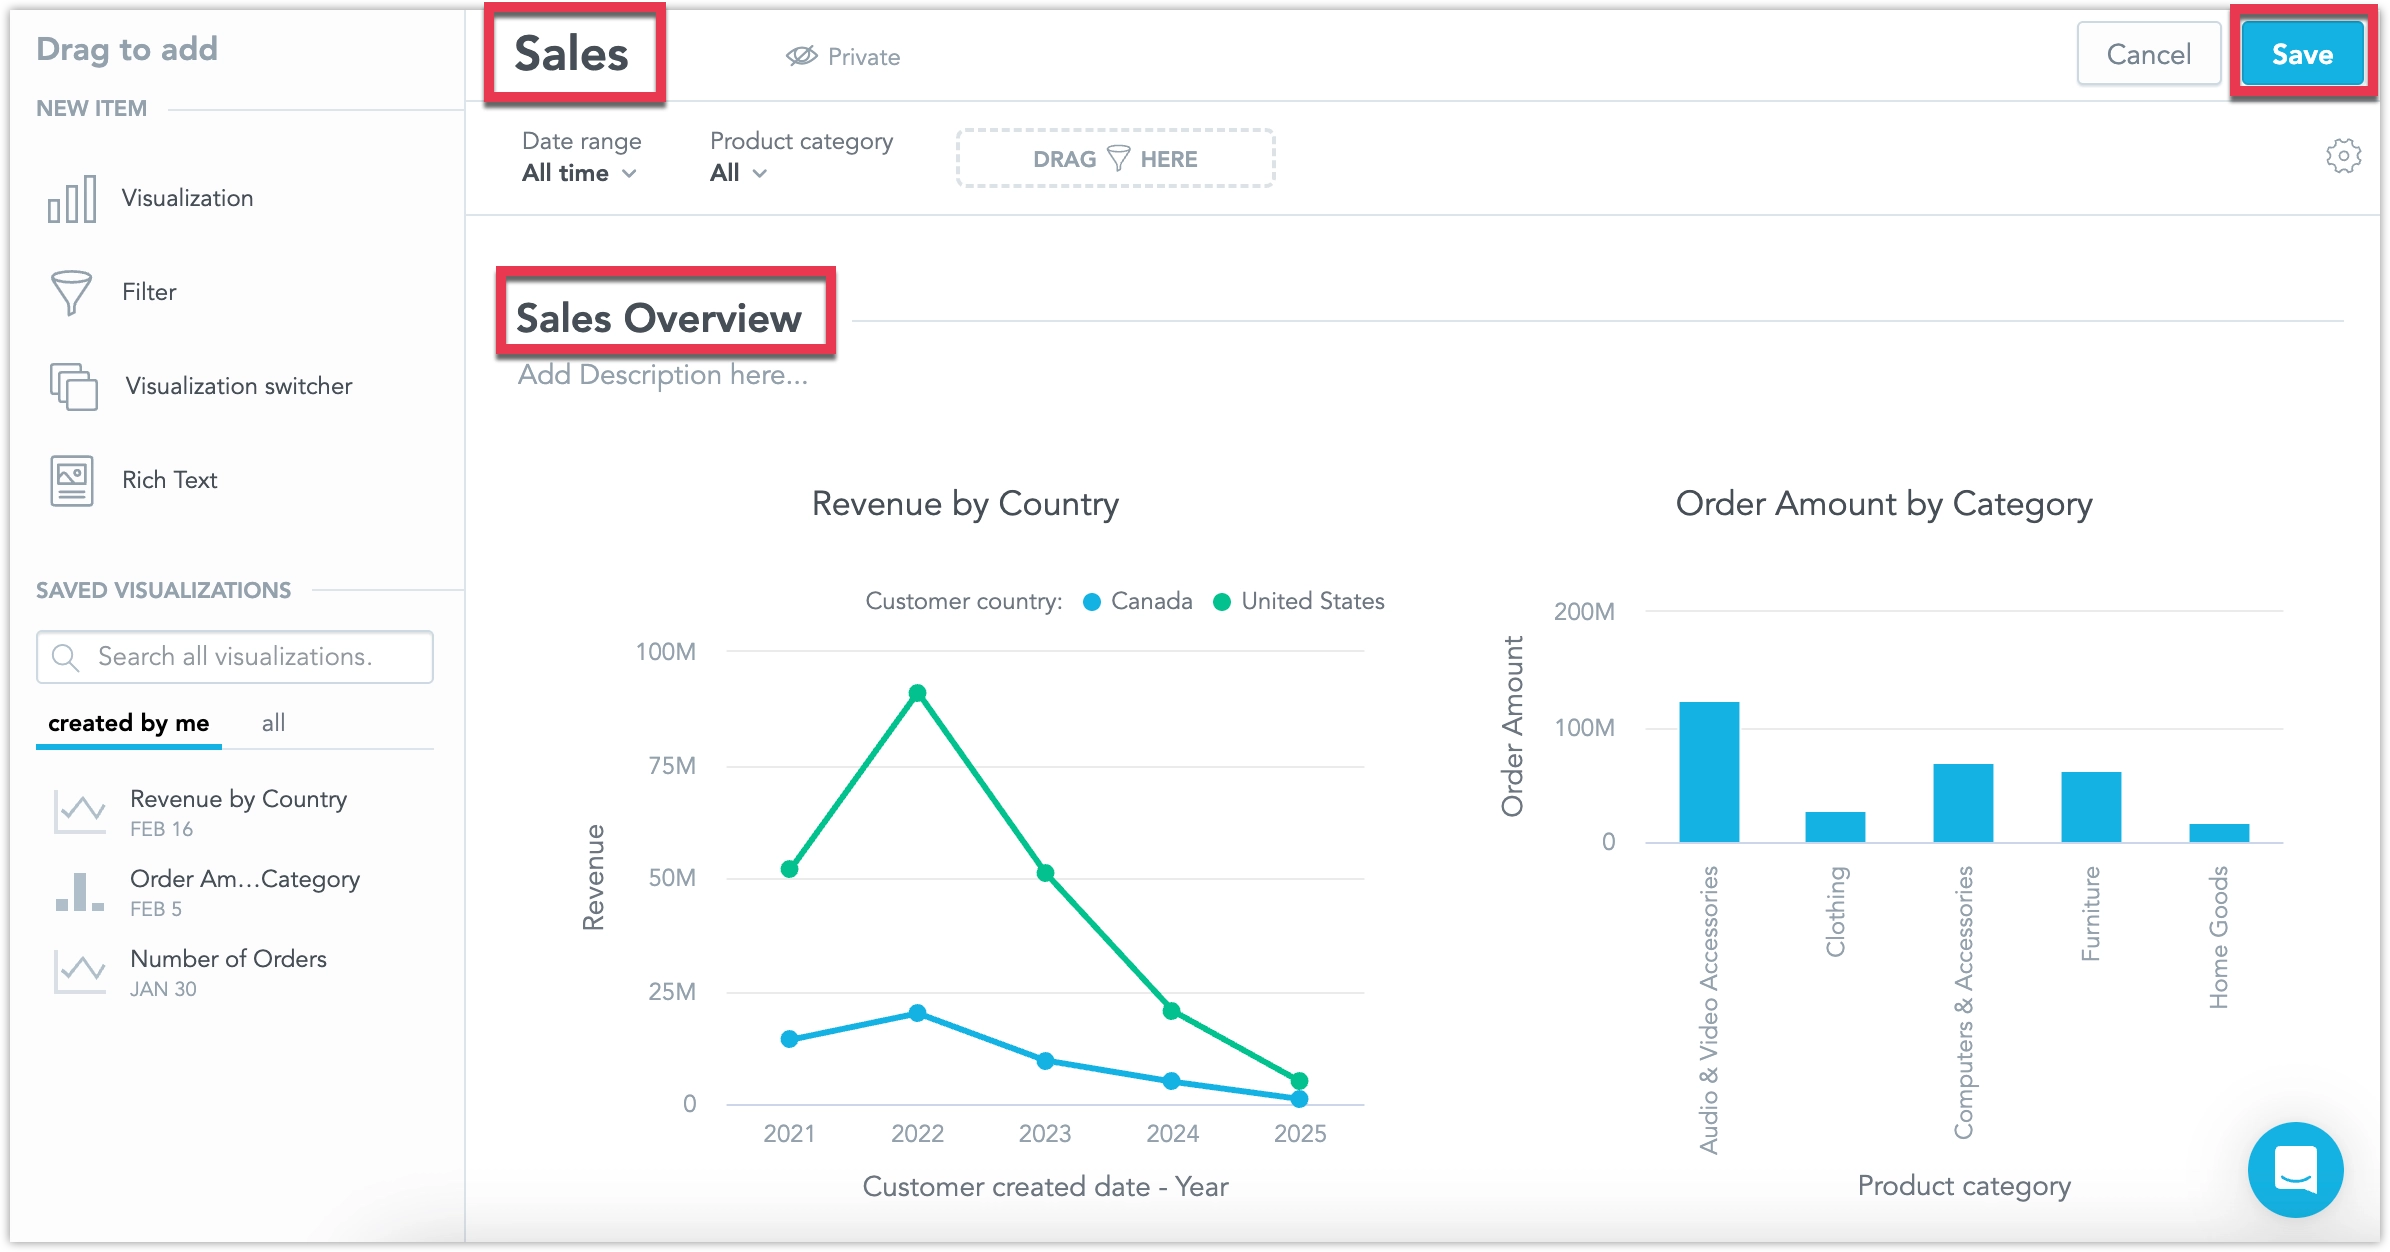
Drag and drop the Order Amount by Category visualization next to the Revenue by Country visualization on the dashboard:
Your dashboard should now look like this:
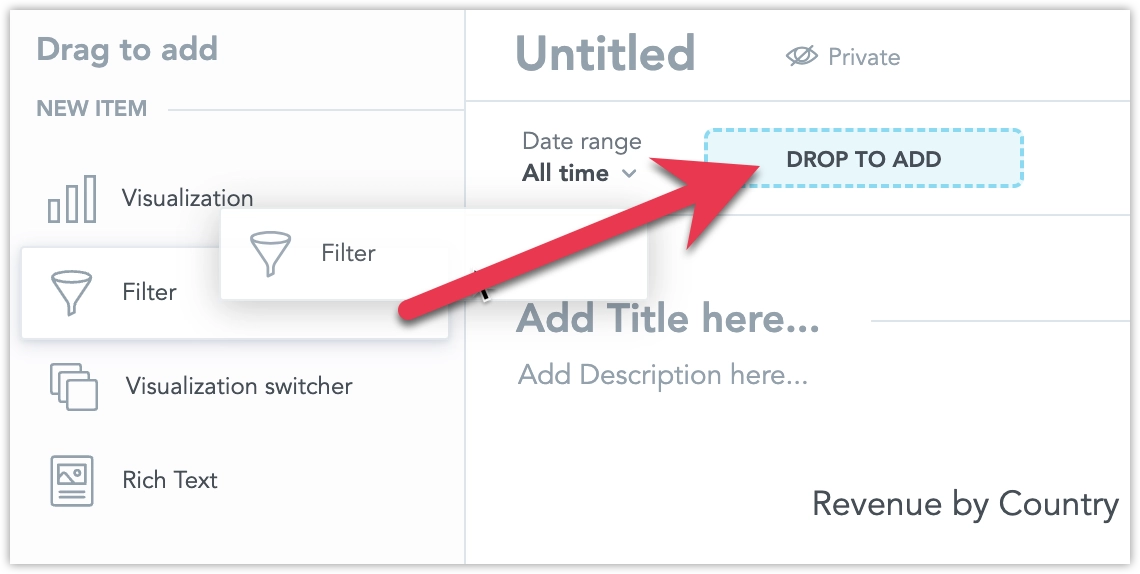
You can add more filters to your dashboard by dragging the Filter widget into the filter bucket at the top of the dashboard:
Select to filter by the Product category attribute.
Note that when you change the value of the filter, all visualizations in the dashboard are filtered by that filter:
For now, you can leave it on All, dashboard users can then change the filter values themselves.
Name the dashboard Sales, name the dashboard section title Sales Overview and Save the dashboard:
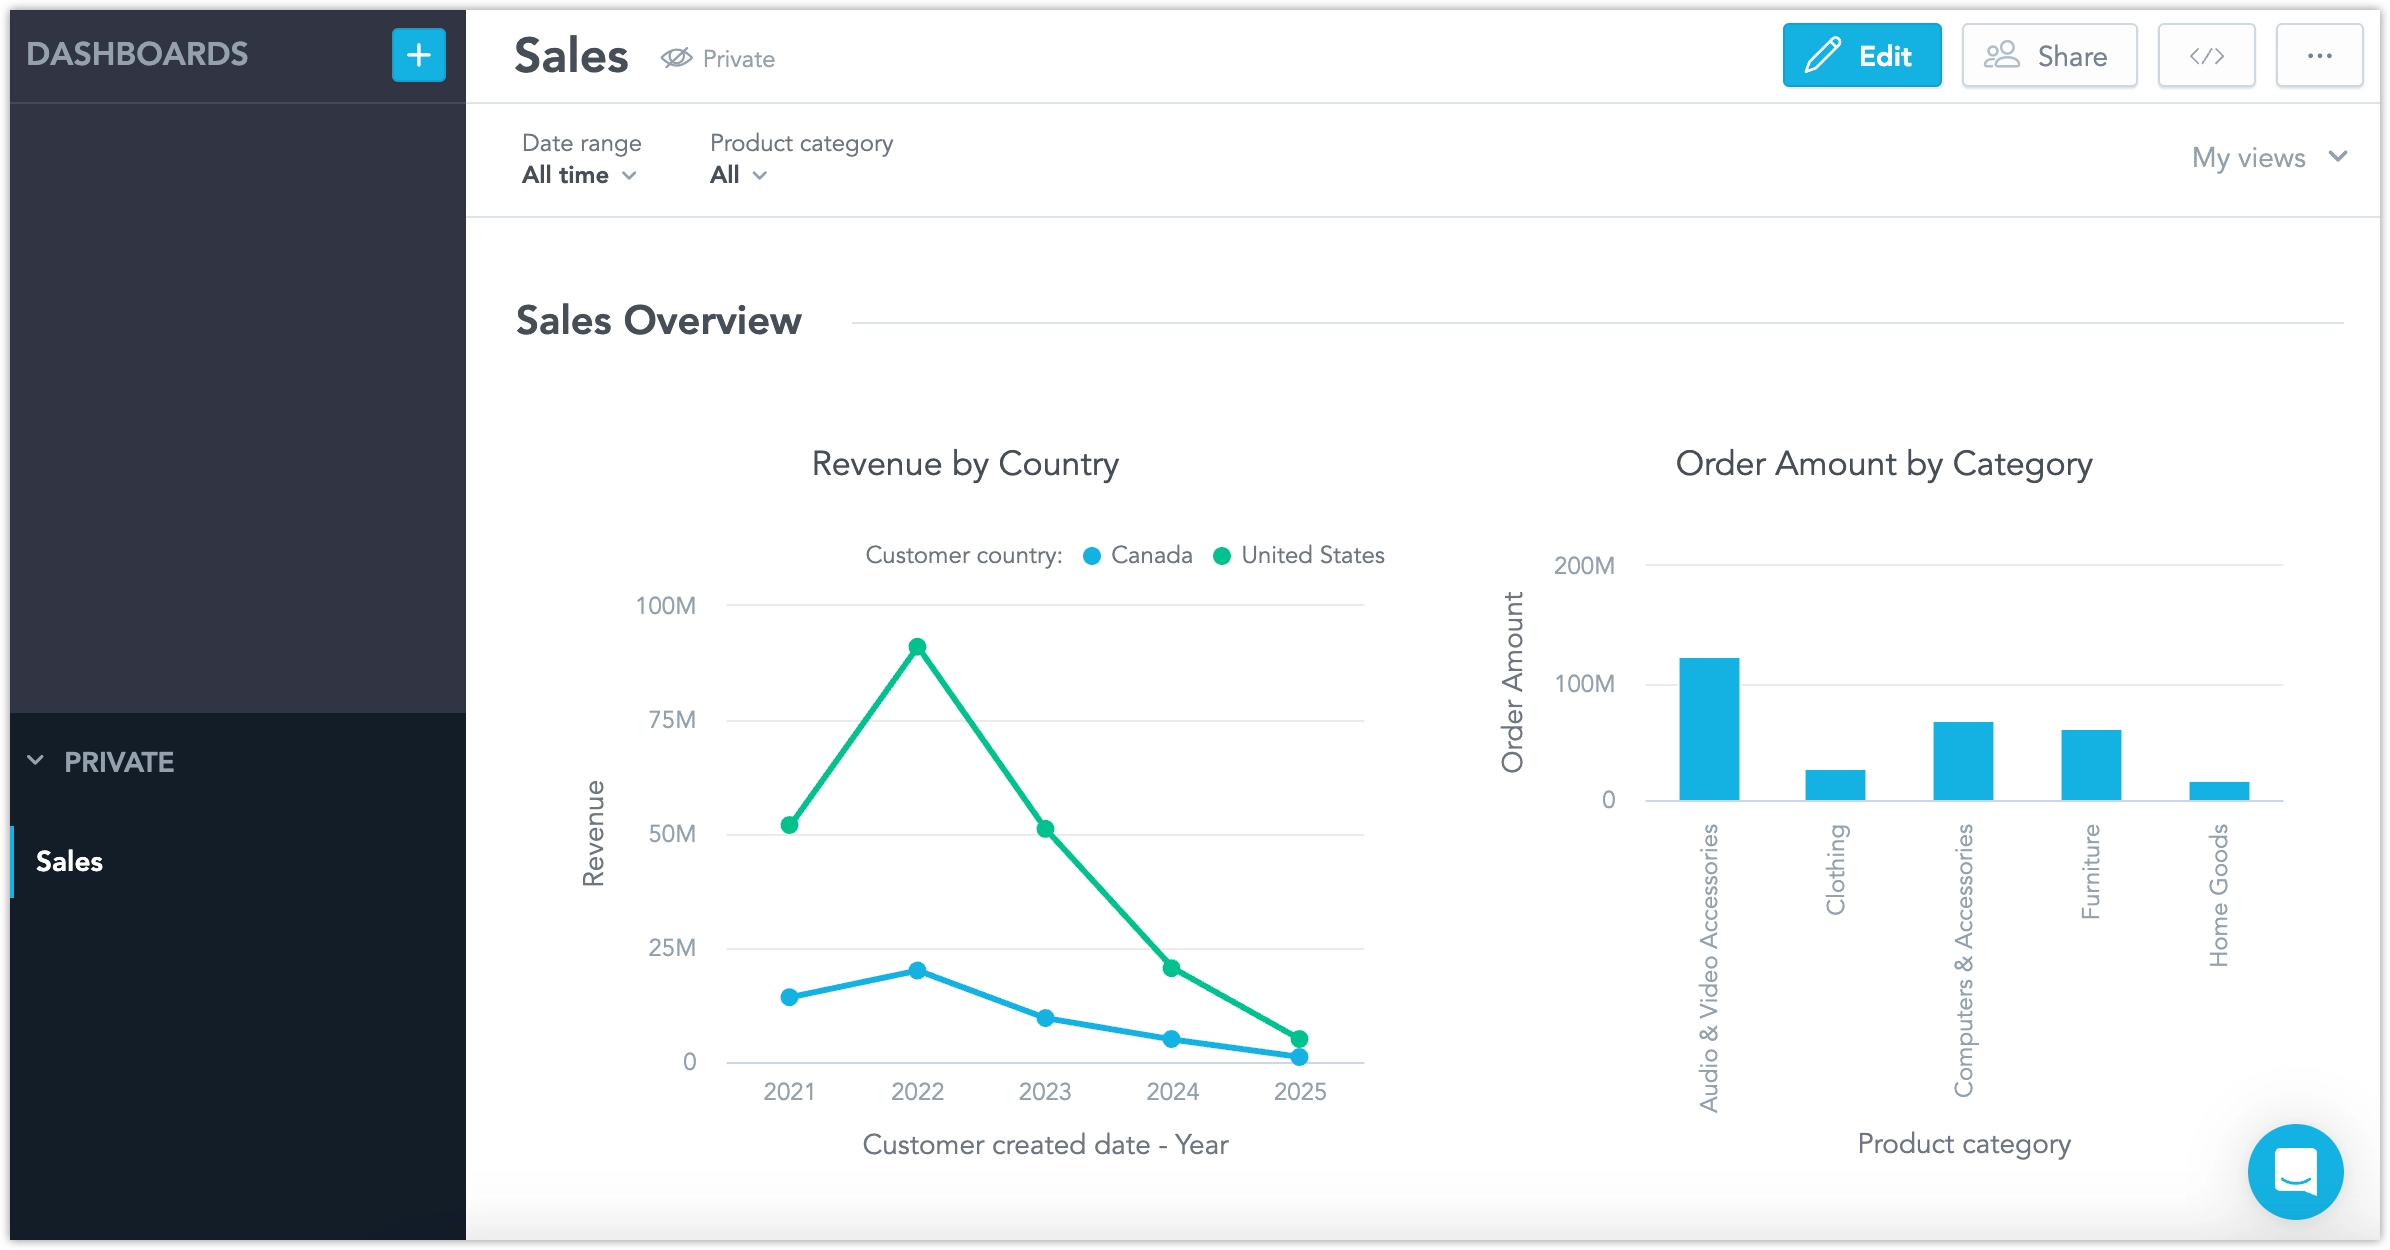
The dashboard is ready to be used:
To create a dashboard, submit a POST request to /api/v1/entities/workspaces/<WORKSPACE_ID>/analyticalDashboards:
curl $HOST_URL/api/v1/entities/workspaces/<WORKSPACE_ID>/analyticalDashboards \
  -H "Content-Type: application/vnd.gooddata.api+json" \
  -H "Accept: application/vnd.gooddata.api+json" \
  -H "Authorization: Bearer <API_TOKEN>" \
  -X POST \
  -d '{
  "data": {
    "id": "myDashboardId",
    "type": "analyticalDashboard",
    "attributes": {
      "title": "Sales API",
      "description": "",
      "content": {
        "filterContextRef": {
          "identifier": {
            "id": "570e2500-f64b-463e-8f2b-291aa21fb3e9",
            "type": "filterContext"
          }
        },
        "layout": {
          "type": "IDashboardLayout",
          "sections": [
            {
              "type": "IDashboardLayoutSection",
              "header": {
                "title": "Sales Overview"
              },
              "items": [
                {
                  "type": "IDashboardLayoutItem",
                  "widget": {
                    "type": "insight",
                    "insight": {
                      "identifier": {
                        "id": "22246615-c6bf-4979-a123-8a09fca3e901",
                        "type": "visualizationObject"
                      }
                    },
                    "ignoreDashboardFilters": [],
                    "drills": [],
                    "title": "Revenue by Country",
                    "description": "",
                    "dateDataSet": {
                      "identifier": {
                        "id": "customer_created_date",
                        "type": "dataset"
                      }
                    },
                    "localIdentifier": "3361d1f9-9822-4467-ad58-c7a915e7d4d1"
                  },
                  "size": {
                    "xl": {
                      "gridHeight": 22,
                      "gridWidth": 6
                    }
                  }
                },
                {
                  "type": "IDashboardLayoutItem",
                  "widget": {
                    "type": "insight",
                    "insight": {
                      "identifier": {
                        "id": "060329b5-e38e-414c-9761-21da2f22da94",
                        "type": "visualizationObject"
                      }
                    },
                    "ignoreDashboardFilters": [],
                    "drills": [],
                    "title": "Order Amount by Category",
                    "description": "",
                    "dateDataSet": {
                      "identifier": {
                        "id": "customer_created_date",
                        "type": "dataset"
                      }
                    },
                    "localIdentifier": "a6f51ad2-707b-4a5e-882f-426929b617ac"
                  },
                  "size": {
                    "xl": {
                      "gridHeight": 22,
                      "gridWidth": 6
                    }
                  }
                }
              ]
            }
          ]
        },
        "version": "2"
      }
    }
  }
}' | jq .