Dependency Wheel Chart
This visualization type is only available in GoodData Cloud.
Dependency wheels show the relationships among multiple entities or variables. They are mostly used in network mapping, supply chain analysis, or project management. For example, a dependency wheel chart can highlight the relationships among tasks in a project, therefore help you identify areas of high dependency or vulnerability.
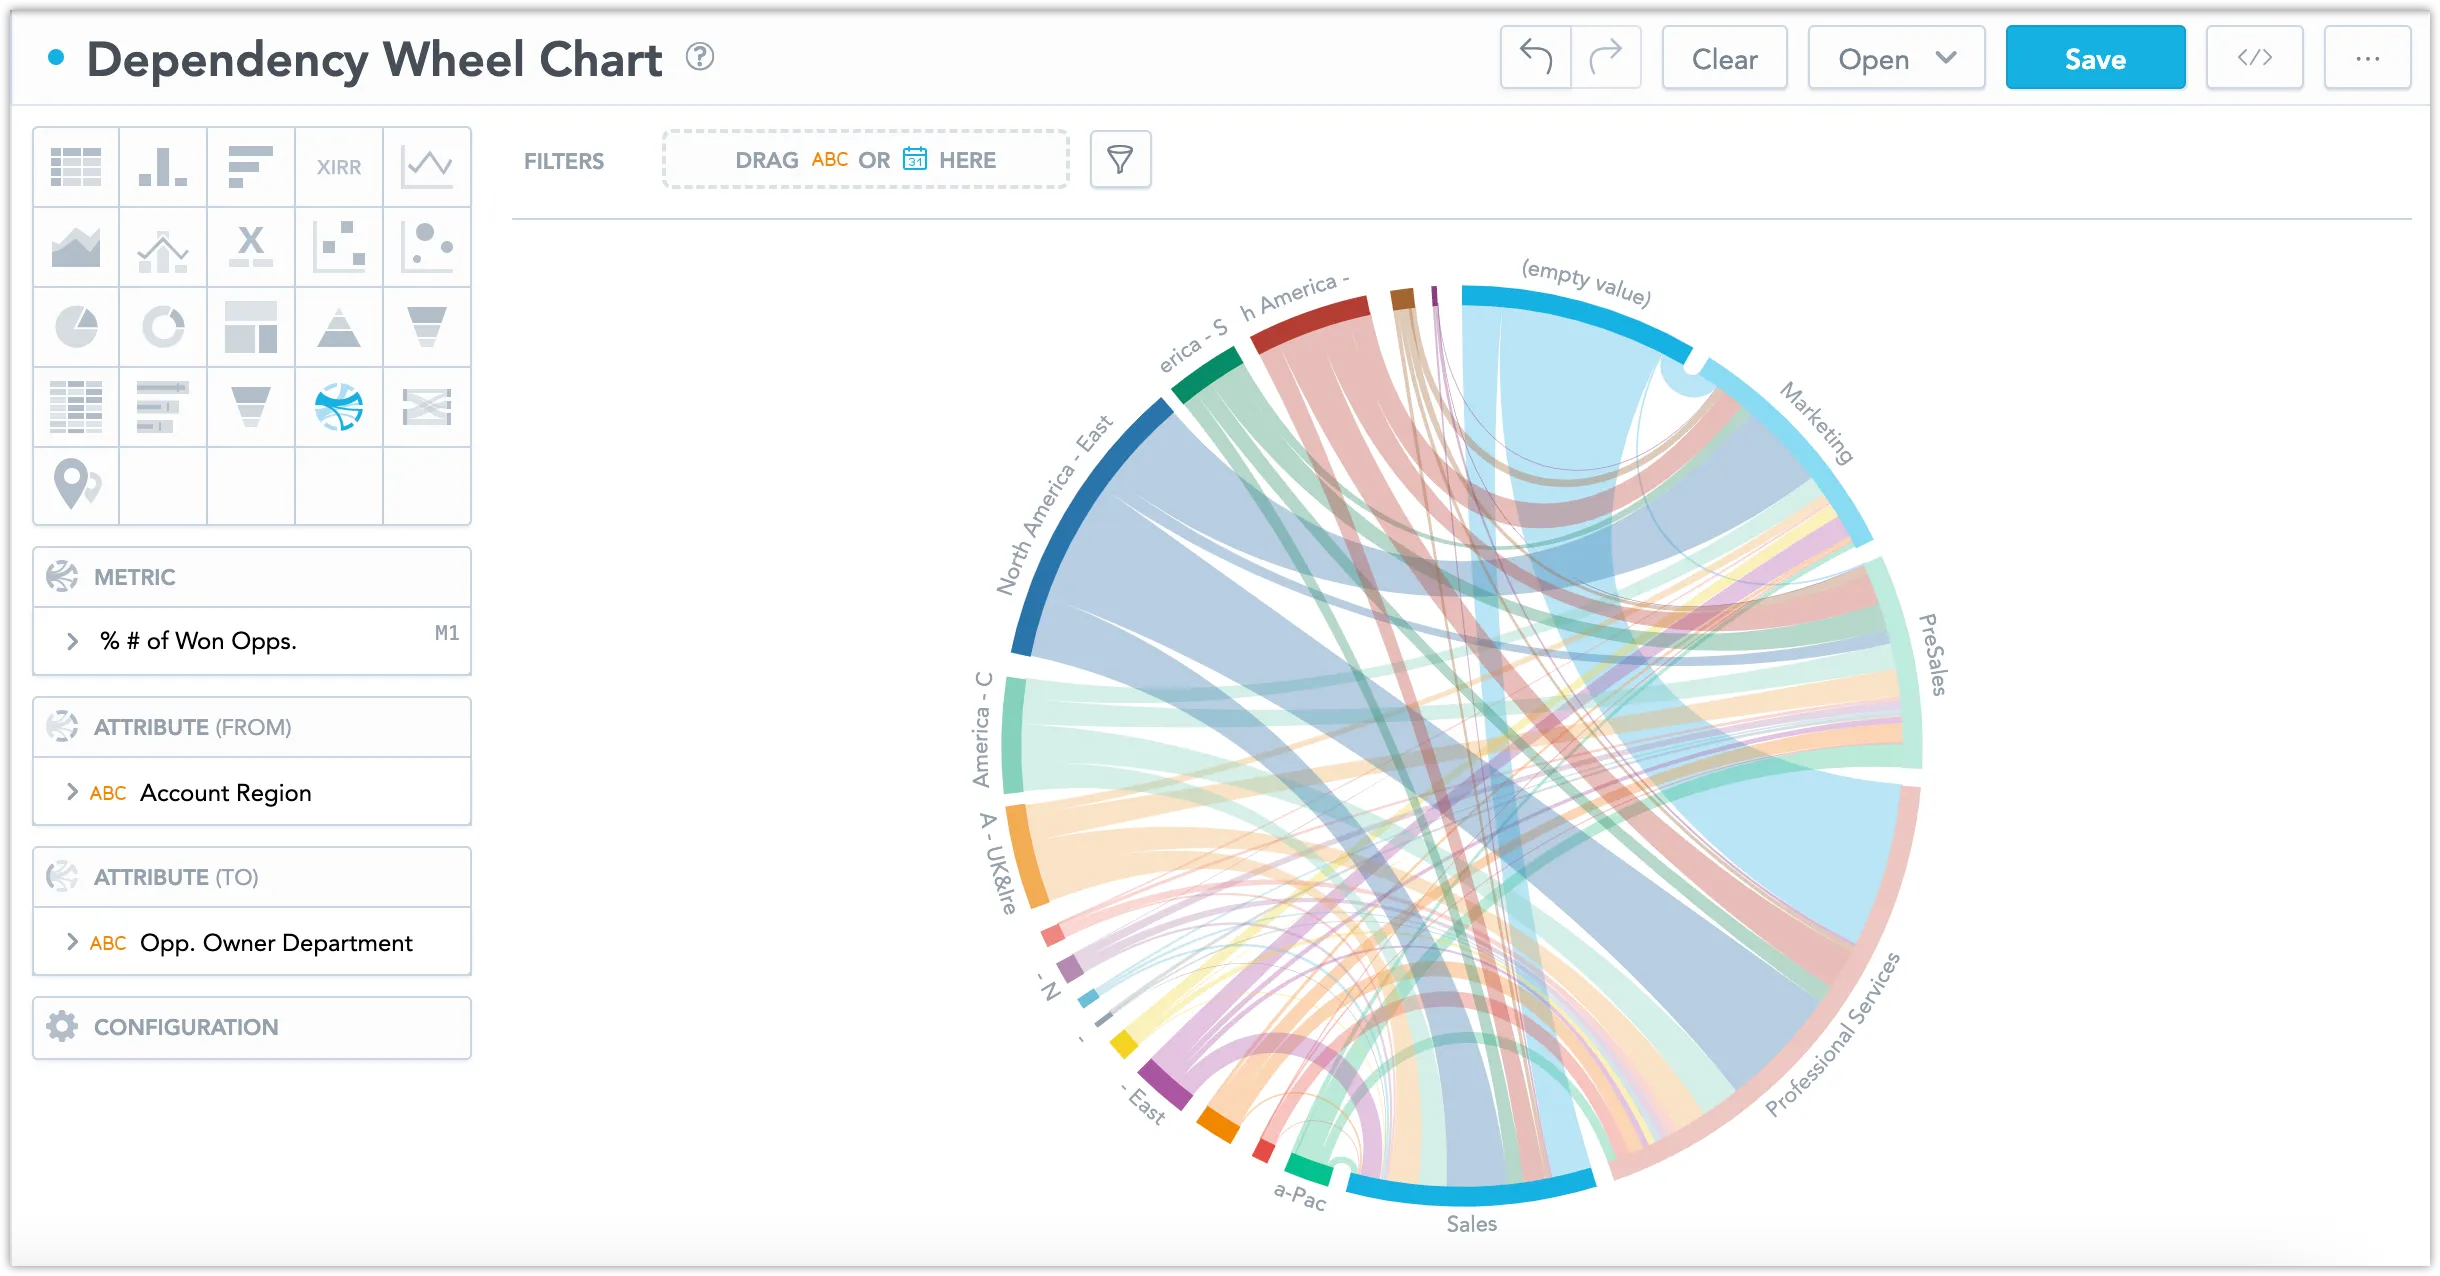
Dependency Wheels have the following sections:
- Metrics
- Attribute (From)
- Attribute (To)
- Configuration
You can also display the values as a percentage of the total sum. To do so, check the Show in % checkbox in the Metric section.
This visualization combines the values of From and To attributes. For example, a dependency wheel chart showing the number of flights between 2 airports has 2 nodes. These represent the airports and show the total number of flights in both directions. However, each flight direction is then represented by an individual link between both nodes (airports).
For information about common characteristics and settings of all visualizations, see the Visualization Types section.
Limits
| Bucket | Limit |
|---|---|
| Metric | 1 metric |
| Attribute (from) | 1 attribute |
| Attribute (to) | 1 attribute |