Export Dashboards and Widgets
Exporting dashboards and individual widgets is a great way to share insights, present your data to stakeholders, or further analyze results outside of GoodData. Whether you need a PDF snapshot of a dashboard for a quick overview, a slide deck presentation for meetings (PDF/PPTX), or raw data to manipulate in spreadsheets (XLSX/CSV), GoodData offers flexible export options.
Users require the Workspace.EXPORT permission to initiate exports.
Export Dashboard
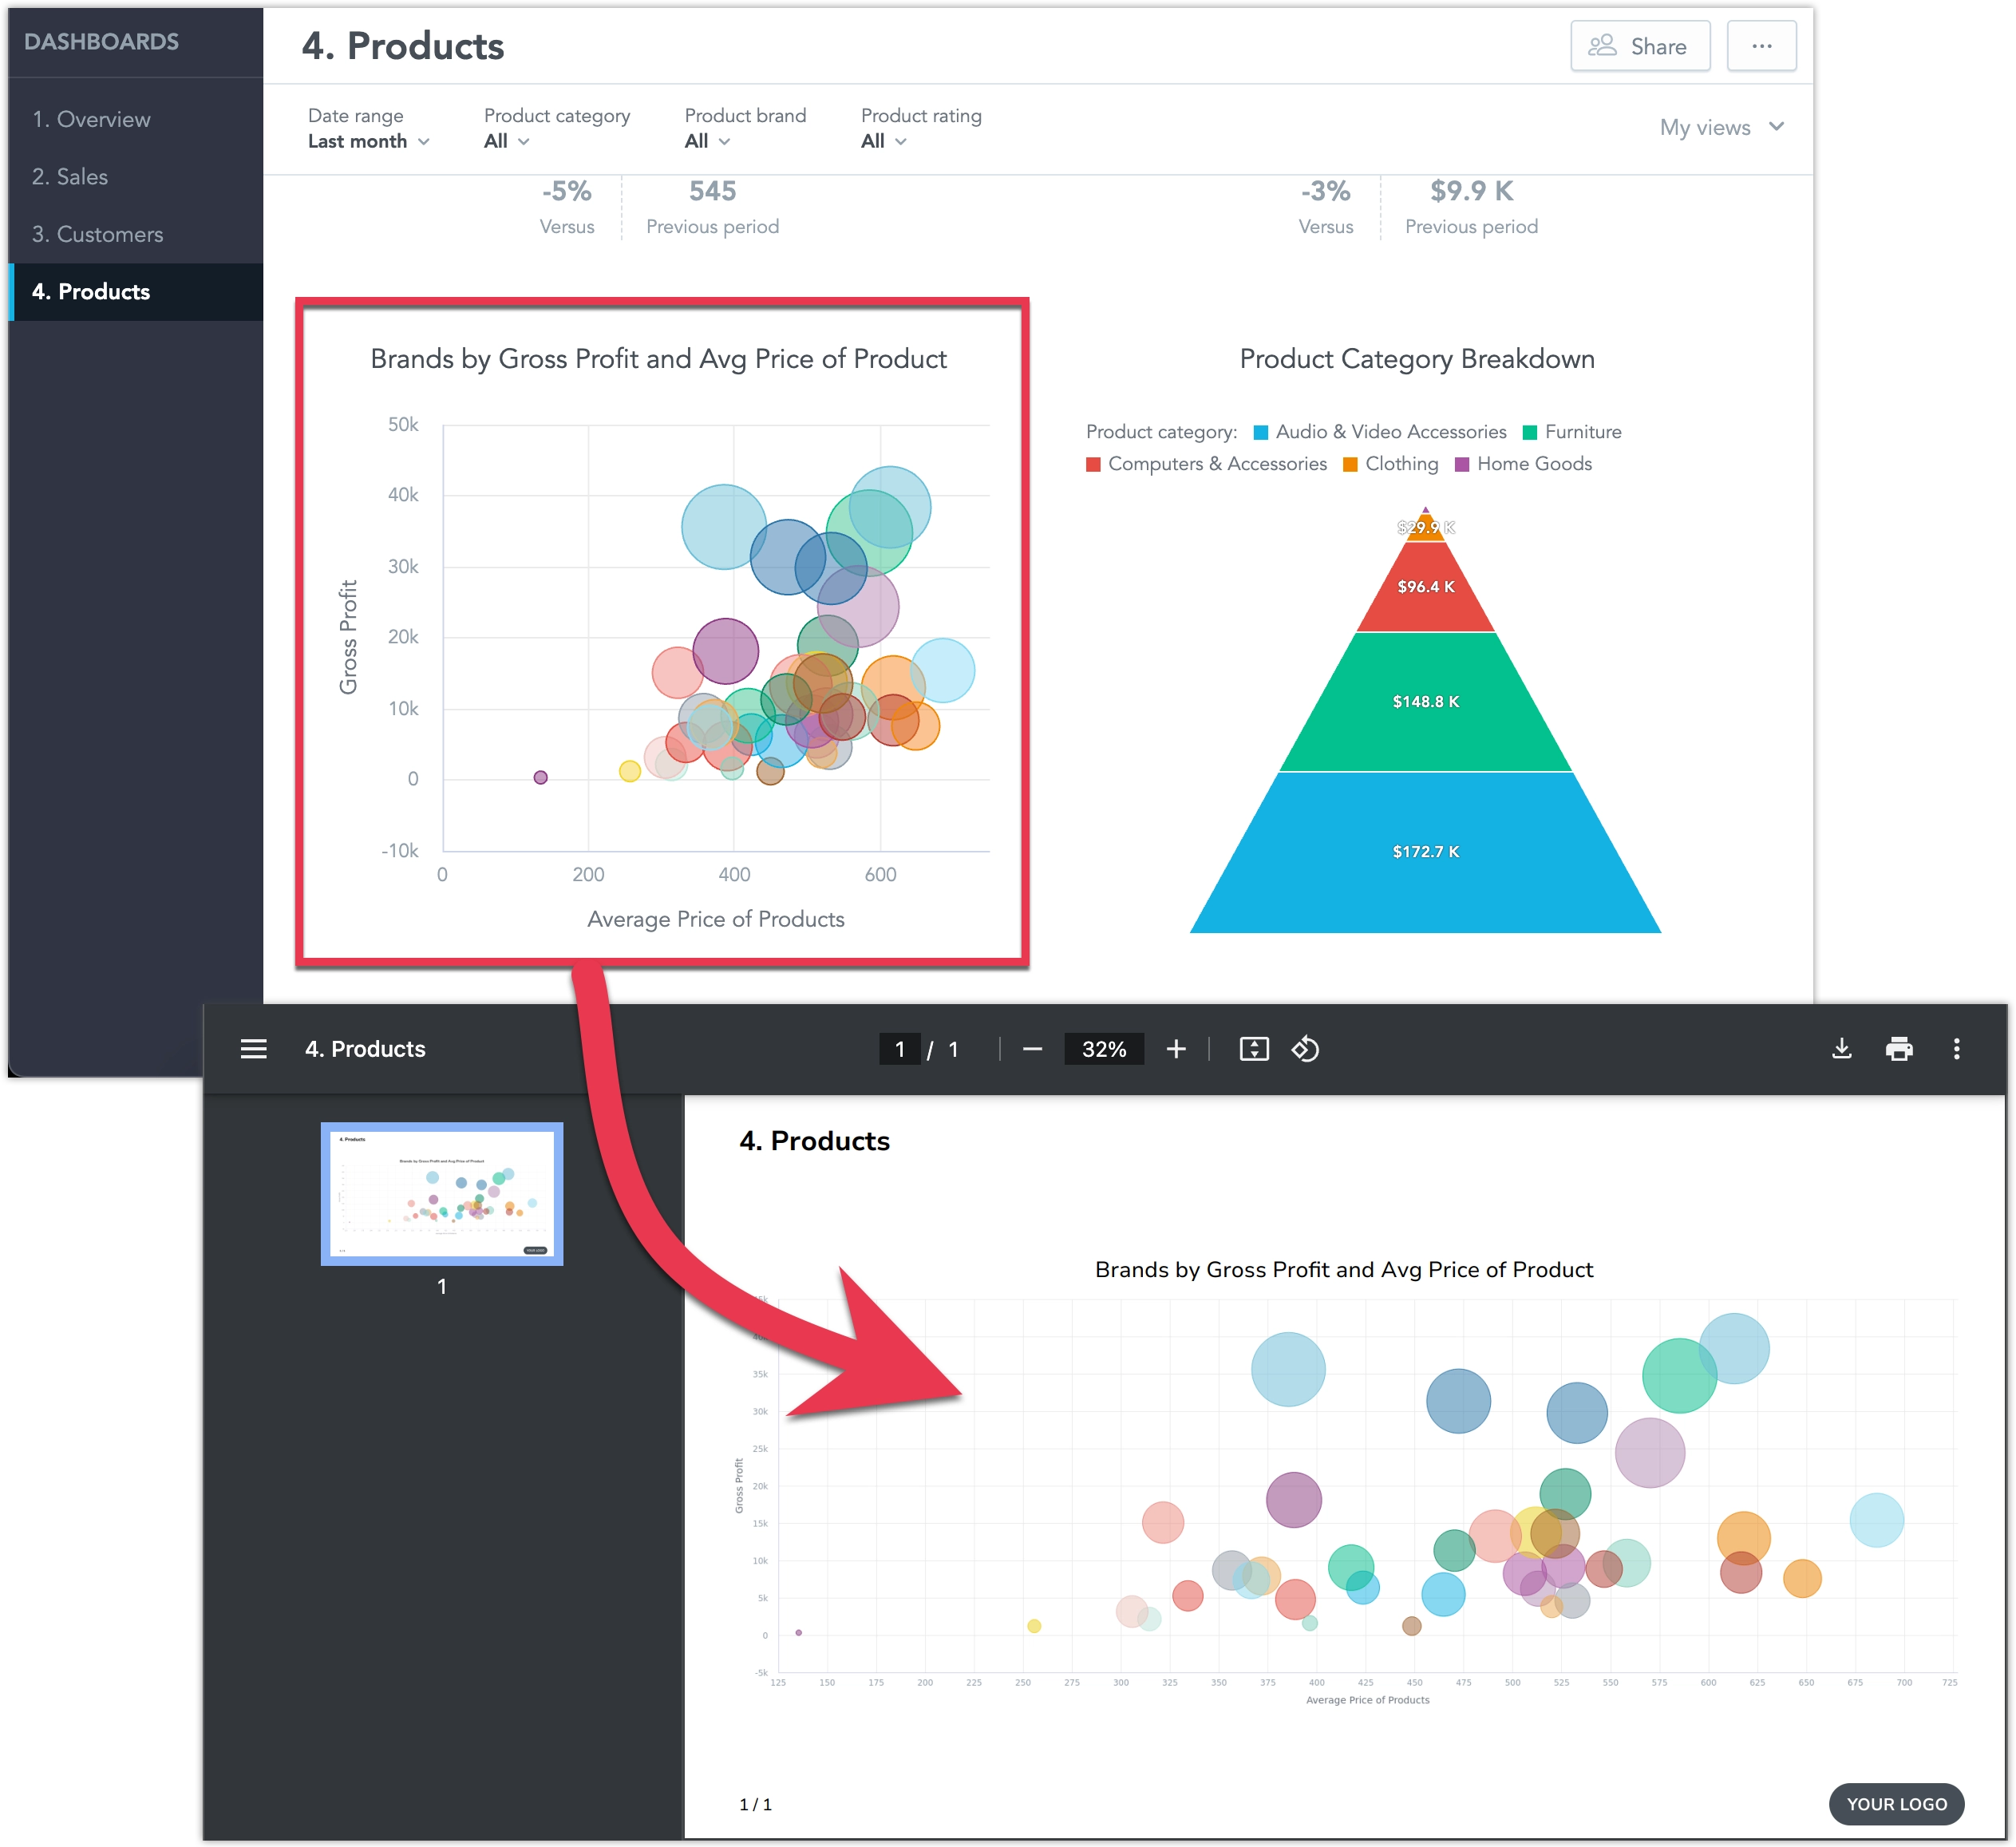
Exporting the entire dashboard allows you to capture every visualization on the page in a single file. Depending on your needs, you can choose a simple PDF snapshot or generate a multi-slide presentation in PDF/PPTX. Both methods respect your current dashboard layout and filters, ensuring consistency with what you see on screen.
Snapshot
You can export a snapshot of the whole dashboard as a PDF file:
Steps:
Open the dashboard you want to export.
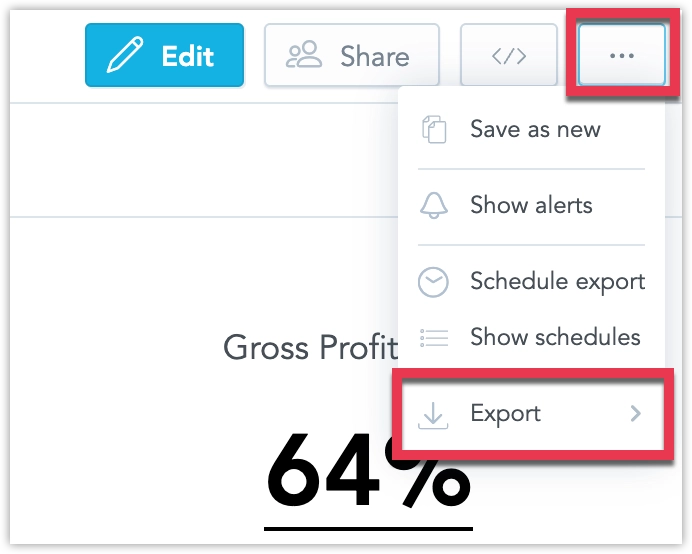
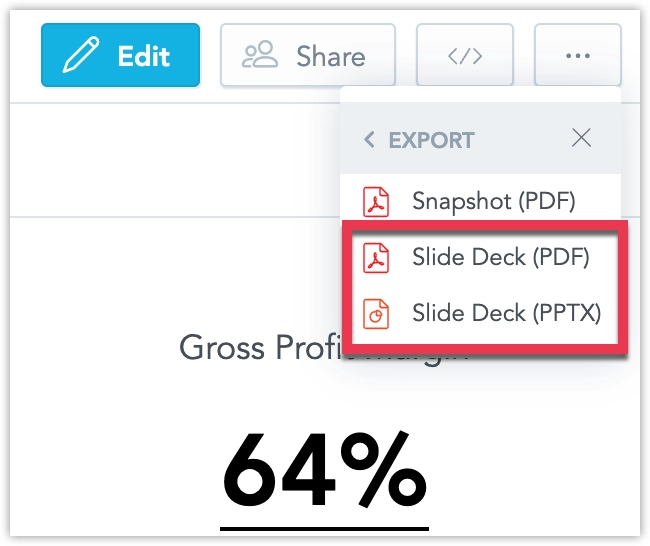
Click the … menu button in the top right corner of the dashboard and select Export:
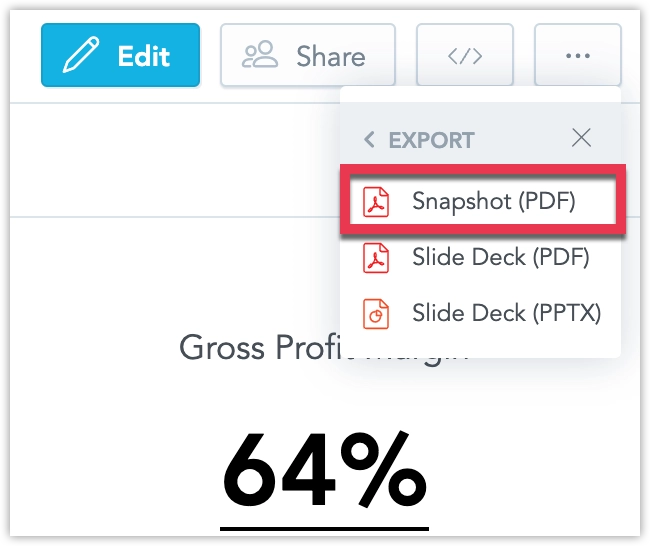
Select Snapshot (PDF):
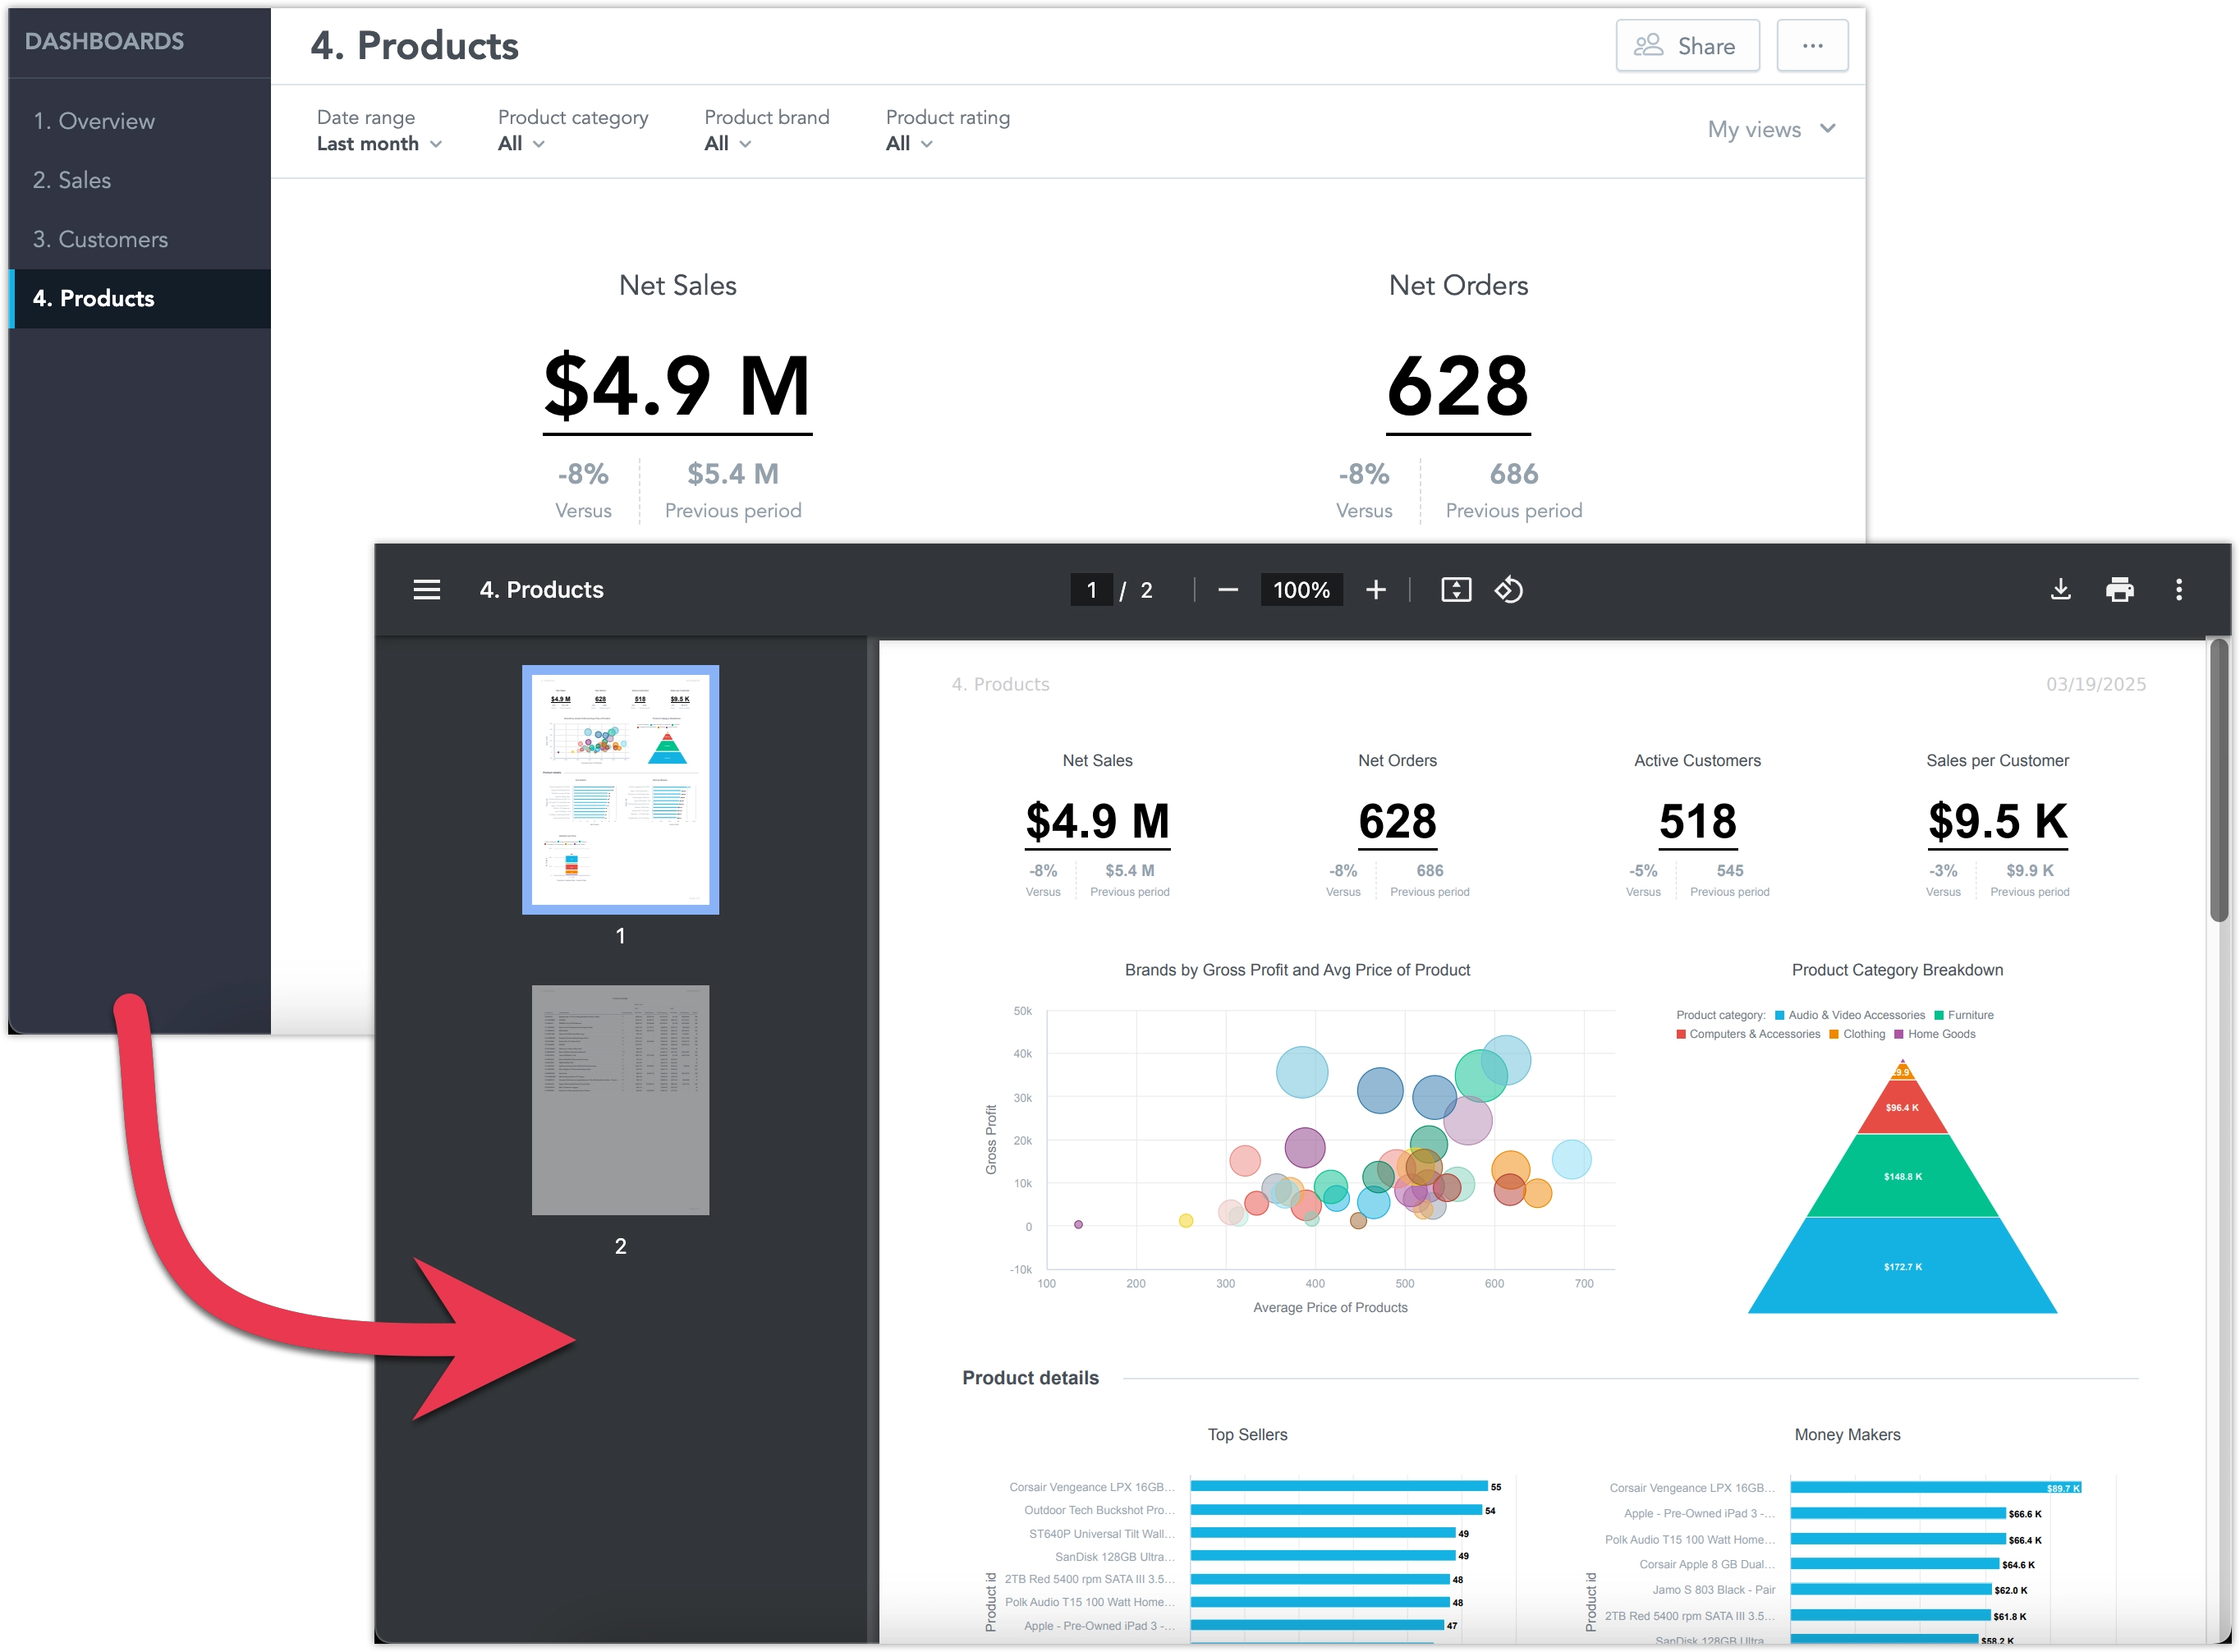
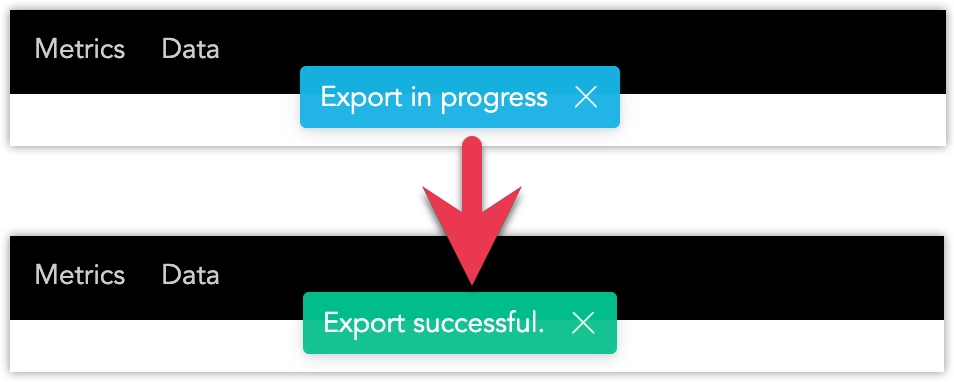
The export file will start being processed, do not leave the page before the file is finalized and downloaded to your machine:
Steps:
Call API endpoint
api/v1/actions/workspaces/<workspace_id>/export/visualto create a PDF snapshot of the dashboard:curl $HOST_URL/api/v1/actions/workspaces/<workspace_id>/export/visual \ -X POST \ -H "Authorization: Bearer $API_TOKEN" \ -H 'Content-Type: application/json' \ -d '{ "fileName": "<filename>", "dashboardId": "<dashboard_id>", "metadata": { "filters": [ { "dateFilter": { "from": "-1", "to": "-1", "granularity": "GDC.time.month", "type": "relative" } }, { "attributeFilter": { "displayForm": { "identifier": "<attribute_label_id>", "type": "displayForm" }, "negativeSelection": true, "attributeElements": { "uris": [] }, "localIdentifier": "<attribute_filter_id>", "filterElementsBy": [], "selectionMode": "multi" } }, { "attributeFilter": { "displayForm": { "identifier": "<attribute_label_id>", "type": "displayForm" }, "negativeSelection": true, "attributeElements": { "uris": [] }, "localIdentifier": "<attribute_filter_id>", "filterElementsBy": [], "selectionMode": "multi" } }, { "attributeFilter": { "displayForm": { "identifier": ""<attribute_label_id>", "type": "displayForm" }, "negativeSelection": true, "attributeElements": { "uris": [] }, "localIdentifier": "<attribute_filter_id>", "filterElementsBy": [], "selectionMode": "multi" } } ] } }'Note that
metadata.filtersis an optional property used to set specific dashboard filter values for the dashboard snapshot. You can omit this property if you want to use the default dashboard filter values.The response returned to your API call will contain parameter
executionResultwith some value<result_id>.Call API endpoint
api/v1/actions/workspaces/<workspace_id>/export/visual/<result_id>to download the file:curl $HOST_URL/api/v1/actions/workspaces/<workspace_id>/export/visual/<result_id> \ -X GET \ -H "Authorization: Bearer $API_TOKEN" \ -H 'Content-Type: application/json'It may take a few seconds for the file to be created. Consider polling this endpoint until the file is ready.
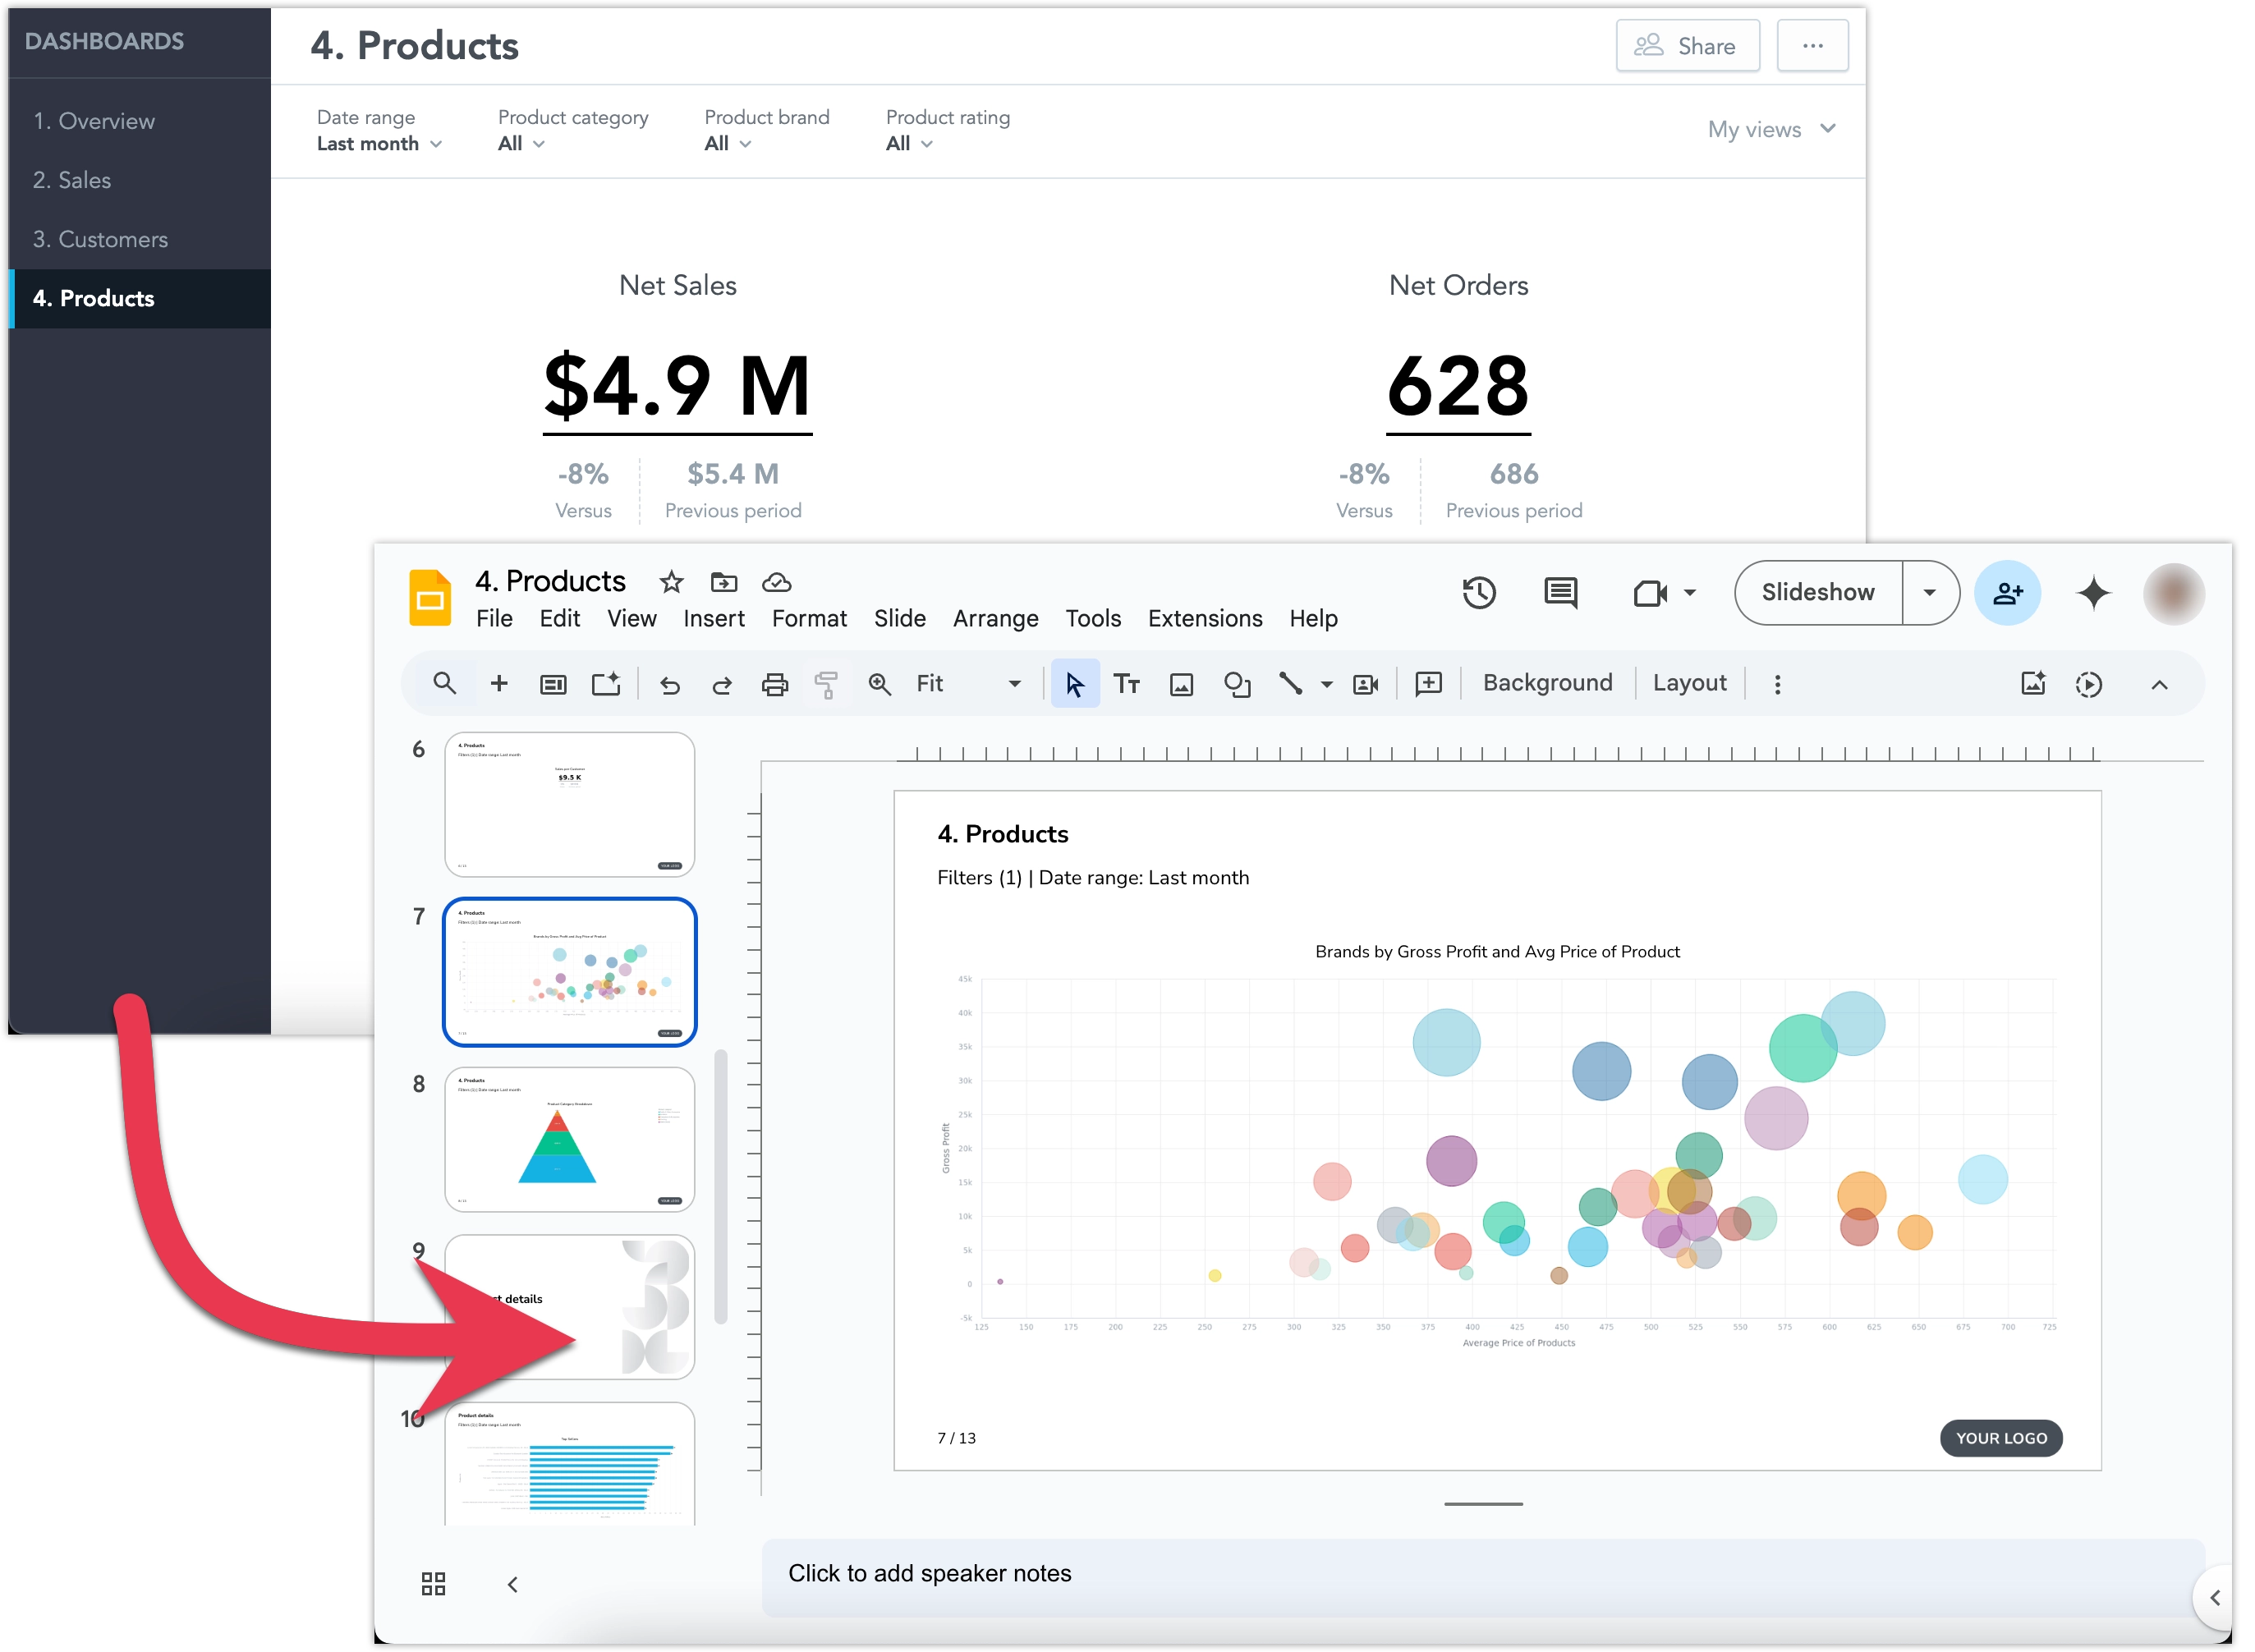
Slide Deck
If you want each dashboard section or widget on its own page, the slide deck export transforms your dashboard into slides. You can then export those slides as PDF or PPTX, making it easy to incorporate into presentations or share with stakeholders.
Steps:
Open the dashboard you want to export.
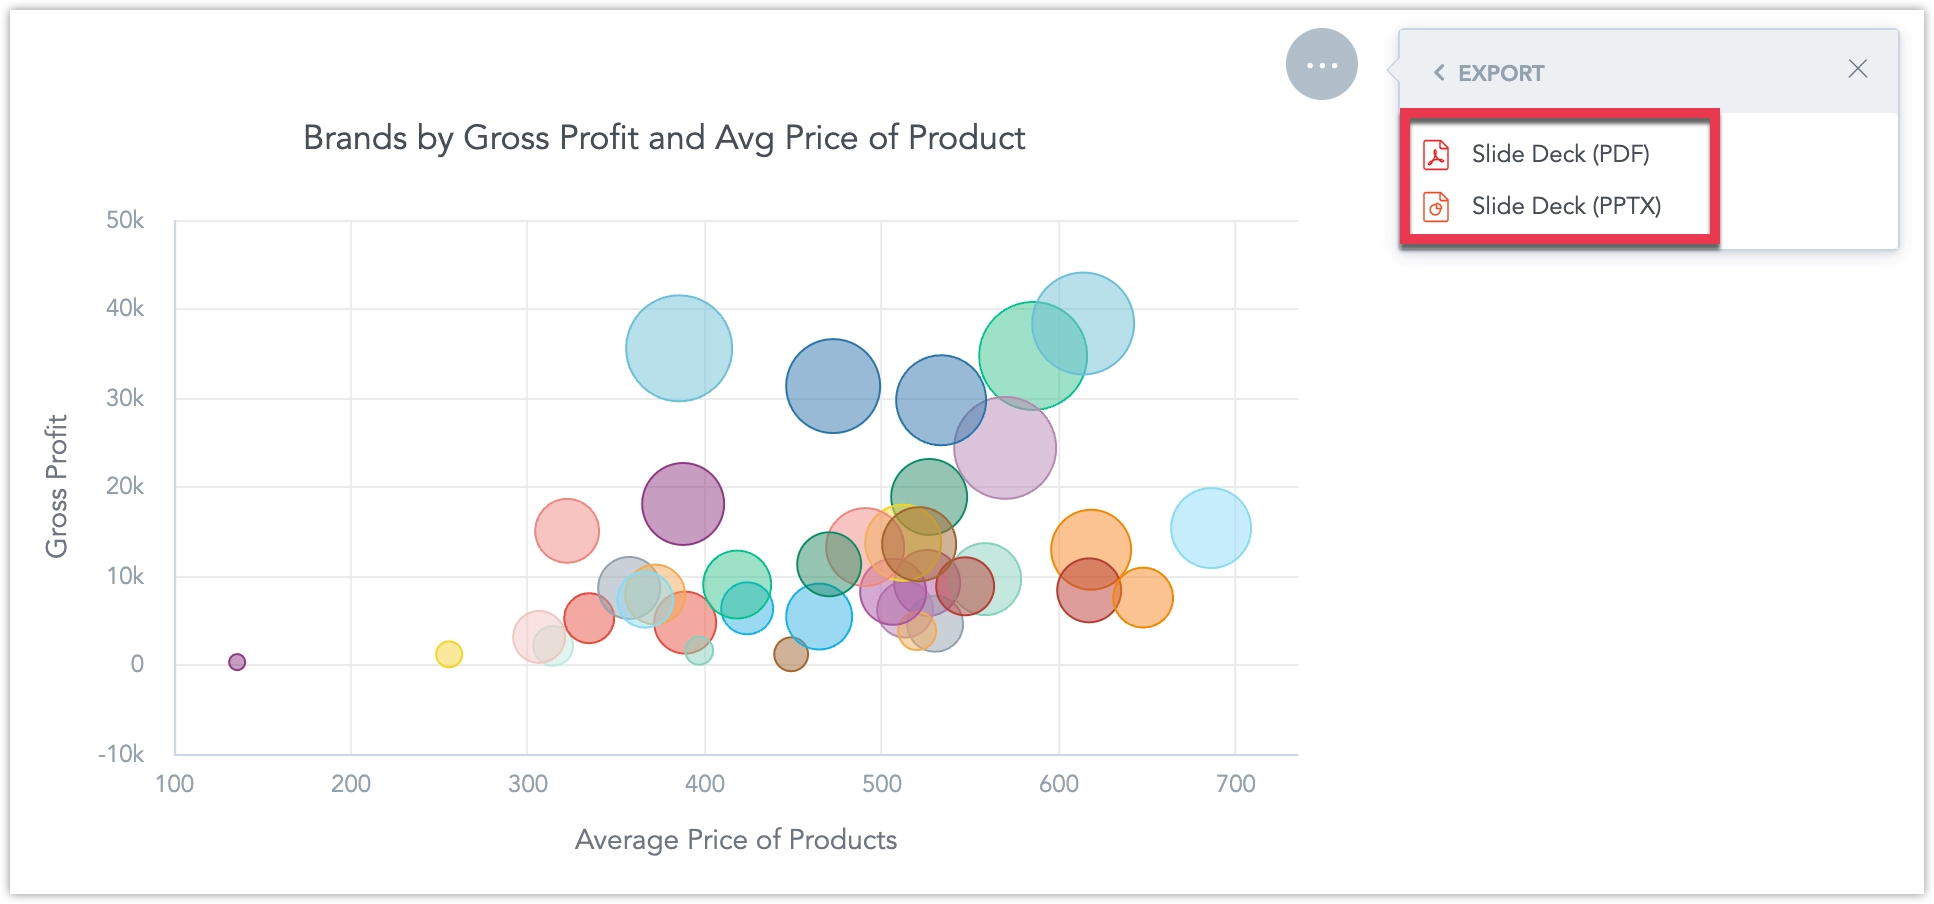
Click the … menu button in the top right corner of the dashboard and select Export:
Select Slide Deck - (PDF) or (PPTX):
The export file will start being processed, do not leave the page before the file is finalized and downloaded to your machine:
Steps:
Call API endpoint
api/v1/actions/workspaces/<workspace_id>/export/slidesto create a a PDF or PPTX file slide deck form the dashboard:curl $HOST_URL/api/v1/actions/workspaces/<workspace_id>/export/slides \ -X POST \ -H "Authorization: Bearer $API_TOKEN" \ -H 'Content-Type: application/vnd.gooddata.api+json' \ -d '{ "format": "<PDF_or_PPTX>", "dashboardId": "<dashboard_id>", "fileName": "<file_name>", "metadata": { "filters": [ { "dateFilter": { "from": "-1", "to": "-1", "granularity": "GDC.time.month", "type": "relative" } }, { "attributeFilter": { "displayForm": { "identifier": "<attribute_label_id>", "type": "displayForm" }, "negativeSelection": true, "attributeElements": { "uris": [] }, "localIdentifier": "<attribute_filter_id>", "filterElementsBy": [], "selectionMode": "multi" } }, { "attributeFilter": { "displayForm": { "identifier": "<attribute_label_id>", "type": "displayForm" }, "negativeSelection": true, "attributeElements": { "uris": [] }, "localIdentifier": "<attribute_filter_id>", "filterElementsBy": [], "selectionMode": "multi" } } ] } }'Note that
metadata.filtersis an optional property used to set specific dashboard filter values. You can omit it if you want to use the dashboard’s default filter values.You can also use export templates to change how the exported slide deck looks or behaves. See Apply Template.
The response returned to your API call will contain parameter
executionResultwith some value<result_id>.Call API endpoint
api/v1/actions/workspaces/<workspace_id>/export/slides/<export_id>to download the file:curl $HOST_URL/api/v1/actions/workspaces/<workspace_id>/export/slides/<export_id> \ -X GET \ -H "Authorization: Bearer $API_TOKEN" \ -H 'Content-Type: application/vnd.gooddata.api+json' \ -O "<output_file_name>.<pdf_or_pptx>"It may take a few seconds for the file to be created. Consider polling this endpoint until the file is ready.
Export Widget
Sometimes you only need data or visuals from a single dashboard widget rather than the entire dashboard. GoodData allows you to export individual widgets either as a single slide (PDF/PPTX) or as tabular data (XLSX/CSV). This helps you focus on exactly the insight you want to share or analyze further.
Slide
You can export individual widgets on the dashboard as a single presentation slide in PDF or PPTX:
Steps:
Open the dashboard that contains the widget that you want to export.
Hover over the widget, click on the … menu, and select Export:
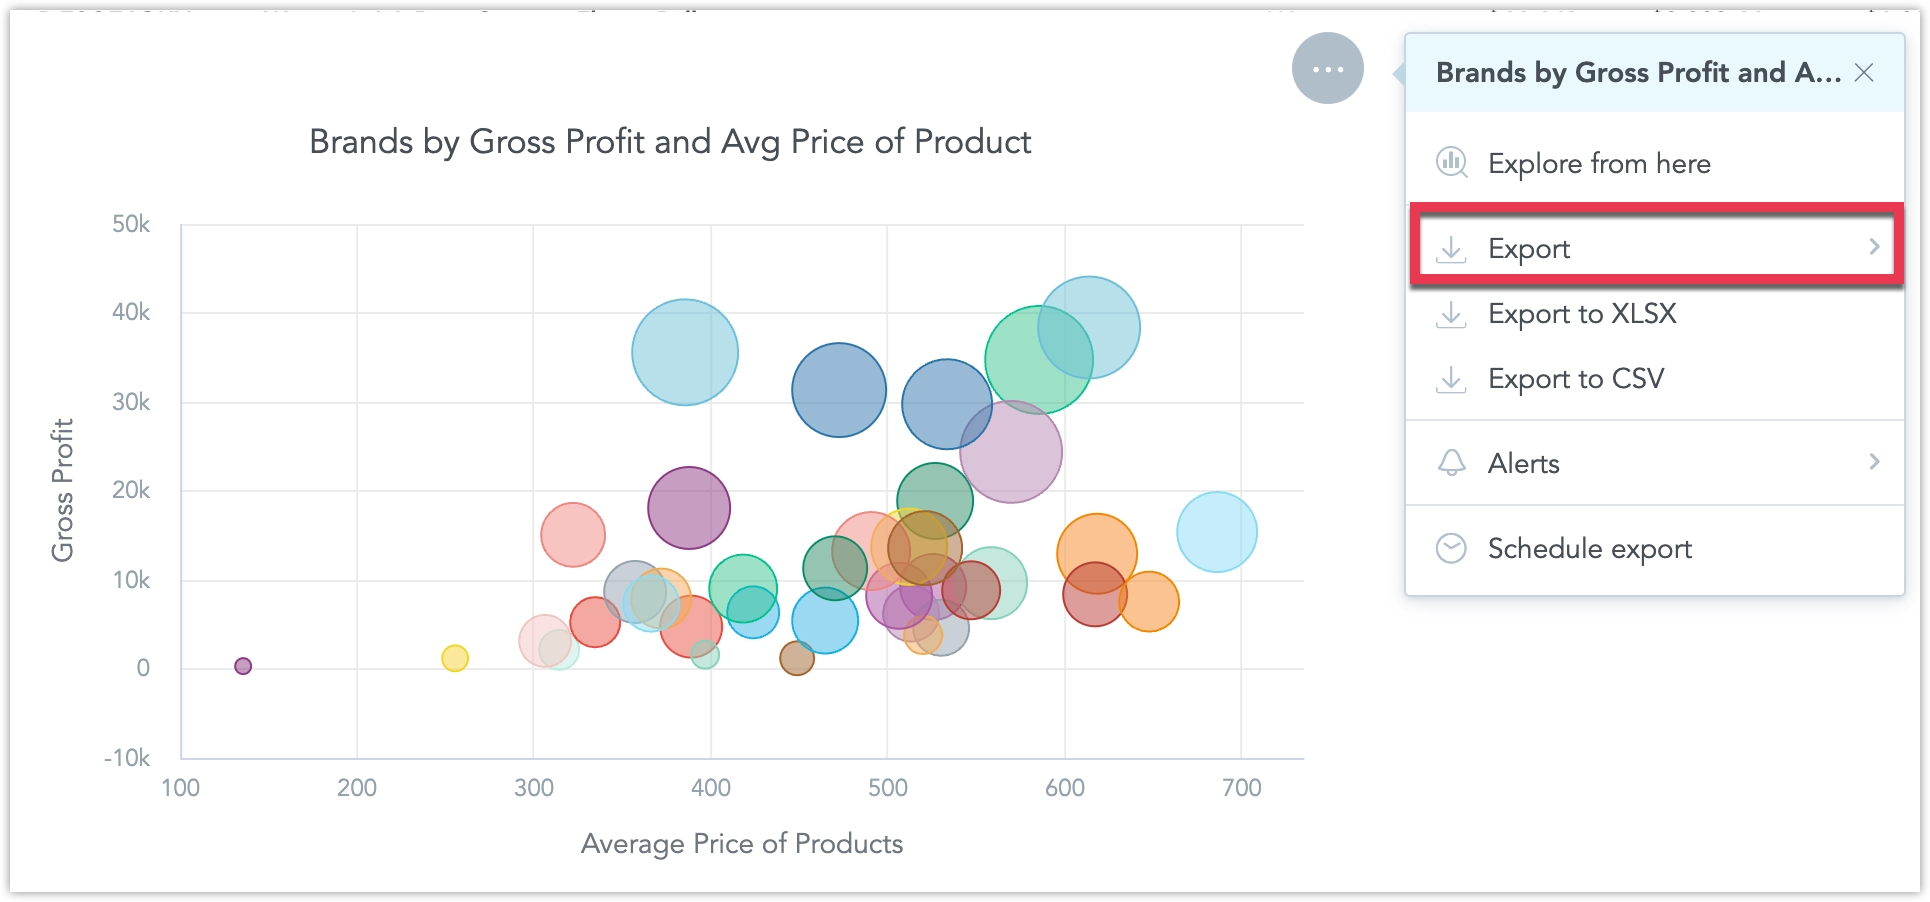
Select Slide Deck (PDF) or (PPTX):
The export file will start being processed, do not leave the page before the file is finalized and downloaded to your machine:
Steps:
Call API endpoint
api/v1/entities/workspaces/<workspace_id>/analyticalDashboards/<dashboard-id>to fetch the dashboard layout which lets you identify the widget’s ID:curl $HOST_URL/api/v1/entities/workspaces/<workspace_id>/analyticalDashboards/<dashboard-id> \ -X GET \ -H "Authorization: Bearer $API_TOKEN" \ -H 'Content-Type: application/vnd.gooddata.api+json'Look for
widget.localIdentifierof the widget you want to export to get its<widget_id>.Call API endpoint
api/v1/actions/workspaces/<workspace_id>/export/slidesto create a PDF or PPTX slide of the widget, specify your widget ID in thewidgetIdsarray:curl $HOST_URL/api/v1/actions/workspaces/<workspace_id>/export/slides \ -X POST \ -H "Authorization: Bearer $API_TOKEN" \ -H 'Content-Type: application/vnd.gooddata.api+json' \ -d '{ "format": "<PDF_or_PPTX>", "dashboardId": "<dashboard_id>", "fileName": "<file_name>", "widgetIds": [ "<widget_id>" ], "metadata": { "filters": [ { "dateFilter": { "from": "-1", "to": "-1", "granularity": "GDC.time.month", "type": "relative" } }, { "attributeFilter": { "displayForm": { "identifier": "<attribute_label_id>", "type": "displayForm" }, "negativeSelection": true, "attributeElements": { "uris": [] }, "localIdentifier": "<attribute_filter_id>", "filterElementsBy": [], "selectionMode": "multi" } }, { "attributeFilter": { "displayForm": { "identifier": "<attribute_label_id>", "type": "displayForm" }, "negativeSelection": true, "attributeElements": { "uris": [] }, "localIdentifier": "<attribute_filter_id>", "filterElementsBy": [], "selectionMode": "multi" } } ] } }'Note that
metadata.filtersis an optional property used to set specific dashboard filter values for the widget export. You can omit this property if you want to use the default dashboard filter values.You can also use export templates to change how the exported slide deck looks or behaves. See Apply Template.
The response returned to your API call will contain parameter
executionResultwith some value<result_id>.Call API endpoint
api/v1/actions/workspaces/<workspace_id>/export/slides/<export_id>to download the file:curl $HOST_URL/api/v1/actions/workspaces/<workspace_id>/export/slides/<export_id> \ -X GET \ -H "Authorization: Bearer $API_TOKEN" \ -H 'Content-Type: application/vnd.gooddata.api+json' \ -O "<output_file_name>.<pdf_or_pptx>"Note that in Step 2 it may take a few seconds for the file to be created. Consider polling the endpoint in Step 3 until the file is ready.
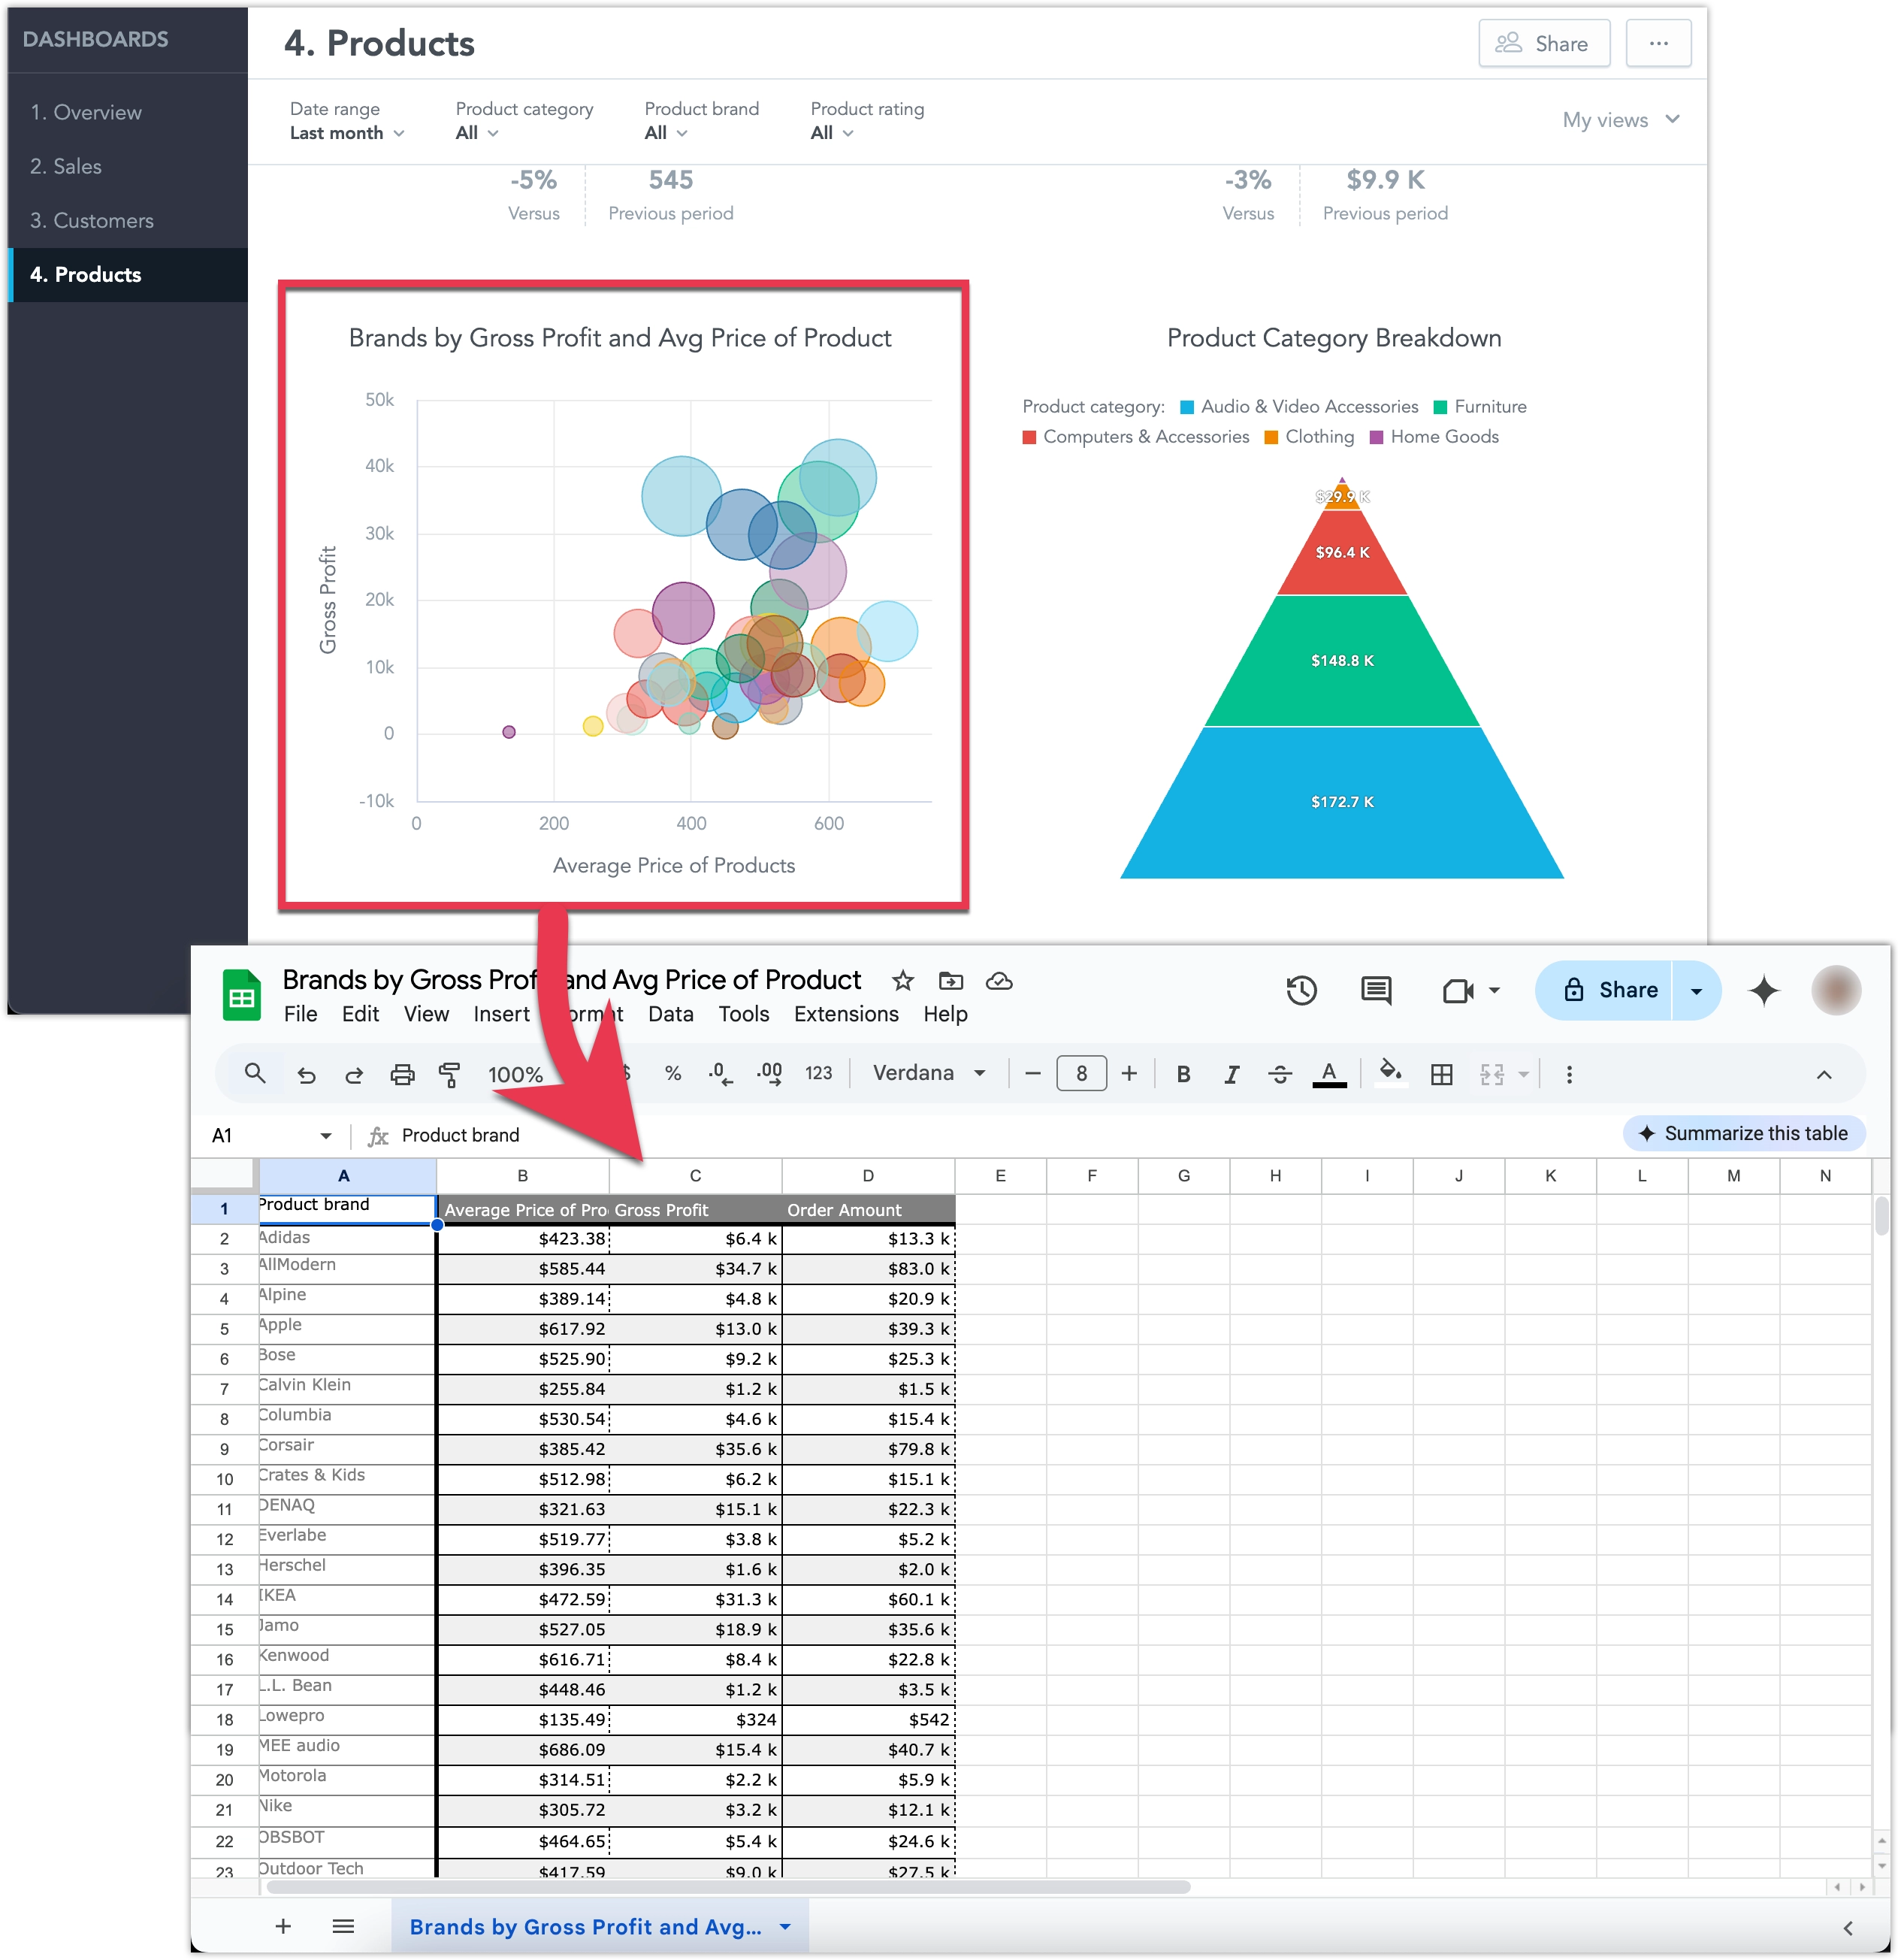
Tabular Data
If you need raw data for further manipulation, you can export the table behind a widget to XLSX or CSV. This is ideal for deeper analysis in spreadsheets or other external tools.
Steps:
Open the dashboard that contains the widget that you want to export.
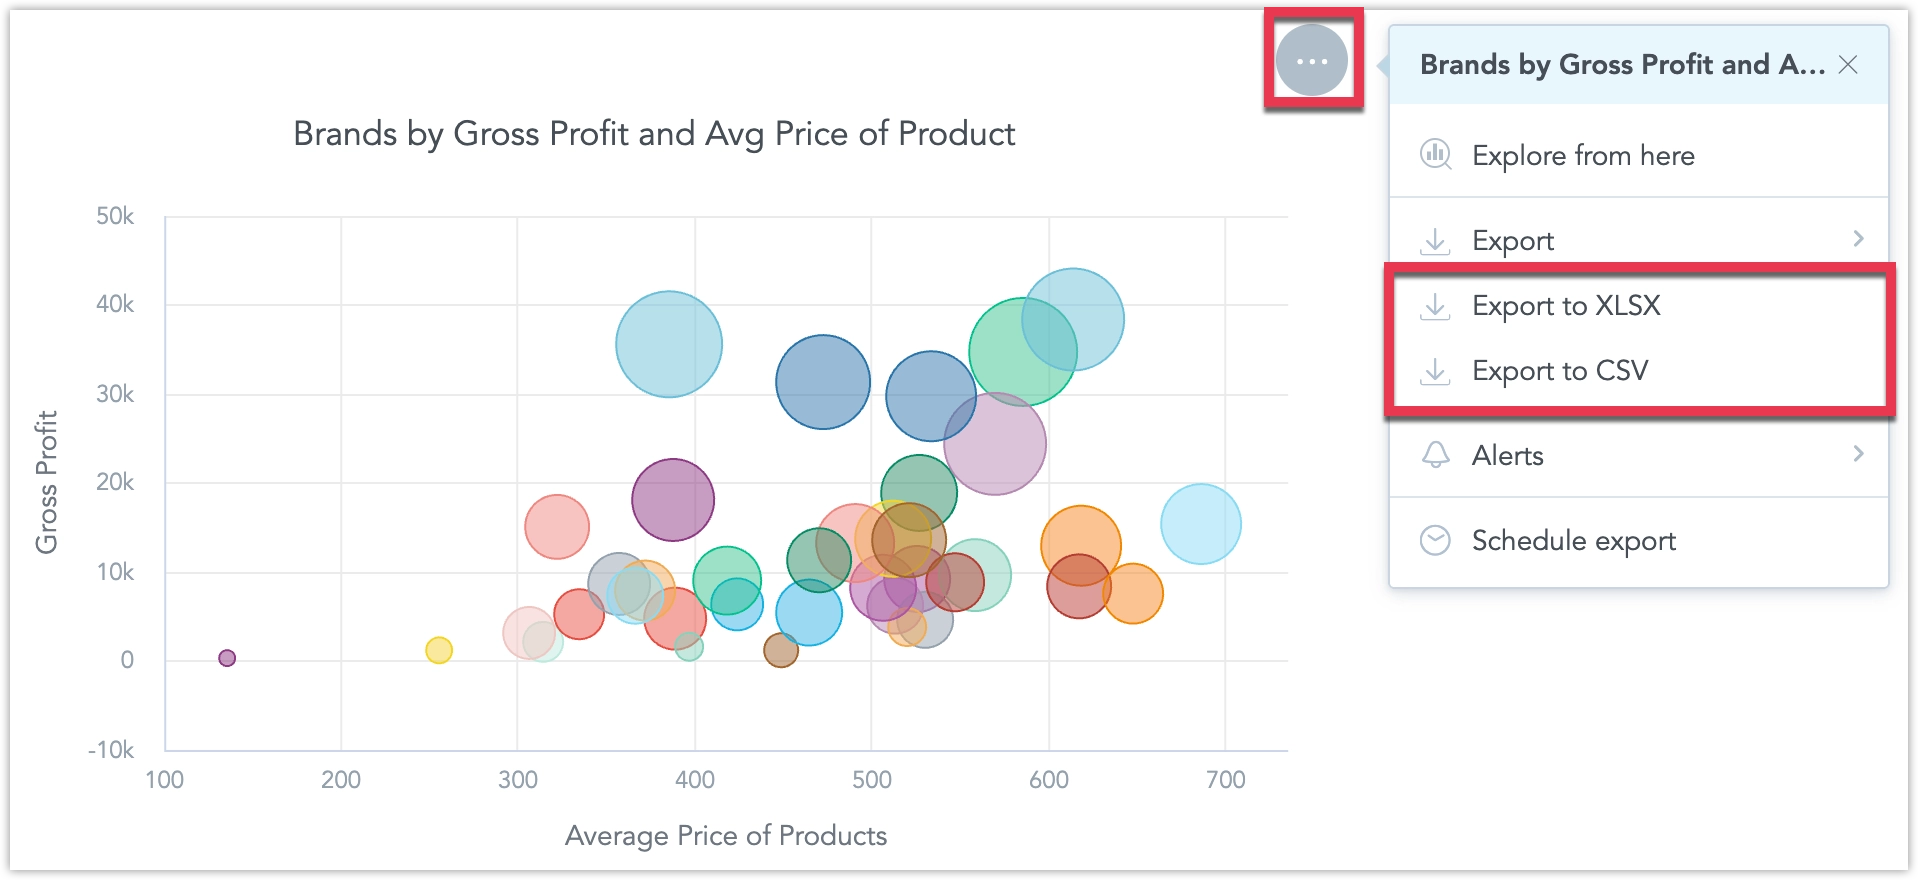
Hover over the widget and click on the … menu, and select Export to XLSX or CSV:
The export file will start being processed, do not leave the page before the file is finalized and downloaded to your machine:
To export data from a widget into a XLSX or CSV file, you need to define to use the AFM API.
Steps:
Compute the raw result using API endpoint
api/v1/actions/workspaces/<workspace_id>/execution/afm/execute:curl $HOST_URL/api/v1/actions/workspaces/<workspace_id>/execution/afm/execute \ -X POST \ -H "Authorization: Bearer $API_TOKEN" \ -H 'Content-Type: application/json' \ -d '{ "resultSpec": { "dimensions": [ { "localIdentifier": "dim_0", "itemIdentifiers": [ "458f2a55e1ca457883ff36141c84dc48" ] }, { "localIdentifier": "dim_1", "itemIdentifiers": [ "measureGroup" ] } ], "totals": [] }, "execution": { "measures": [ { "localIdentifier": "0f489725fe26493fb5fdc3d2367c21ed", "definition": { "measure": { "item": { "identifier": { "id": "average_price_of_products", "type": "metric" } } } } }, { "localIdentifier": "a279058ddf724659b6b7cad14bd63404", "definition": { "measure": { "item": { "identifier": { "id": "gross_profit", "type": "metric" } } } } }, { "localIdentifier": "7e4fe02cd17d4da38ec6d464646bbbb1", "definition": { "measure": { "item": { "identifier": { "id": "order_amount", "type": "metric" } } } } } ], "attributes": [ { "label": { "identifier": { "id": "product_brand", "type": "label" } }, "localIdentifier": "458f2a55e1ca457883ff36141c84dc48" } ], "filters": [ { "relativeDateFilter": { "dataset": { "identifier": { "id": "customer_created_date", "type": "dataset" } }, "granularity": "MONTH", "from": -1, "to": -1 } } ] } }'In the response you will get some
<execution_result_id>in the parameterexecutionResult.Use the
<execution_result_id>to create a tabular export using API endpointapi/v1/actions/workspaces/<workspace_id>/export/tabular:curl $HOST_URL/api/v1/actions/workspaces/<workspace_id>/export/tabular \ -X POST \ -H "Authorization: Bearer $API_TOKEN" \ -H 'Content-Type: application/json' \ -d '{ "format": "<XLSX_or_CSV>", "executionResult": "<execution_result_id>", "fileName": "<filename>", "settings": { "mergeHeaders": <false_or_true>, "showFilters": <false_or_true> } "customOverride": { "metrics": { "<metric_id_1>": { "title": "<metric_title_1>", "format": "$#,##0.00" }, "<metric_id_2>": { "title": "<metric_title_2>", "format": "[>=1000000000000]$#,,,,.0 T;\n[>=1000000000]$#,,,.0 B;\n[>=1000000]$#,,.0 M;\n[>=1000]$#,.0 K;\n[>=0]$#,##0;\n[<=-1000000000000]-$#,,,,.0 T;\n[<=-1000000000]-$#,,,.0 B;\n[<=-1000000]-$#,,.0 M;\n[<=-1000]-$#,.0 K;\n[<0]-$#,##0" }, "<metric_id_3>": { "title": "<metric_title_3>", "format": "[>=1000000000000]$#,,,,.0 T;\n[>=1000000000]$#,,,.0 B;\n[>=1000000]$#,,.0 M;\n[>=1000]$#,.0 K;\n[>=0]$#,##0;\n[<=-1000000000000]-$#,,,,.0 T;\n[<=-1000000000]-$#,,,.0 B;\n[<=-1000000]-$#,,.0 M;\n[<=-1000]-$#,.0 K;\n[<0]-$#,##0" } }, "labels": { "<attribute_label_id>": { "title": "<attribute_label_title>" } } } }'Note that for CSV exports, you can omit the
settingsparameter.In the response you will get some
<export_id>in the parameterexportResult.Use the
<export_id>to get the CSV file by calling the API endpointapi/v1/actions/workspaces/<workspace_id>/export/tabular/<export_id>:curl $HOST_URL/api/v1/actions/workspaces/<workspace_id>/export/tabular/<export_id> \ -X POST \ -H "Authorization: Bearer $API_TOKEN" \ -H 'Content-Type: application/json'
Limitations
There are currently certain known limitations associated with slide deck exports:
- Images included in rich text widgets do not appear in PDF slide decks.
- When dashboard descriptions are exported into PDF slide decks, any rich text variables do not display their values.
- Chinese characters are not supported in PDF slide decks.