Set Drill into Dashboard
On dashboards, you can add drill interactions to your visualizations which link the original visualization to any existing dashboard. By clicking the data in the visualization, the target dashboard then opens.
A visualization displaying multiple metrics, attributes, or both can have an independent drill interaction for each.
Create a Drill into Dashboard
In this example, you will add a drill interaction to a metric. The same procedure can be used to add a drill interaction to an attribute.
Steps:
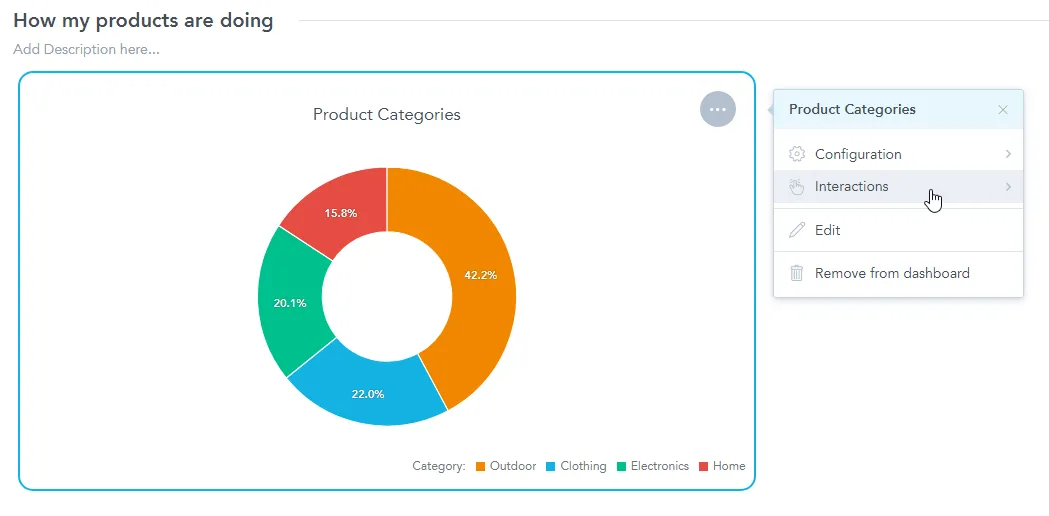
Edit your dashboard and click on the visualization that you want to set up a drill path for.
The options menu opens.
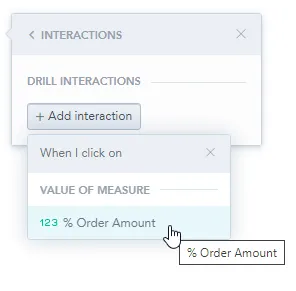
Select Interactions.
Click + Add interaction and select the metric you would like to drill in on.
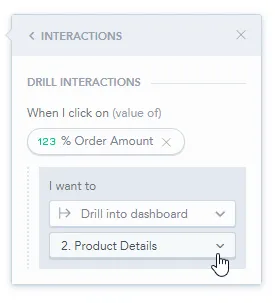
In the first dropdown menu, select Drill into dashboard.
In the second dropdown menu, select the target dashboard you would like to drill into.
Save & Publish your changes.
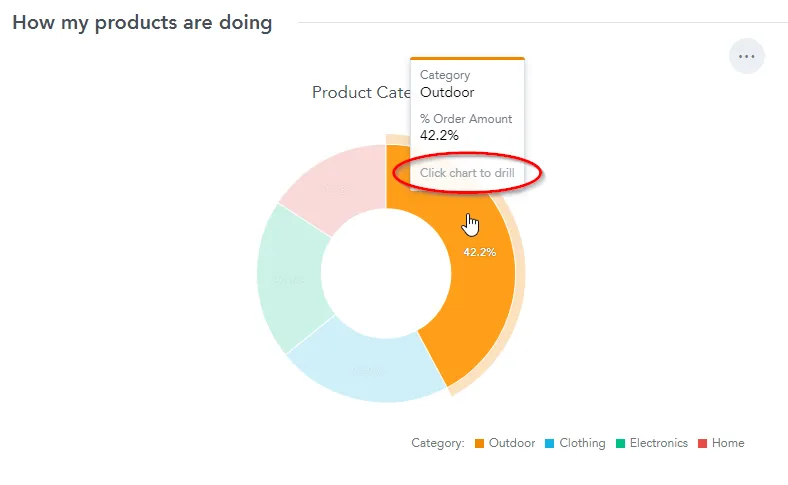
Notice that now if you hover over the visualization, you are able to click on a metric to drill in on it.
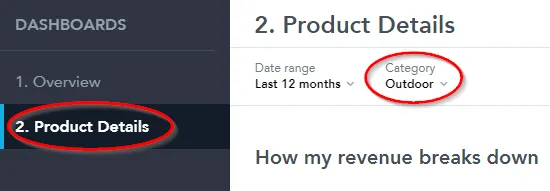
For example if you click on the
Outdoorsection of the pie chart shown on the previous image, you open theProduct detailsdashboard and in it you filter for theOutdoorcategory.
How the attribute and date filters interact
When drilling, the dashboards work with multiple filters: from the source dashboard, from the visualization, and from the target dashboard.
Attribute filters
The attribute filters from the source dashboard are applied during drilling with the following conditions:
The same attribute filter exists on the target dashboard
- The attribute is selected in the Filter by section of the widget configuration on the source dashboard
- If the visualization on the source dashboard uses attributes to break down measures, the intersection attribute values are used to filter the target dashboard. The same conditions apply.
The visualization attribute filters have higher priority than the global attribute filters on the source dashboard.
Single Value Attribute Filter Limitation
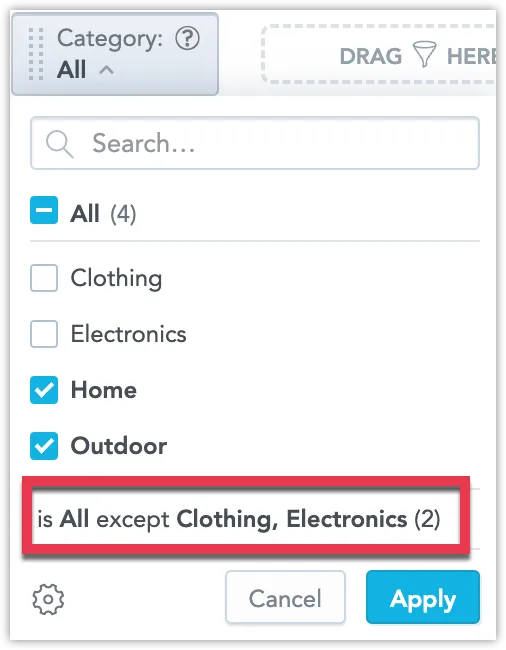
There is a limitation when drilling to a dashboard with single value filter from a dashboard using multiple a value filter. You need to be aware that depending on if your multiple value filter uses the positive is filter, or negative is All except filter, the way the dashboard with the single value filter is filtered changes.
Suppose you have two dashboards:
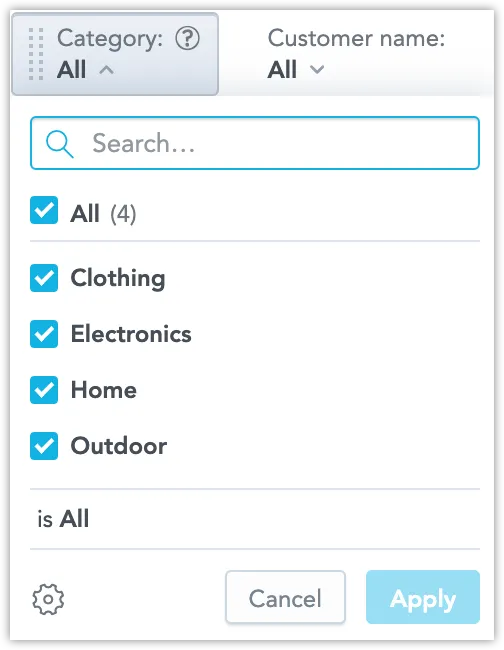
A Multiple Value Dashboard that has a multiple value filter.:
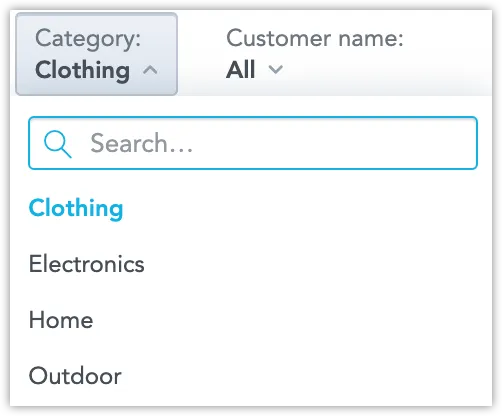
A Single Value Dashboard that has a single value filter set to “Clothing”:
Consider the following two scenarions:
Scenario 1:
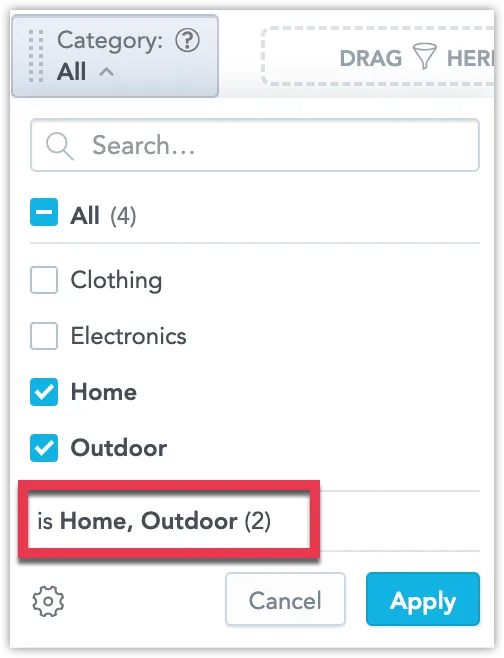
You are drilling from the Multiple Value Dashboard to the Single Value Dashboard with the filter set to
is Home, Outdoor:When the Single Value Dashboard opens, the first available attribute value will be selected. In this case that is going to be “Home”.
Scenario 2:
You are drilling from the Multiple Value Dashboard to the Single Value Dashboard with the filter set to
is All except Clothing, Electronics:When the Single Value Dashboard opens, the first available attribute value will be selected. In this case that is going to be “Clothing”.
Date filters
The date filters from the source dashboard are applied during drilling with the following conditions:
- The date filter can be configured on the target dashboard.
- The date attribute is selected in the Filter by section of the widget configuration on the source dashboard.
Note
The date filter from the source visualization is not transferred.
Troubleshooting
I cannot drill into a particular dashboard.
It is possible that a user could attempt to drill into a dashboard that they do not have a permission to. In such a case a message will be displayed informing the user that they are unable to access the dashboard.
Ensure you have shared all the dashboards you might be drilling into with the users of you current dashboard.
