Create Alerts in Dashboards
In dashboards, you can set up alerts to monitor key metrics and receive notifications when specific conditions are met. Alerts are triggered by changes in metric values, allowing you to stay informed about important updates without the need for constant monitoring.
Admin Setup Required
Before you can create alerts, your administrator must configure one or more destinations and ensure you have the necessary workspace permissions, as described in Automation in Dashboards.
SDK and Embedding
Alerts work with SDK version 10.12.0 or newer. Using these features with SDK version older than 10.12.0 may cause problems with embedding.
Delivery Methods
When an alert is triggered, the notification will be delivered based on the selected destination.
Notification Panel
Every workspace contains a notification panel that collects notifications generated by triggered alerts.
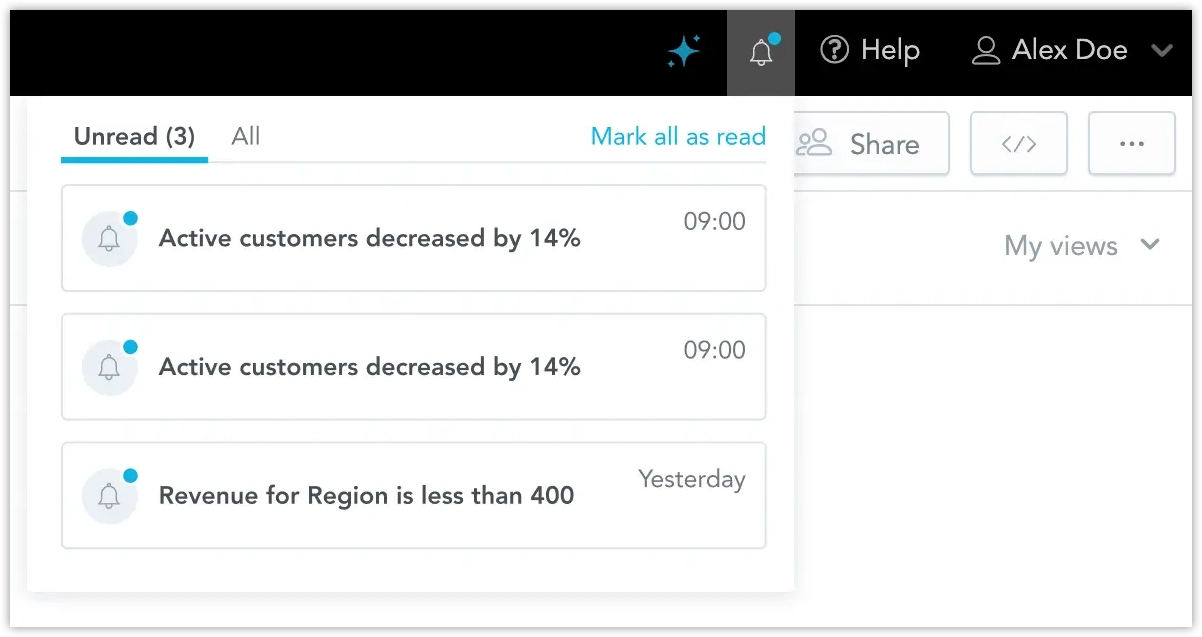
You can click individual notifications to navigate to the widget for which the corresponding alert was triggered. Notifications are user-specific, meaning each user only sees alerts relevant to their role and workspace permissions.
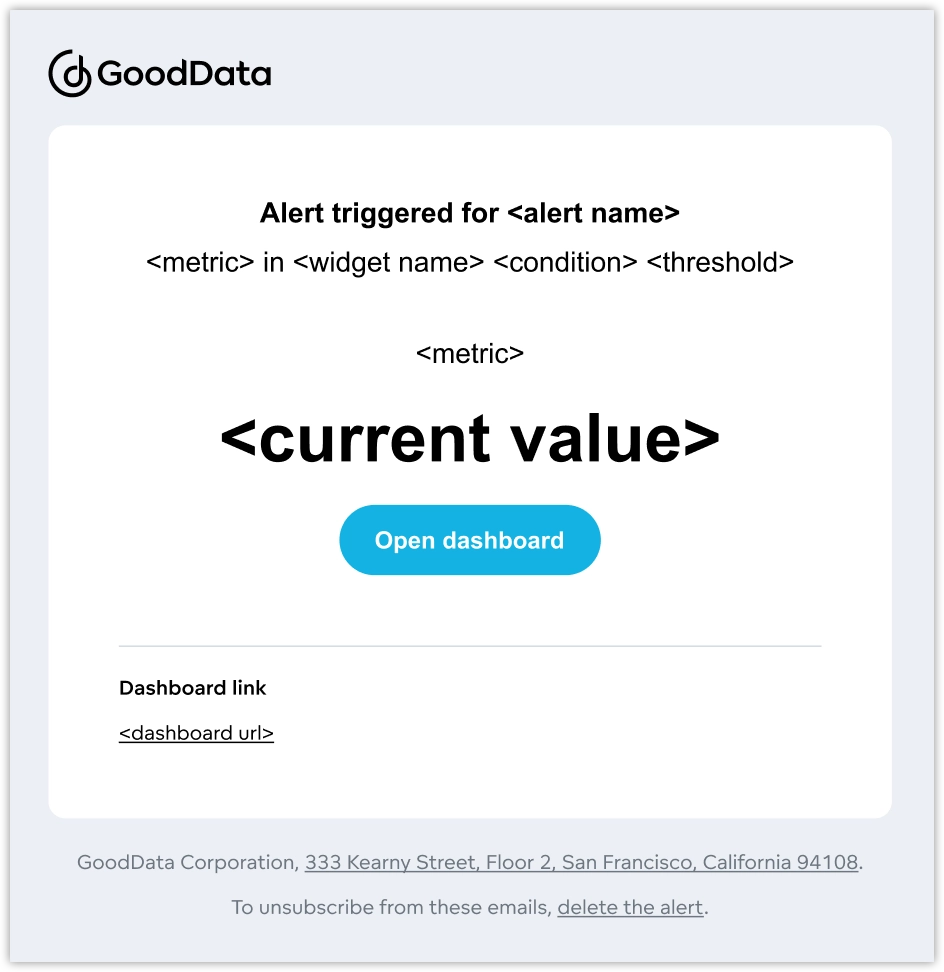
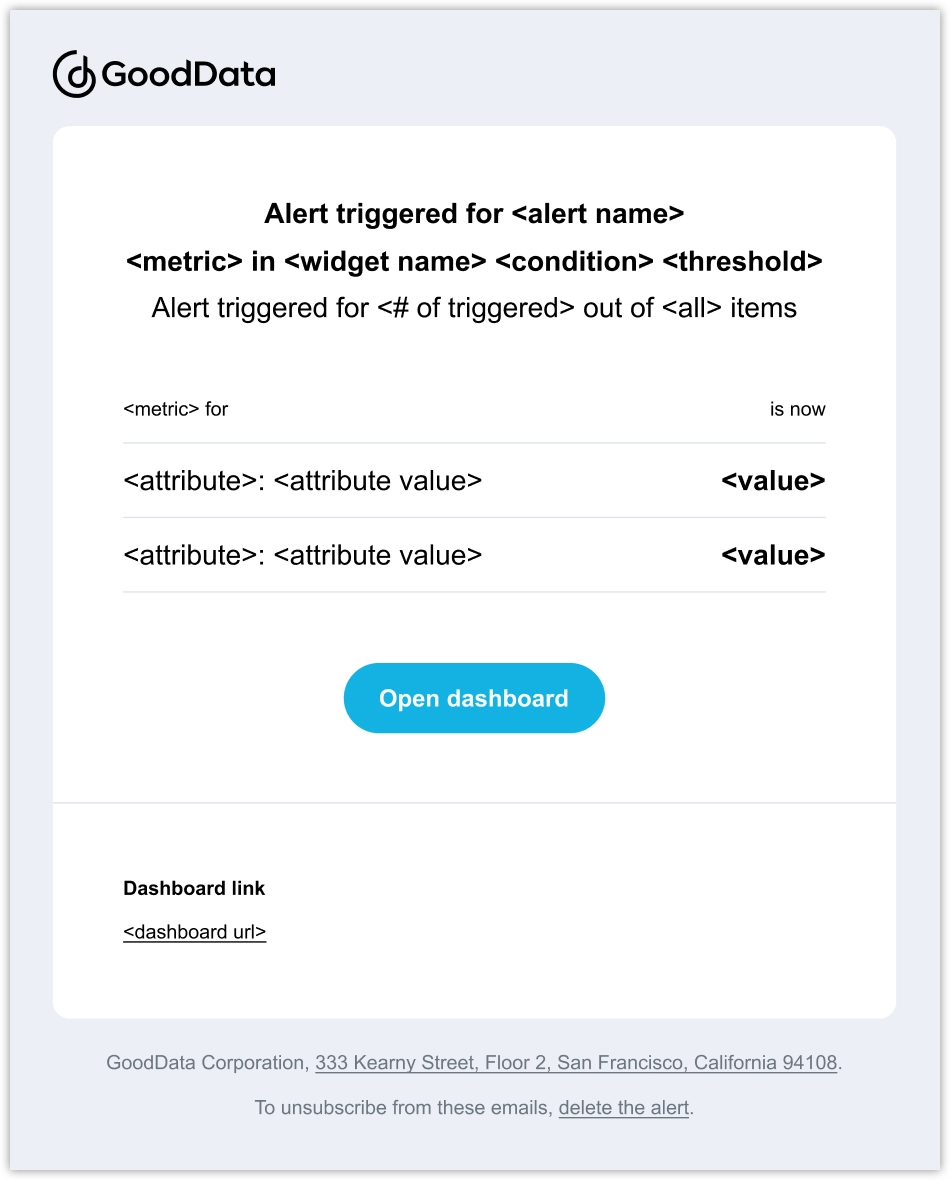
If an email destination is chosen, you’ll receive a structured email notification, and the format will vary based on the alert type.
If you create an alert for a visualization that only uses a metric, the email will appear as shown in this example:
If the visualization includes attributes to slice the metric and you select a specific attribute value to monitor, the email will follow this format:
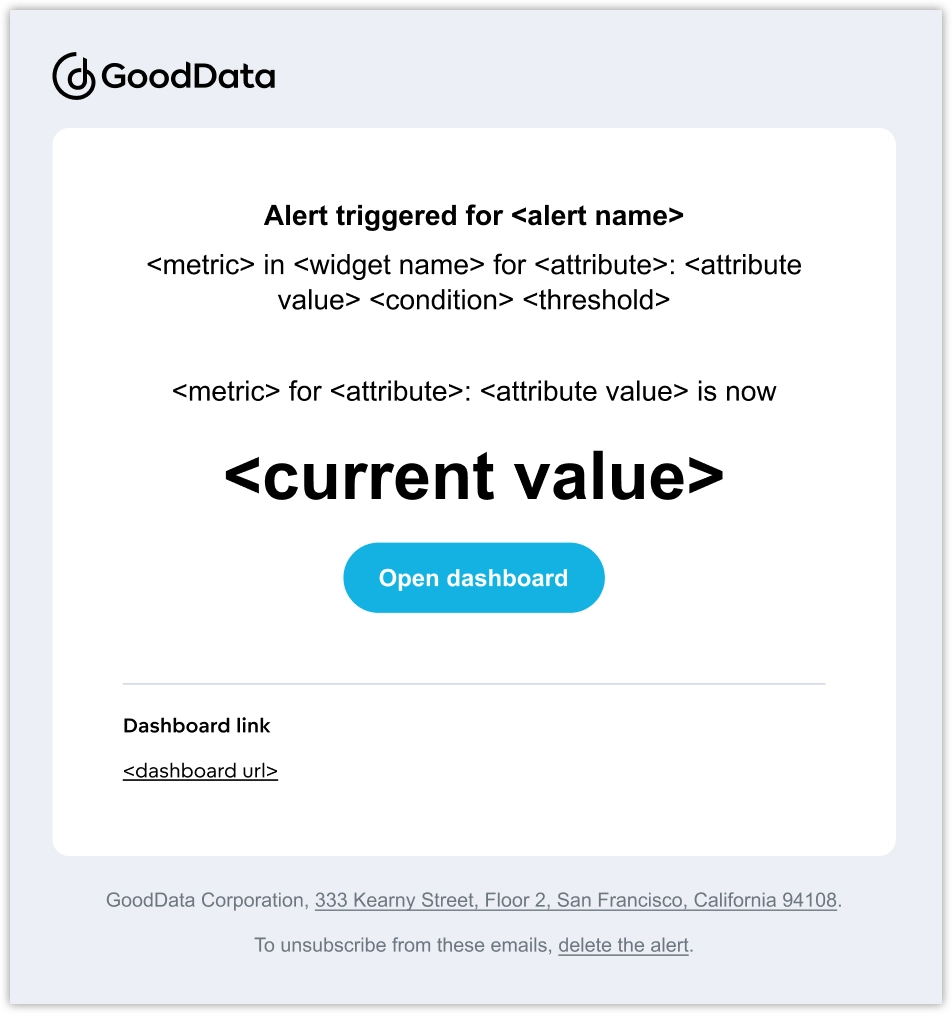
Alternatively, if you choose to monitor all attribute values, the email will look like this:
Custom Email Appearance
Your organization’s white-labeling and customization settings may alter the appearance of the email, as defined by your administrator. For more information, see Customize Emails.
Webhook
Alternatively, if a webhook destination is selected, a JSON payload will be sent to the webhook for further processing in external systems, managed by the administrator.
Create Alert
Note that some visualizations include attributes, while others do not. For widgets without attributes, you create a condition based solely on a specific metric value. For widgets that include attributes, you have two alert options:
- All attribute values: This triggers an alert whenever the metric, sliced by any attribute value, meets the condition.
- Specific attribute value: This triggers an alert only when the condition is met for the metric sliced by a chosen attribute value.
Follow the steps below to set up a new alert for a dashboard widget.
Steps:
Open a dashboard.
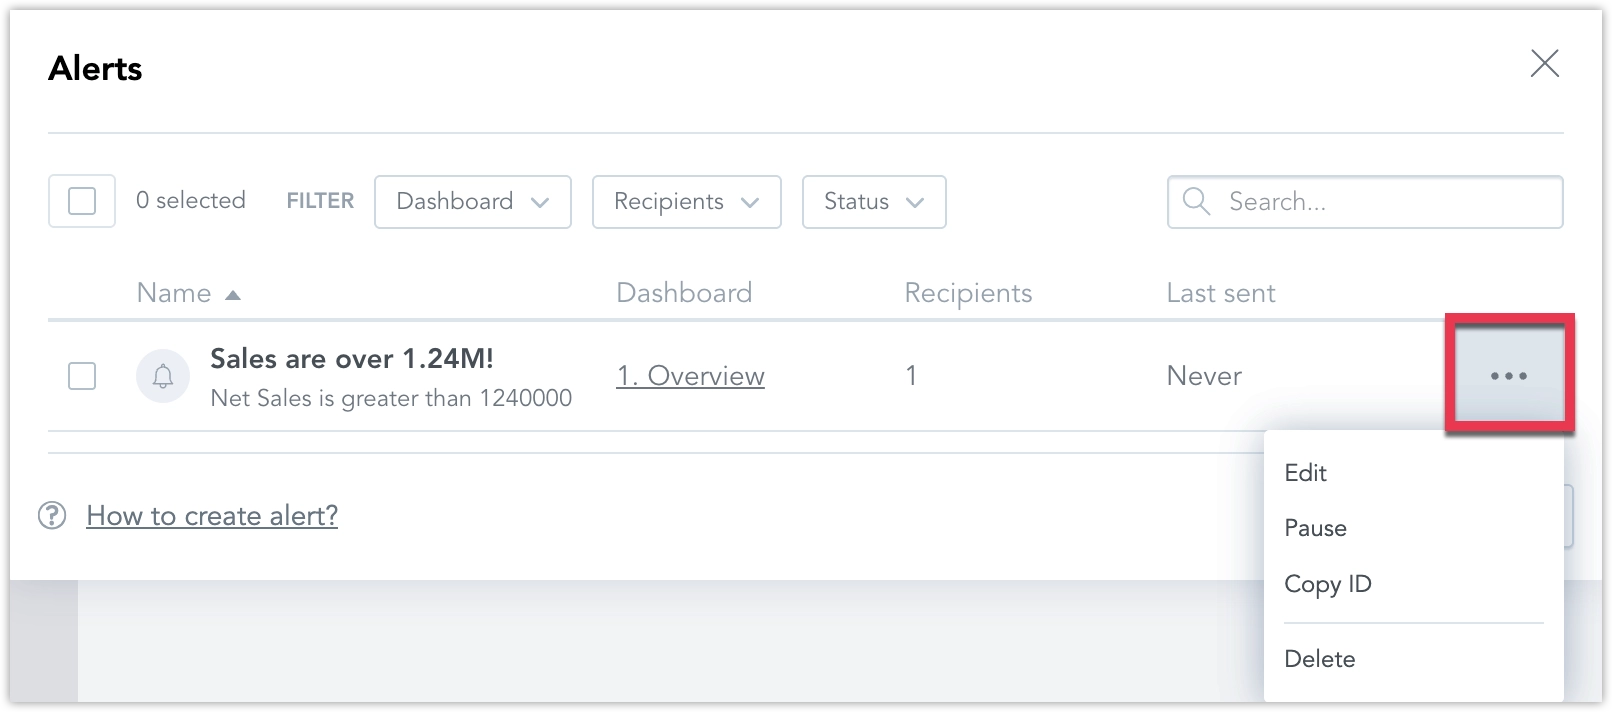
Hover over a widget, click the … (ellipsis) button and select Alerts.
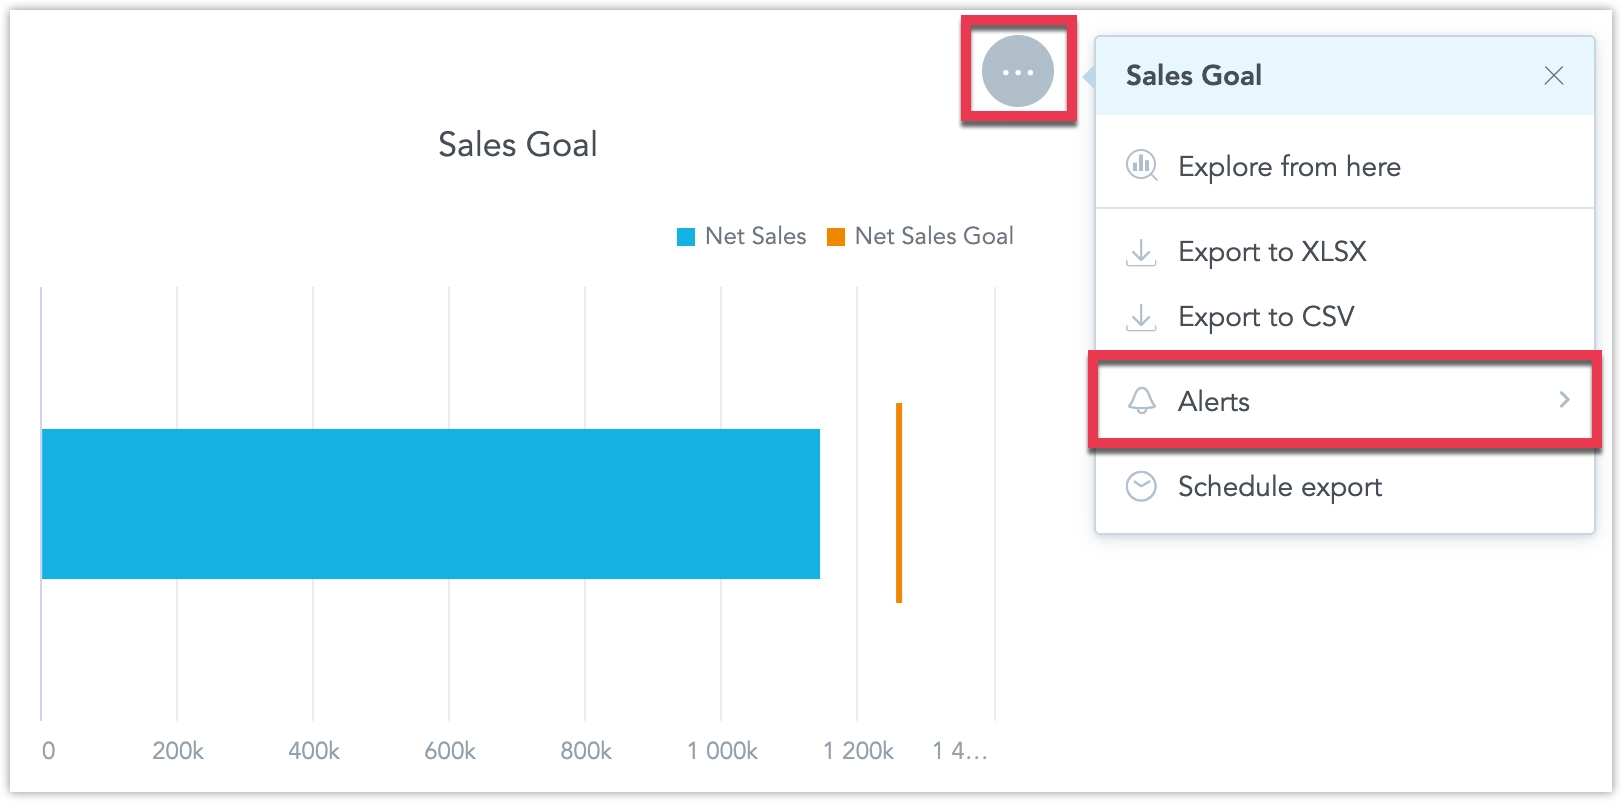
The alerts management dialog opens.
Click Create.
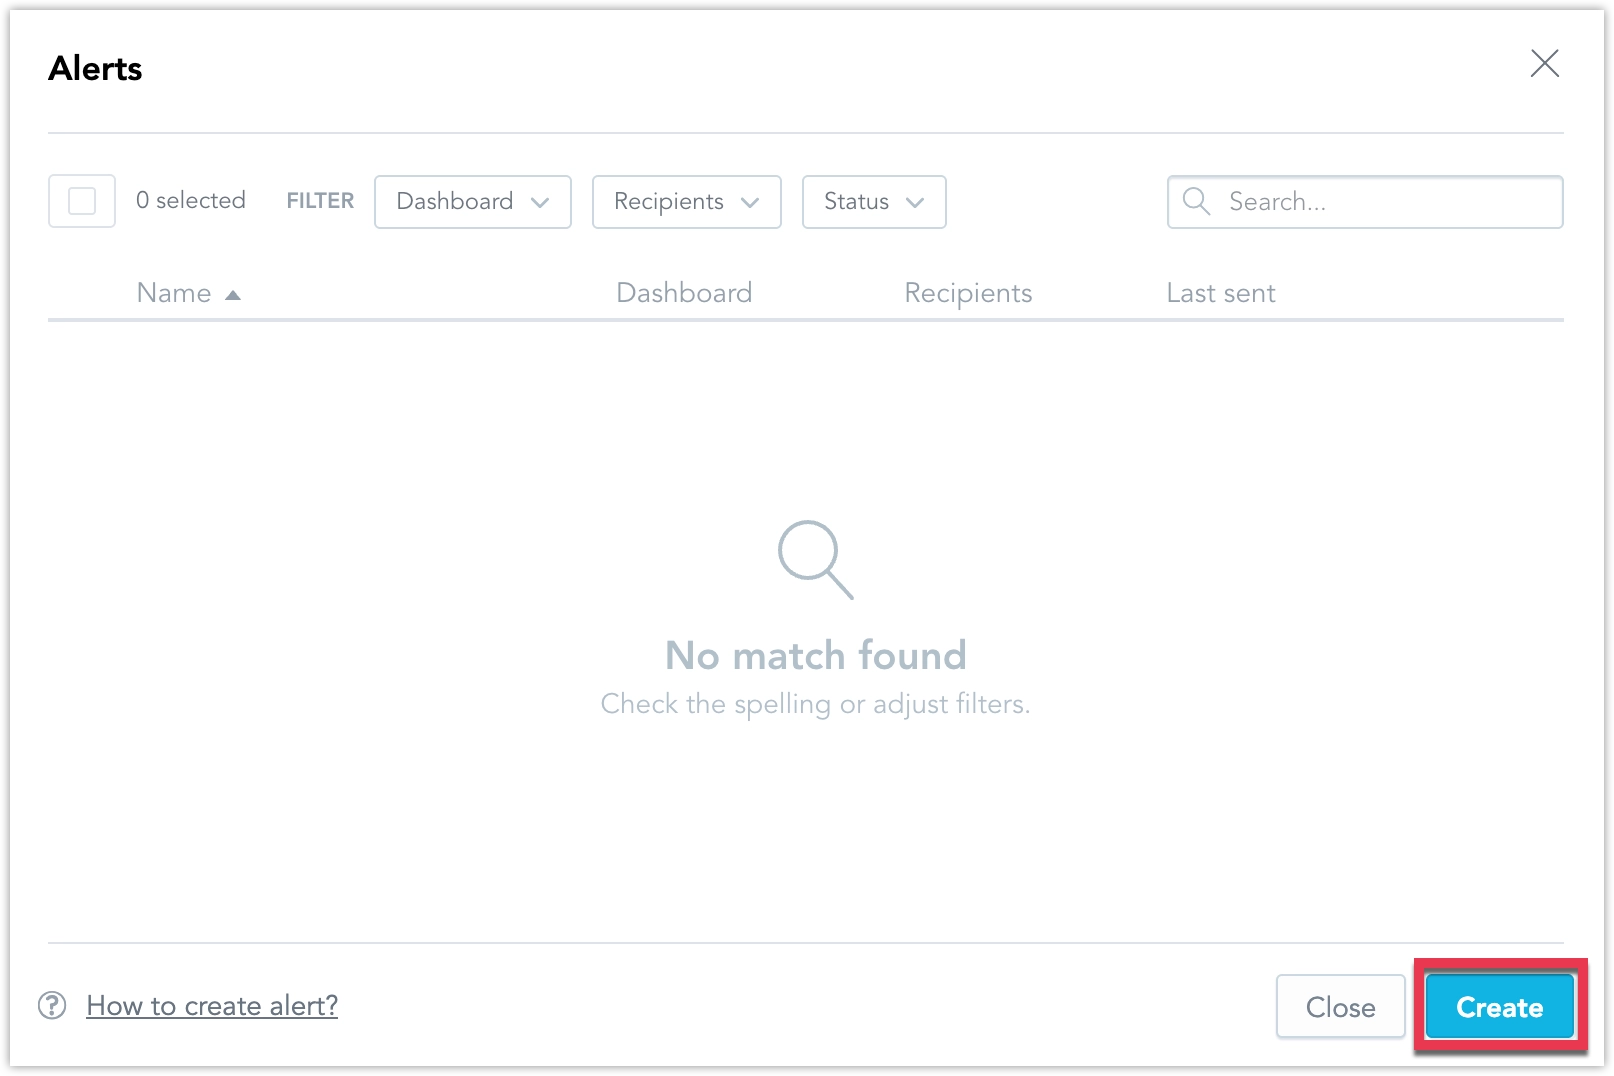
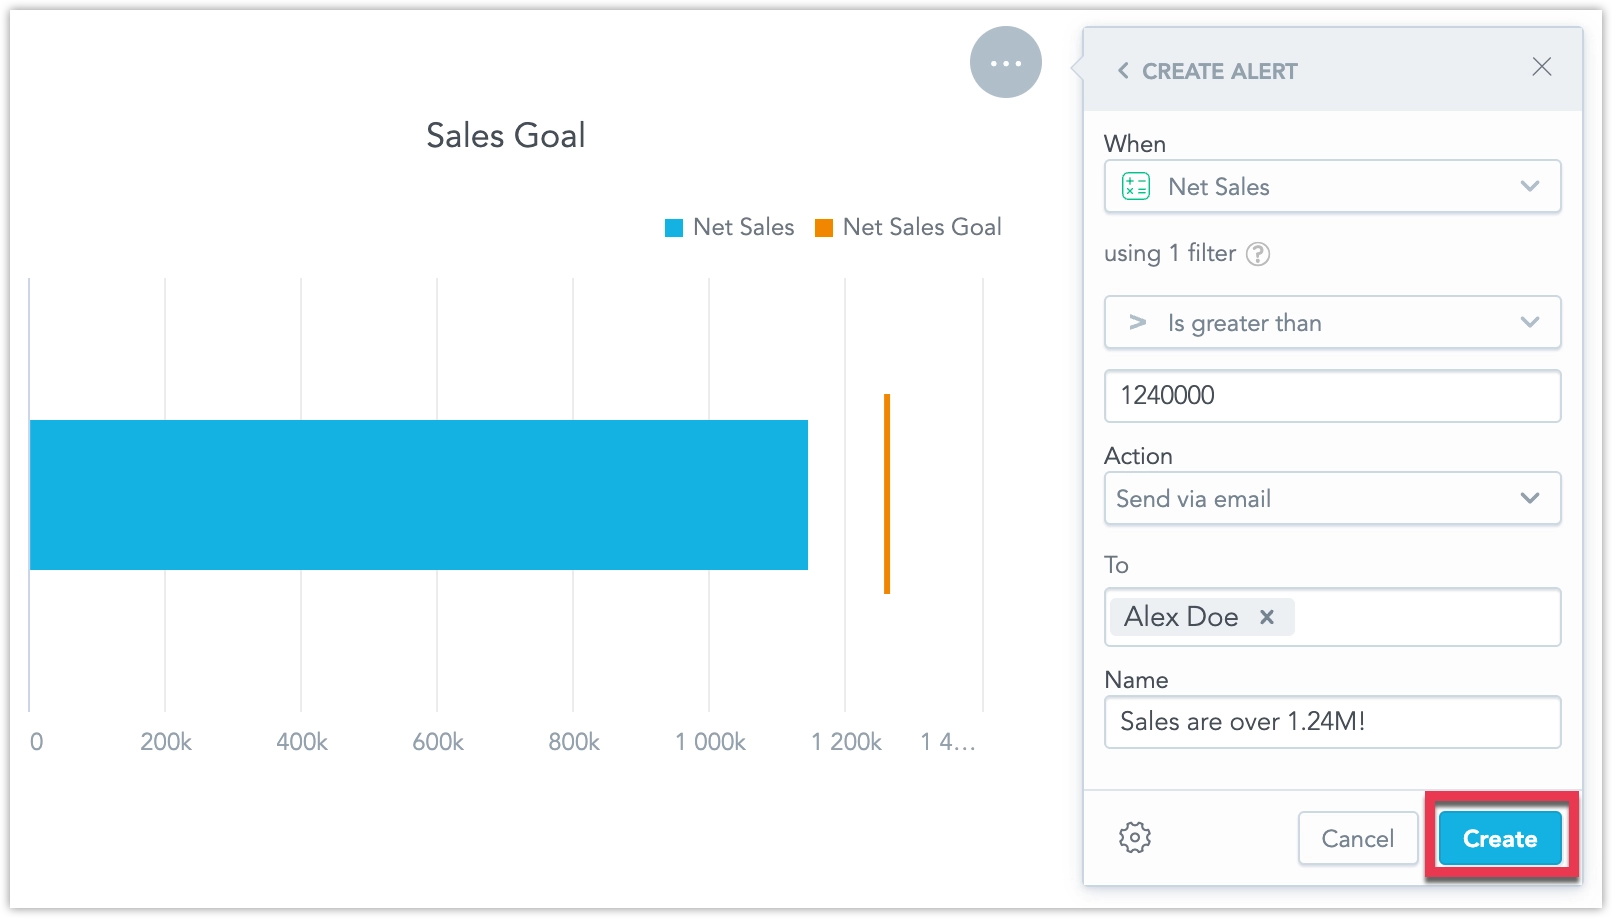
The alert creation dialog opens.
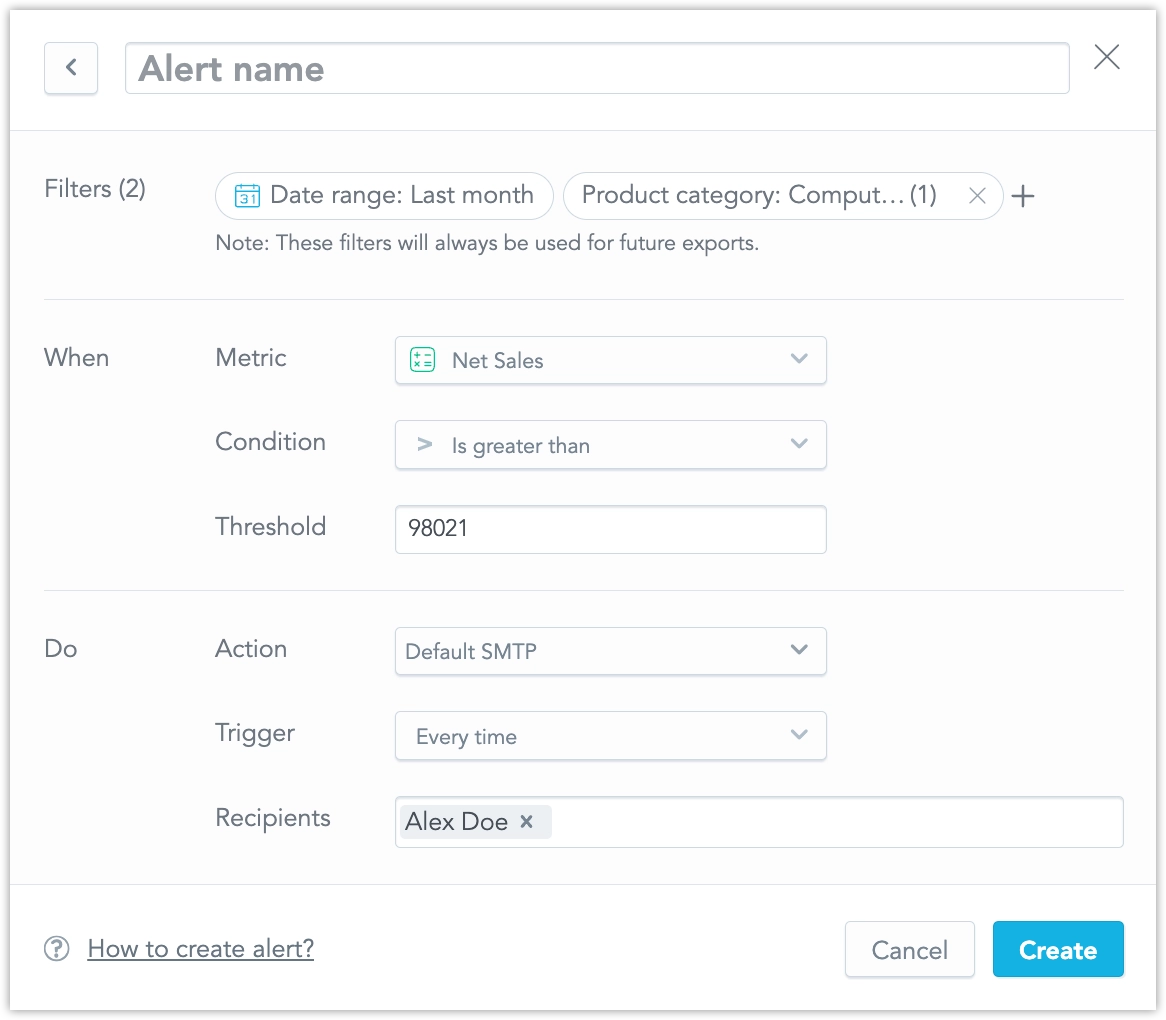
Configure the alert’s:
- filters - the active dashboard filters are used by default, you can change them, note that these will always be applied to this alert going forward, even if you change your default dashboard filters in the future
- metric to be monitored, and if sliced by an attribute, also its attribute value
- condition when the alert should be triggered
- destination
- recipients of the alert
- display name
You can click the cogwheel button to configure the Trigger setting: The trigger can be set to send the alert every time alerts are evaluated, assuming the conditions are met, or trigger just once, after which the alert becomes paused.
Once configured, click Create.
Optionally you can then edit, delete, pause, or unpause the alert in the alerts dialog:
To create and manage alerts via the API, you can call the API endpoint /api/v1/entities/workspaces/<workspaceId>/automations using POST, GET, PATCH, DELETE, and PUT methods.
To create a new alert make the following API call:
curl $HOST_URL/api/v1/entities/workspaces/<workspace_id>/automations \
  -H "Content-Type: application/vnd.gooddata.api+json" \
  -H "Accept: application/vnd.gooddata.api+json" \
  -H "Authorization: Bearer $API_TOKEN" \
  -X POST \
  -d '{
    "data": {
      "type": "automation",
      "id": "<alert_id>",
      "attributes": {
        "title": "<alert_display_name>",
        "details": {
          "widgetName": "<widget_display_name>"
        },
        "state": "ACTIVE",
        "metadata": {
          "widget": "<widget_id>"
        },
        "alert": {
          "condition": {
            "comparison": {
              "operator": "<comparison_operator>",
              "left": {
                "localIdentifier": "<metric_id>",
                "title": "<metric_display_name>",
                "format": "<metric_format>"
              },
              "right": {
                "value": <value_to_compare_to>
              }
            }
          },
          "execution": {
            "filters": [
              {
                "relativeDateFilter": {
                  "dataset": {
                    "identifier": {
                      "id": "<date_dataset_id>",
                      "type": "dataset"
                    }
                  },
                  "granularity": "<granularity>",
                  "from": <relative_date_from>,
                  "to": <relative_date_to>
                }
              },
              {
                "positiveAttributeFilter": {
                  "label": {
                    "localIdentifier": "<attribute_id>"
                  },
                  "in": {
                    "values": [
                      "<attribute_value>"
                    ]
                  }
                }
              }
            ],
            "measures": [
              {
                "localIdentifier": "<metric_id>",
                "definition": {
                  "measure": {
                    "item": {
                      "identifier": {
                        "id": "<metric_id>",
                        "type": "fact"
                      }
                    },
                    "aggregation": "<aggregation_type>"
                  }
                }
              }
            ],
            "auxMeasures": [],
            "attributes": [
              {
                "label": {
                  "identifier": {
                    "id": "<attribute_id>",
                    "type": "label"
                  }
                },
                "localIdentifier": "<attribute_id>"
              }
            ]
          }
        }
      },
      "relationships": {
        "recipients": {
          "data": [
            {
              "type": "user",
              "id": "<user_id>"
            }
          ]
        },
        "notificationChannel": {
          "data": {
            "type": "notificationChannel",
            "id": "<destination_id>"
          }
        },
        "analyticalDashboard": {
          "data": {
            "type": "analyticalDashboard",
            "id": "<dashboard_id>"
          }
        }
      }
    }
  }'
a real-life example might look like this:
curl https://frosty-cat.trial.cloud.gooddata.com/api/v1/entities/workspaces/e45864d8057f40a09957ba1bdd3b5139/automations \
  -H "Content-Type: application/vnd.gooddata.api+json" \
  -H "Accept: application/vnd.gooddata.api+json" \
  -H "Authorization: Bearer ZWRtaG46Ym9vdHN1cmFwOkdkG05hczUaKm==" \
  -X POST \
  -d '{
    "data": {
      "type": "automation",
      "id": "f7d38bc0-dce7-4a97-9121-f41e09d49824",
      "attributes": {
        "title": "Sum of Price",
        "details": {
          "widgetName": "L1"
        },
        "state": "ACTIVE",
        "metadata": {
          "widget": "71b8d924-2d3c-4ba0-ba94-cdc01b8d93a5"
        },
        "alert": {
          "condition": {
            "comparison": {
              "operator": "GREATER_THAN",
              "left": {
                "localIdentifier": "9e734dc8f3b94e43a917e141e1d4a77d",
                "title": "Sum of Price",
                "format": "#,##0.00"
              },
              "right": {
                "value": 50000
              }
            }
          },
          "execution": {
            "filters": [
              {
                "relativeDateFilter": {
                  "dataset": {
                    "identifier": {
                      "id": "date",
                      "type": "dataset"
                    }
                  },
                  "granularity": "MONTH",
                  "from": -12,
                  "to": -12
                }
              },
              {
                "positiveAttributeFilter": {
                  "label": {
                    "localIdentifier": "476dded1390e4a70b8a68cca12752d03"
                  },
                  "in": {
                    "values": [
                      "Northeast"
                    ]
                  }
                }
              }
            ],
            "measures": [
              {
                "localIdentifier": "9e734dc8f3b94e43a917e141e1d4a77d",
                "definition": {
                  "measure": {
                    "item": {
                      "identifier": {
                        "id": "price",
                        "type": "fact"
                      }
                    },
                    "aggregation": "SUM"
                  }
                }
              }
            ],
            "auxMeasures": [],
            "attributes": [
              {
                "label": {
                  "identifier": {
                    "id": "region",
                    "type": "label"
                  }
                },
                "localIdentifier": "476dded1390e4a70b8a68cca12752d03"
              }
            ]
          }
        }
      },
      "relationships": {
        "recipients": {
          "data": [
            {
              "type": "user",
              "id": "alex.doe"
            }
          ]
        },
        "notificationChannel": {
          "data": {
            "type": "notificationChannel",
            "id": "92684672-0efc-4845-aaa4-f7eaaac2682f"
          }
        },
        "analyticalDashboard": {
          "data": {
            "type": "analyticalDashboard",
            "id": "53258179-00e1-46d5-a6a5-347e91309624"
          }
        }
      }
    }
  }'
Period Comparison
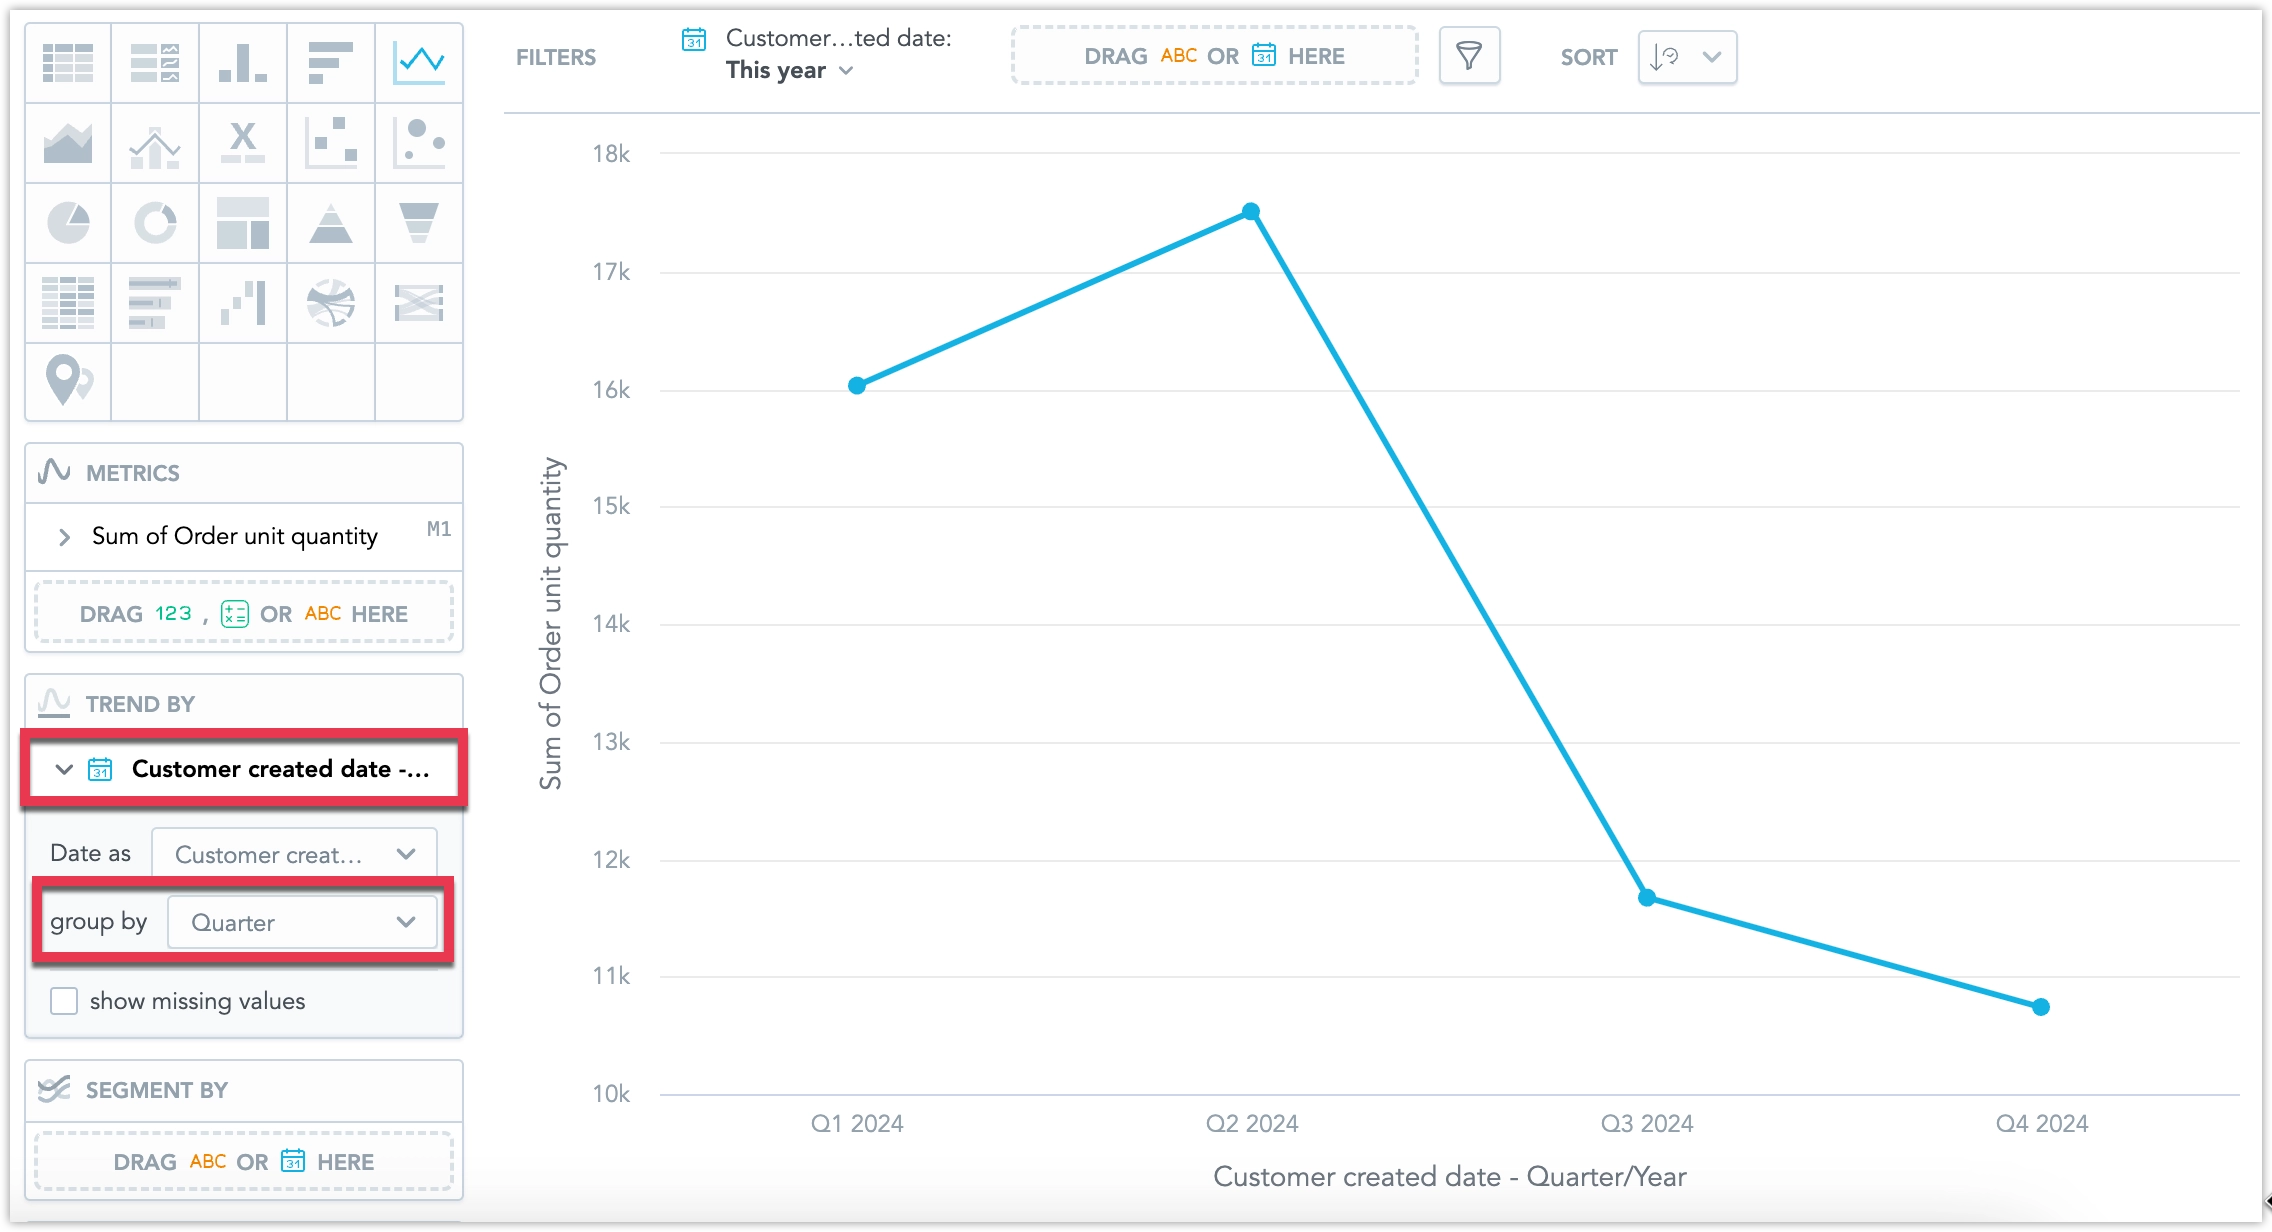
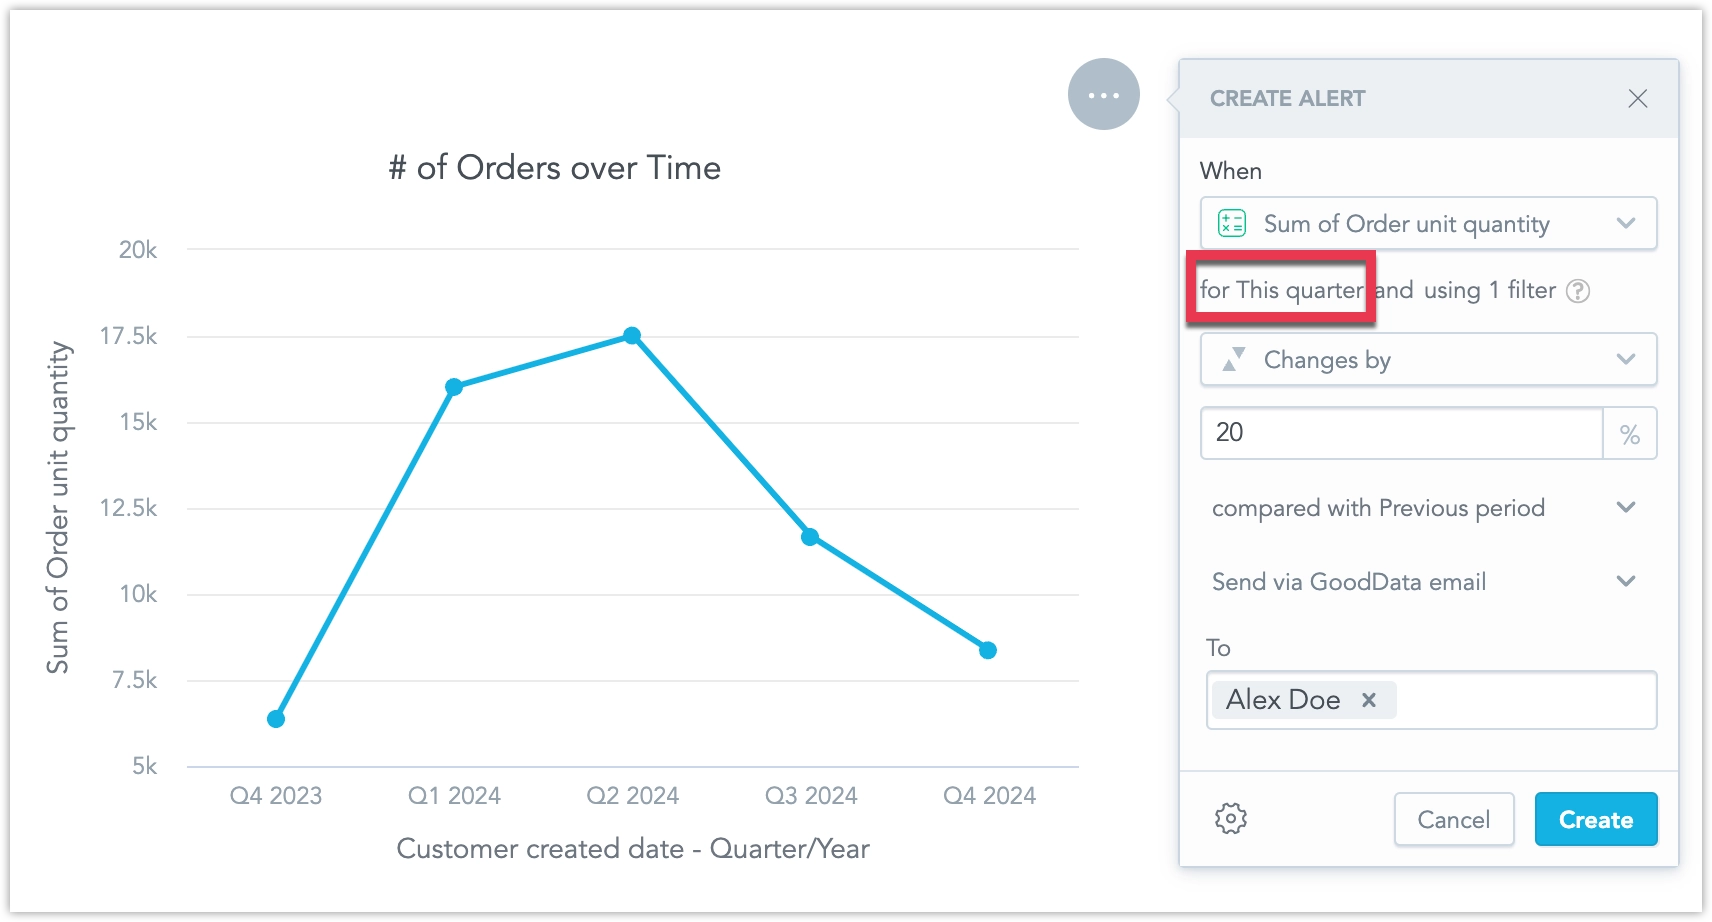
You can create alerts that monitor changes in a metric’s value by comparing it to a previous period. For instance, if you have a line chart sliced by a date attribute, grouped into a specific time period, such as a Quarter:
When setting up an alert for a dashboard widget based on this visualization, additional comparison options will be available:
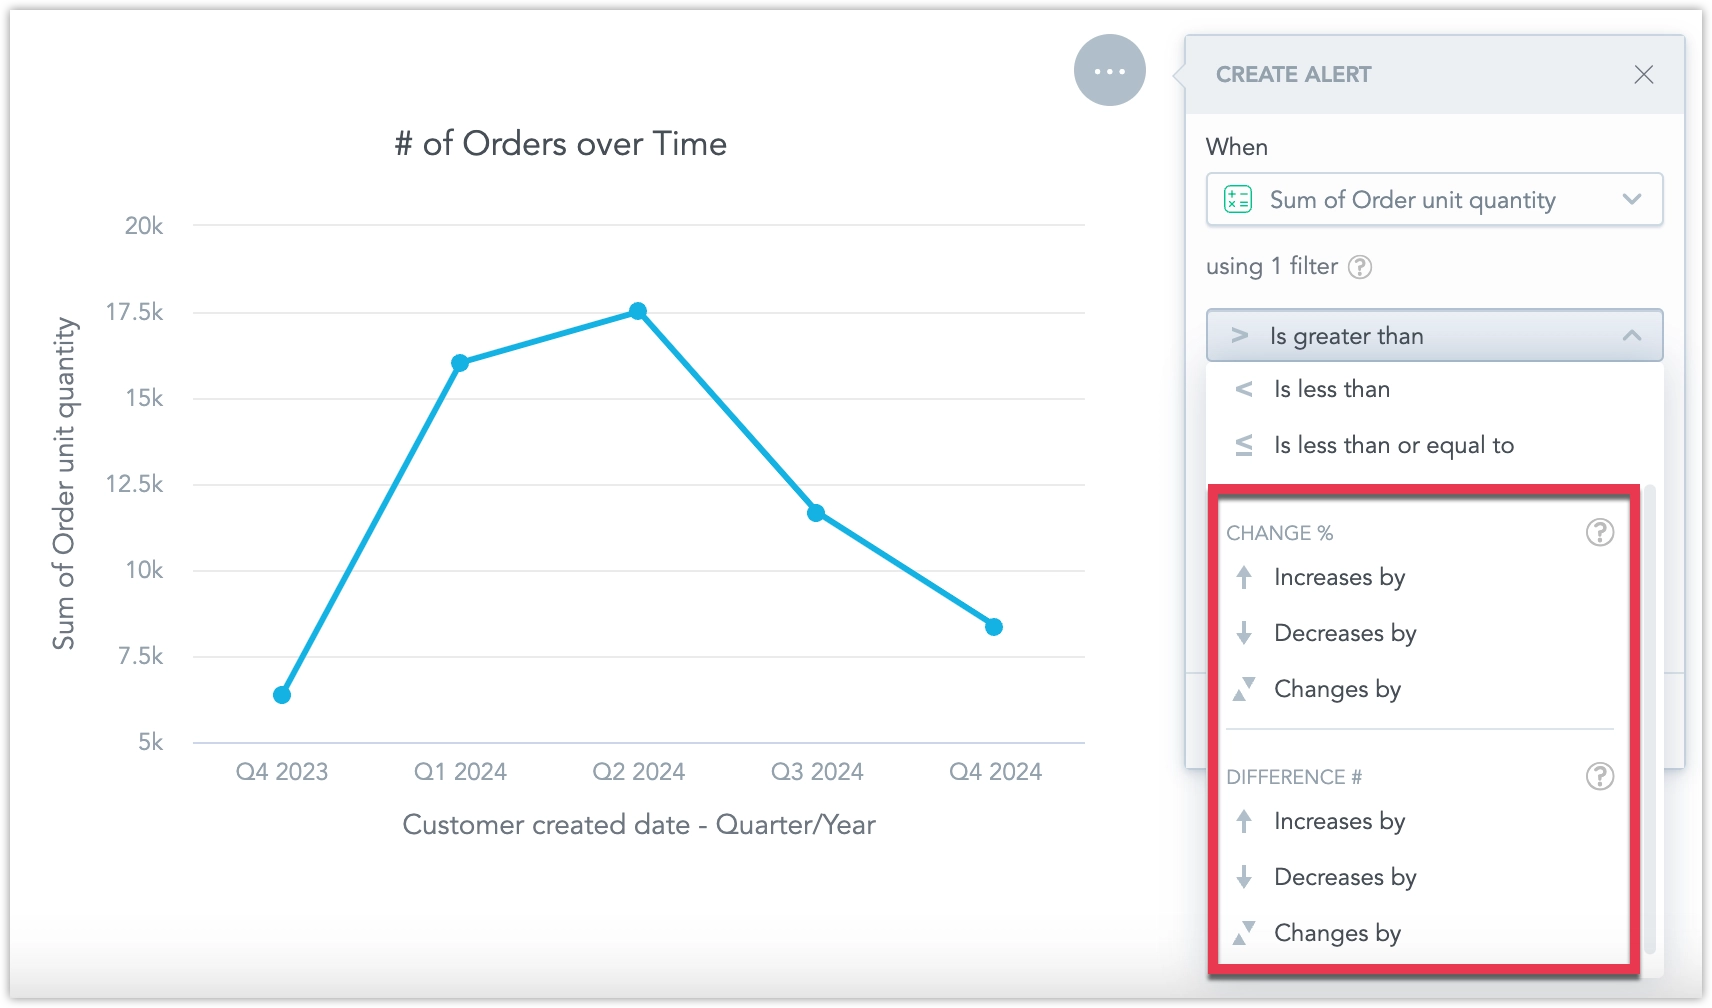
You can select either a relative (percentage) or an absolute (numeric) comparison of the metric’s value in the current period against the previous one. There’s also an option to compare the current period against the same period in the previous year, which is useful for observing seasonal trends:
The following types of visualizations support period comparison alerts:
- Line chart
- Column chart
- Bar chart
- Repeater
- Combo chart
- Bullet chart
- Bubble chart
- Pie chart
- Donut chart
- Waterfall chart
- Pyramid chart
- Funnel chart
- Pivot table
- Stacked area chart
Visualization Configuration Requirement
When creating or editing visualizations in Analytical Designer, ensure any date filters do not exclude the current period. If the current period is filtered out, a comparison alert cannot be created for the visualization.
Filters
When creating an alert, the active dashboard filters are saved as part of the alert, and the alert will be displayed and triggered based on those filters.
Evaluation Frequency
The evaluation frequency determines how often GoodData checks whether any alerts are triggered. By default, all newly created alerts inherit the evaluation frequency from your organization’s settings, configured by your administrator.
You can override this default for a specific dashboard so that any new alerts you create on that dashboard use a custom schedule. If your data changes often, you may want a shorter evaluation period so alerts are triggered soon after the data updates. Conversely, if your data changes infrequently, you can use a longer period to conserve computational resources.
Steps:
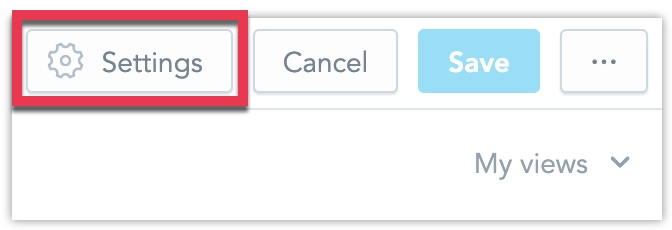
Edit a dashboard and open Settings.
Under Alerts > Evaluation frequency, select how often you want GoodData to check if alerts on this dashboard meet the criteria for being triggered.
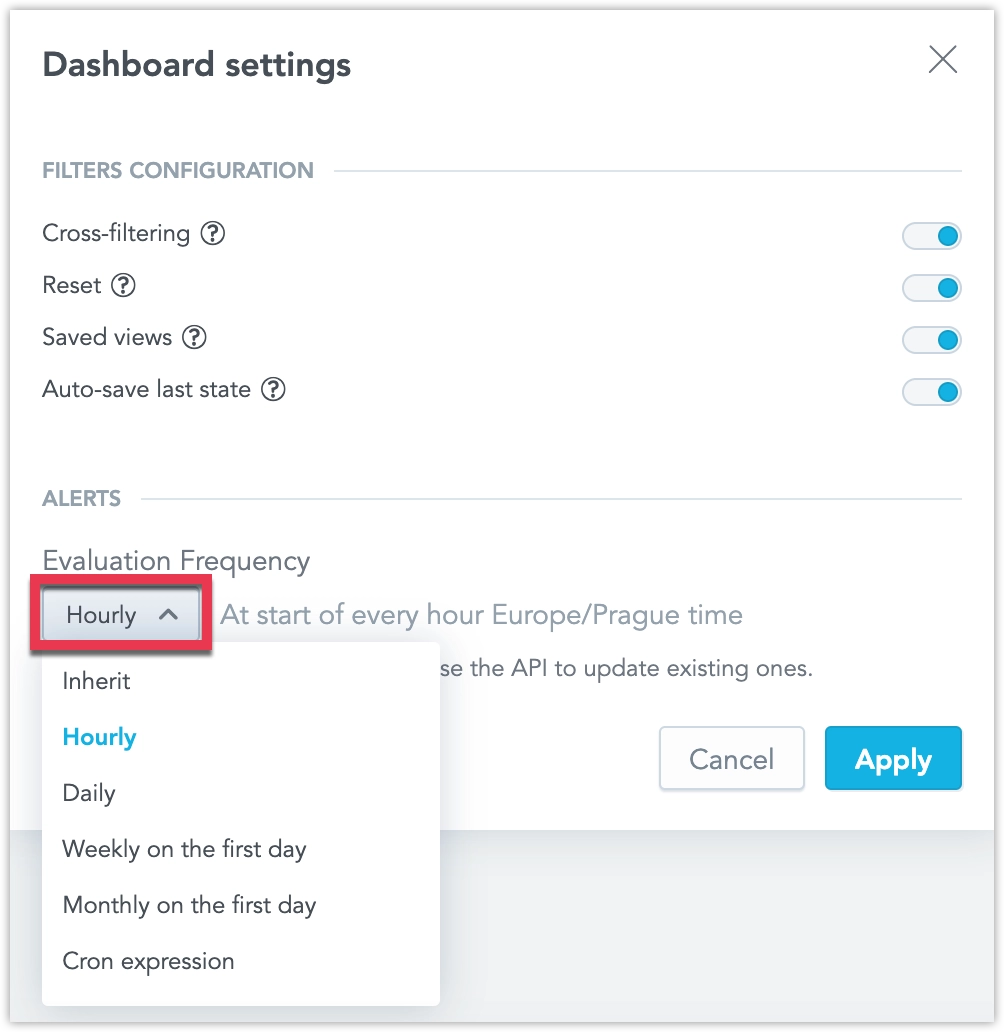
You can use a cron expression to define a custom evaluation frequency. Note that GoodData supports triggering alerts at most once per hour, and your custom evaluation frequency cannot use a shorter time interval than the organization-wide evaluation frequency set by the administrator.
Click Apply.
All newly created alerts on this dashboard will now use this evaluation frequency.
To change the evaluation frequency for existing alerts, or to assign different frequencies to individual alerts on the same dashboard, use the API so that the alert’s automation object includes the schedule attribute:
"schedule": {
    "cron": "<cron_expression>",
    "timezone": "<timezone>"
}
For example, the following PATCH API request updates an existing alert with a custom evaluation frequency that instructs GoodData to evaluate the alert every Monday at 00:00:
curl $HOST_URL/api/v1/entities/workspaces/<workspace_id>/automations/<automation_id> \
-X PATCH \
-H "Authorization: Bearer $API_TOKEN" \
-H "Content-Type: application/vnd.gooddata.api+json" \
-d '{
"data": {
"id": "f4e7dfd9-83de-4d7a-87aa-e5dfa64082fe",
"type": "automation",
"attributes": {
"title": "Net sales are greater than 70 mil",
"details": {
"widgetName": "Net Sales"
},
"metadata": {
"widget": "f8a10155-ca77-4756-8da1-00ab3fad7d41"
},
"schedule": {
"cron": "0 0 0 ? * MON",
"timezone": "Europe/Prague"
},
"state": "ACTIVE",
"alert": {
"execution": {
"attributes": [],
"filters": [
{
"relativeDateFilter": {
"dataset": {
"identifier": {
"id": "date",
"type": "dataset"
}
},
"granularity": "MONTH",
"from": -1,
"to": -1
}
}
],
"measures": [
{
"localIdentifier": "759c22e84d114c55aa40707b16d79d1d",
"definition": {
"measure": {
"item": {
"identifier": {
"id": "net_sales",
"type": "metric"
}
},
"computeRatio": false,
"filters": []
}
}
}
],
"auxMeasures": []
},
"condition": {
"comparison": {
"operator": "GREATER_THAN",
"left": {
"localIdentifier": "759c22e84d114c55aa40707b16d79d1d",
"format": "[>=1000000000000]$#,,,,.0 T;\n[>=1000000000]$#,,,.0 B;\n[>=1000000]$#,,.0 M;\n[>=1000]$#,.0 K;\n[>=0]$#,##0;\n[<=-1000000000000]-$#,,,,.0 T;\n[<=-1000000000]-$#,,,.0 B;\n[<=-1000000]-$#,,.0 M;\n[<=-1000]-$#,.0 K;\n[<0]-$#,##0",
"title": "Net Sales"
},
"right": {
"value": 70000000
}
}
},
"trigger": "ALWAYS"
}
}
}
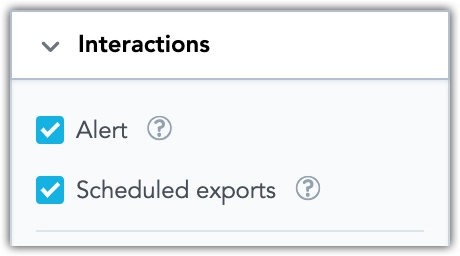
}'Disabling
You can disable the ability to create new alerts for a specific visualization by editing it in the Analytical Designer. To do this, go to the Interactions tab while editing the visualization: