Automation in Dashboards
Dashboards support automation of key actions, making it easier to streamline your workflow:
- Create alerts on dashboard widgets to monitor metric changes and trigger notifications when thresholds are reached.
- Schedule exports of dashboards at regular intervals, allowing users to receive updated reports automatically.
Both alerts and scheduled exports offer flexible delivery options, including email notifications and JSON payloads to webhooks, enabling seamless integration with external systems like workflow automation tools or notification platforms. This allows users to automate monitoring and reporting, ensuring that key stakeholders stay updated without needing to manually track dashboards.
An an administrator, follow the rest of this article, and ensure that you:
Configure one or more destinations:
For webhook destinations, you are responsible for processing the webhook’s JSON payload once it’s sent from GoodData.
For email destinations, consider reviewing the email customization options.
For alerts, make sure to configure the desired evaluation frequency.
Give users the workspace automation permission.
For dashboard users, see Create Alerts and Schedule Exports articles on how you can use these features, once the administrator has set things up.
Create Destinations
As an administrator, you need to set up destinations to enable users to create alerts and scheduled exports. A destination is a delivery channel that send alert notification to the notification panel, a webhook endpoint or an SMTP mail server.
Note that the name of the destination is what the dashboard user is going to see when they are creating alerts or scheduled exports, so ensure the name you choose is going to be meaningful to them.
Recipients
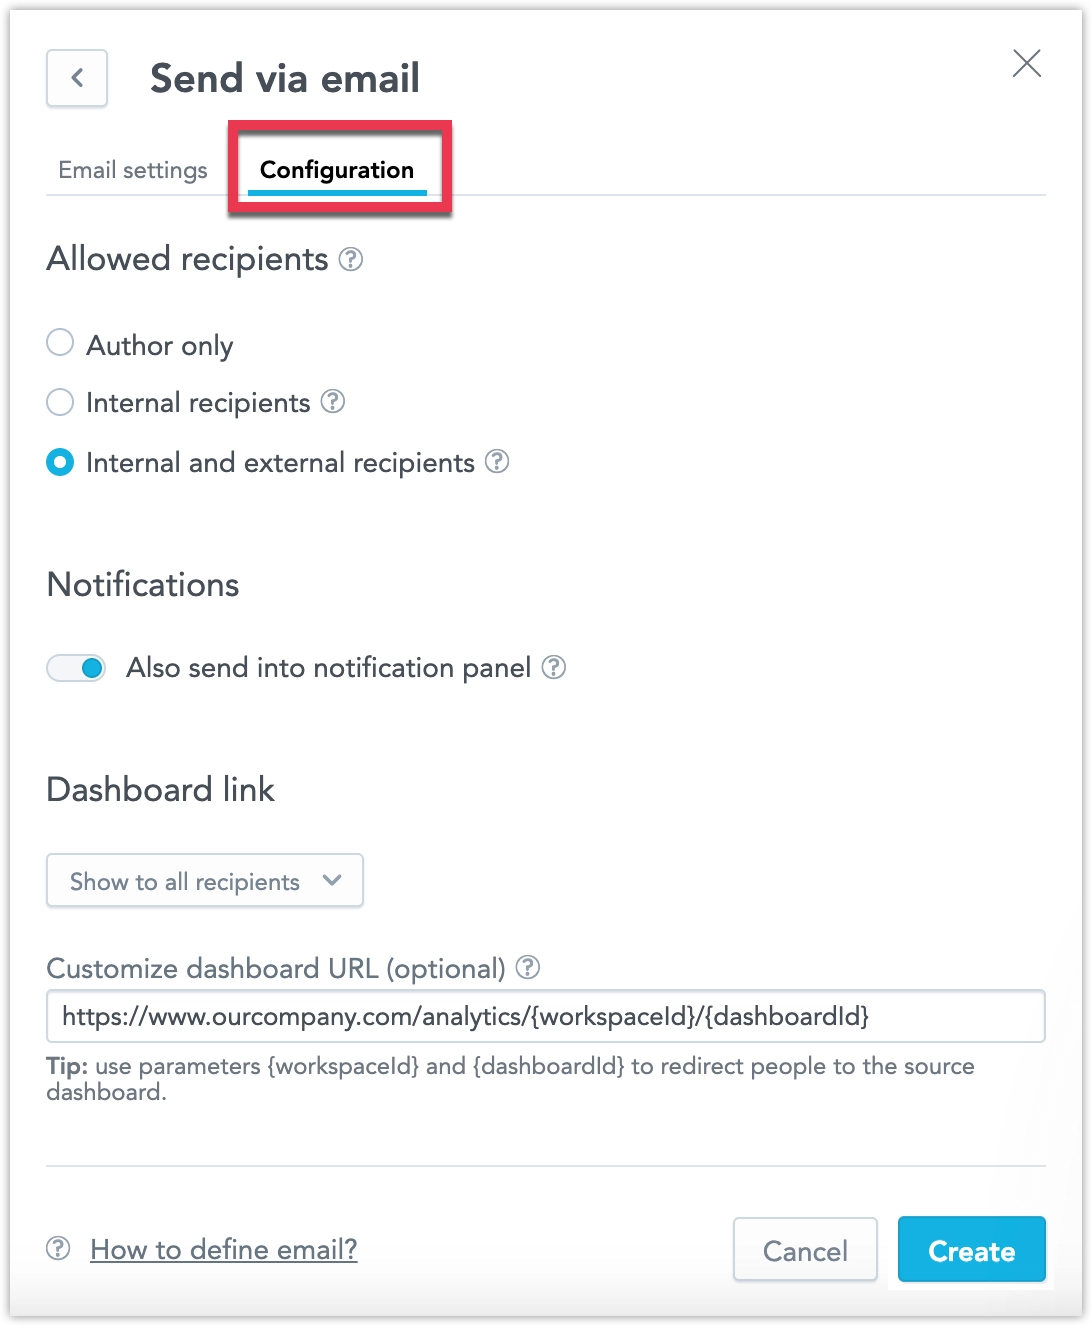
All destinations (email, webhook, or notification panel) can specify who can receive an alert or scheduled export. When you create or edit a destination, you will see a section that lets you choose one of these options:
- Author only: Only the automation creator (the person who sets up the alert or scheduled export).
- Internal recipients: Any member of the workspace.
- External recipients: Any member of your organization as well as any external email addresses. This option is only available for email destinations, and is disabled for Trial accounts for security reasons.
When creating an email destination, you can choose between:
- Default SMTP server: Uses GoodData’s built-in email service
- Custom SMTP server: Configure your own SMTP server for delivery
You can also white-label the sender’s name and email address.
When a user creates an alert or scheduled export using an email destination, the selected SMTP server sends the email to the user’s email address as defined in user management.
Steps:
Go to Settings and navigate down to the Alerts & Scheduled exports section.
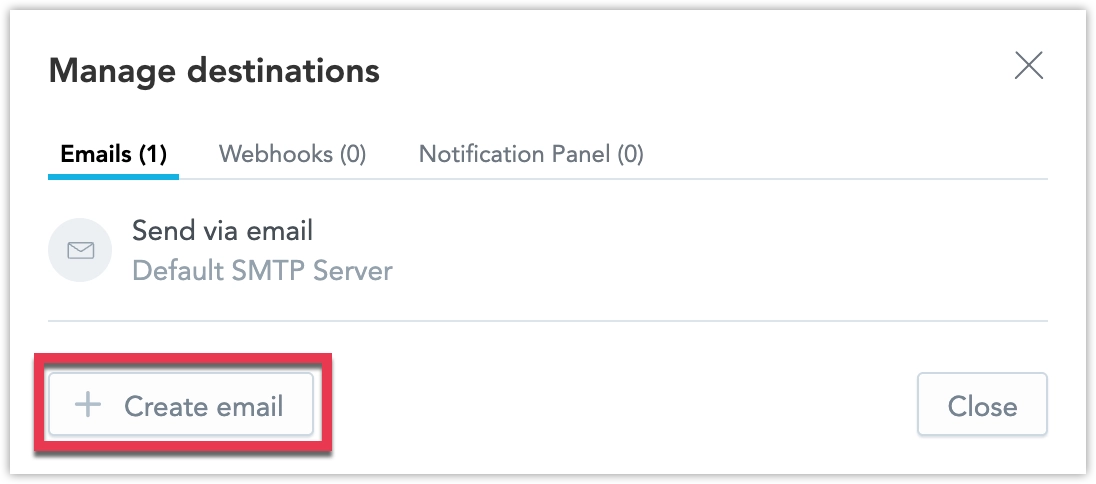
Next to Destinations click Manage > Emails, and click Create email.
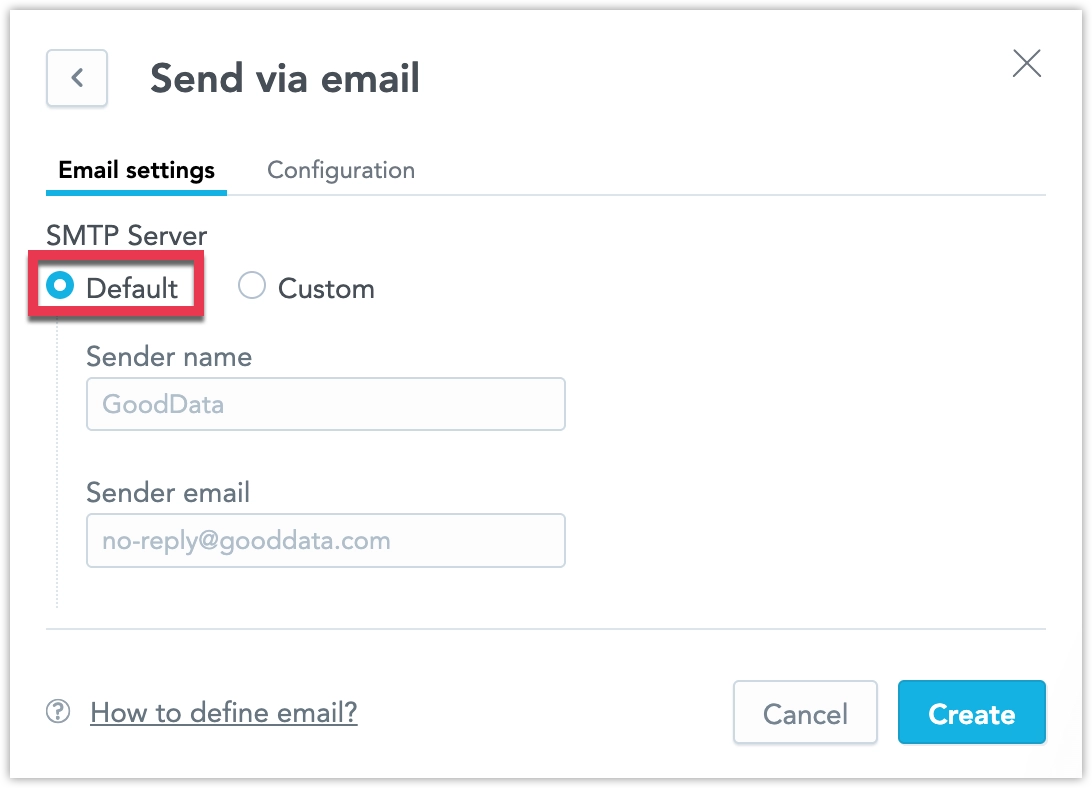
Choose the SMTP server:
For the default GoodData SMTP, the sender’s name and email address currently cannot be changed.
For a custom SMTP server, provide the sender’s details, the SMTP server URL, and the necessary authentication credentials.
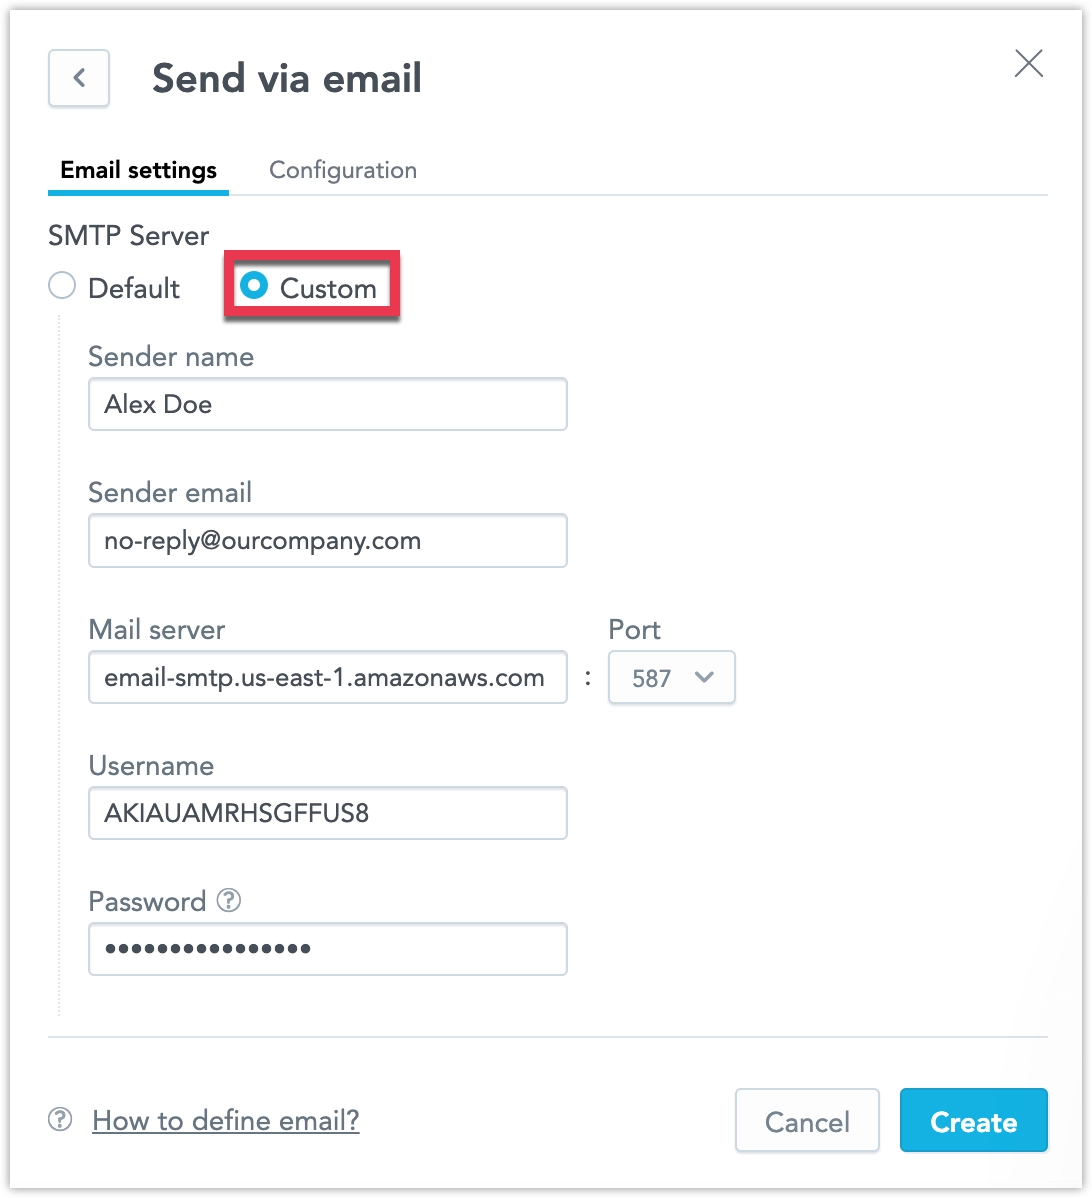
The Testing email is used to Test Your Custom SMTP Server.
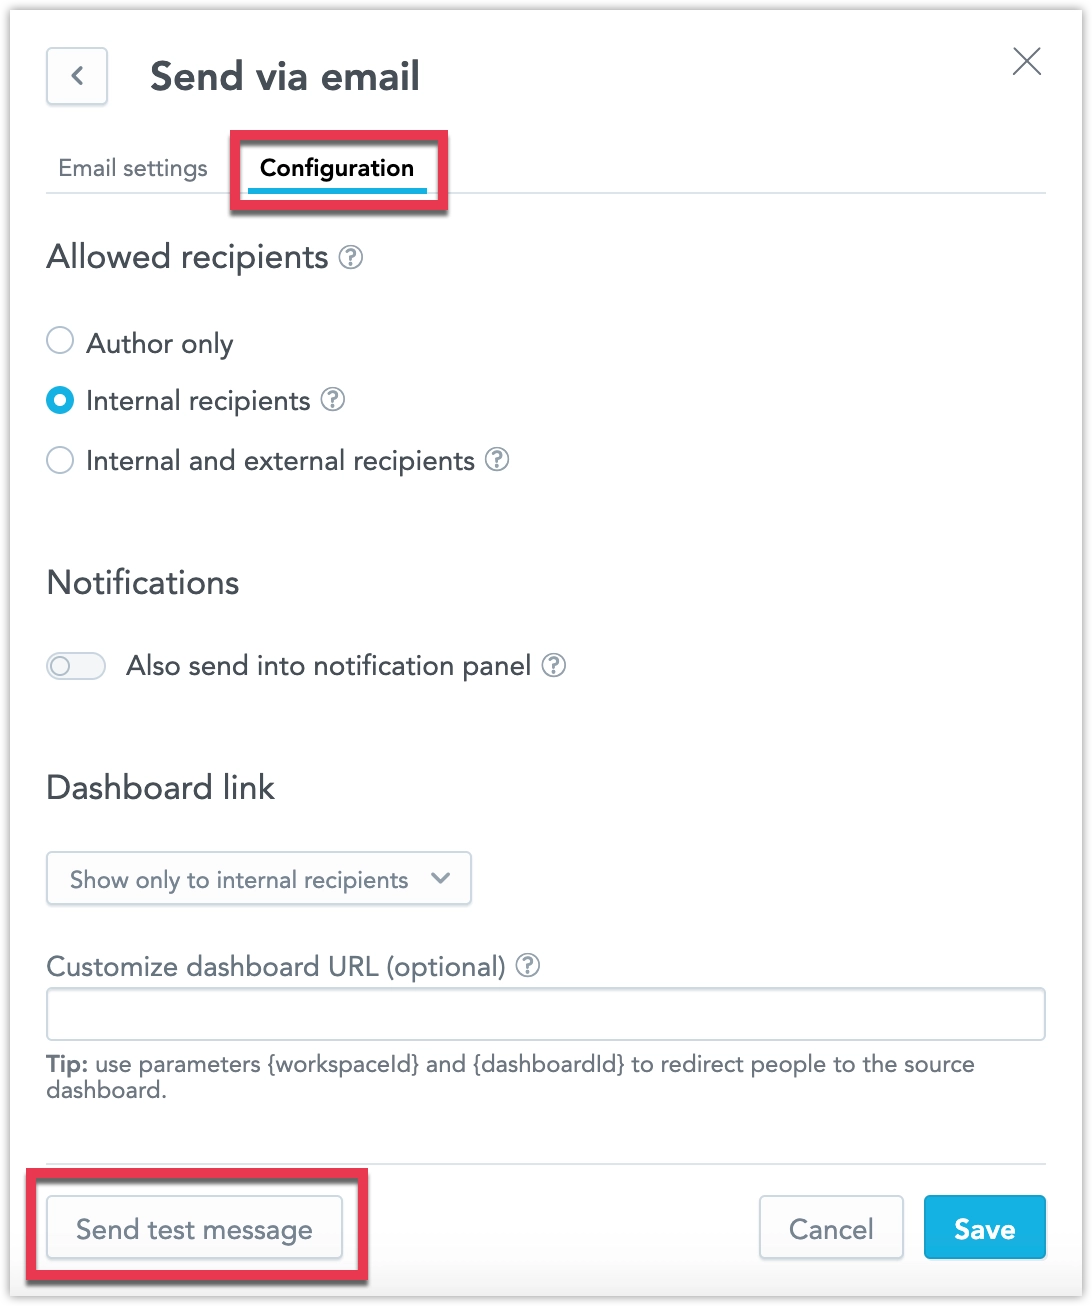
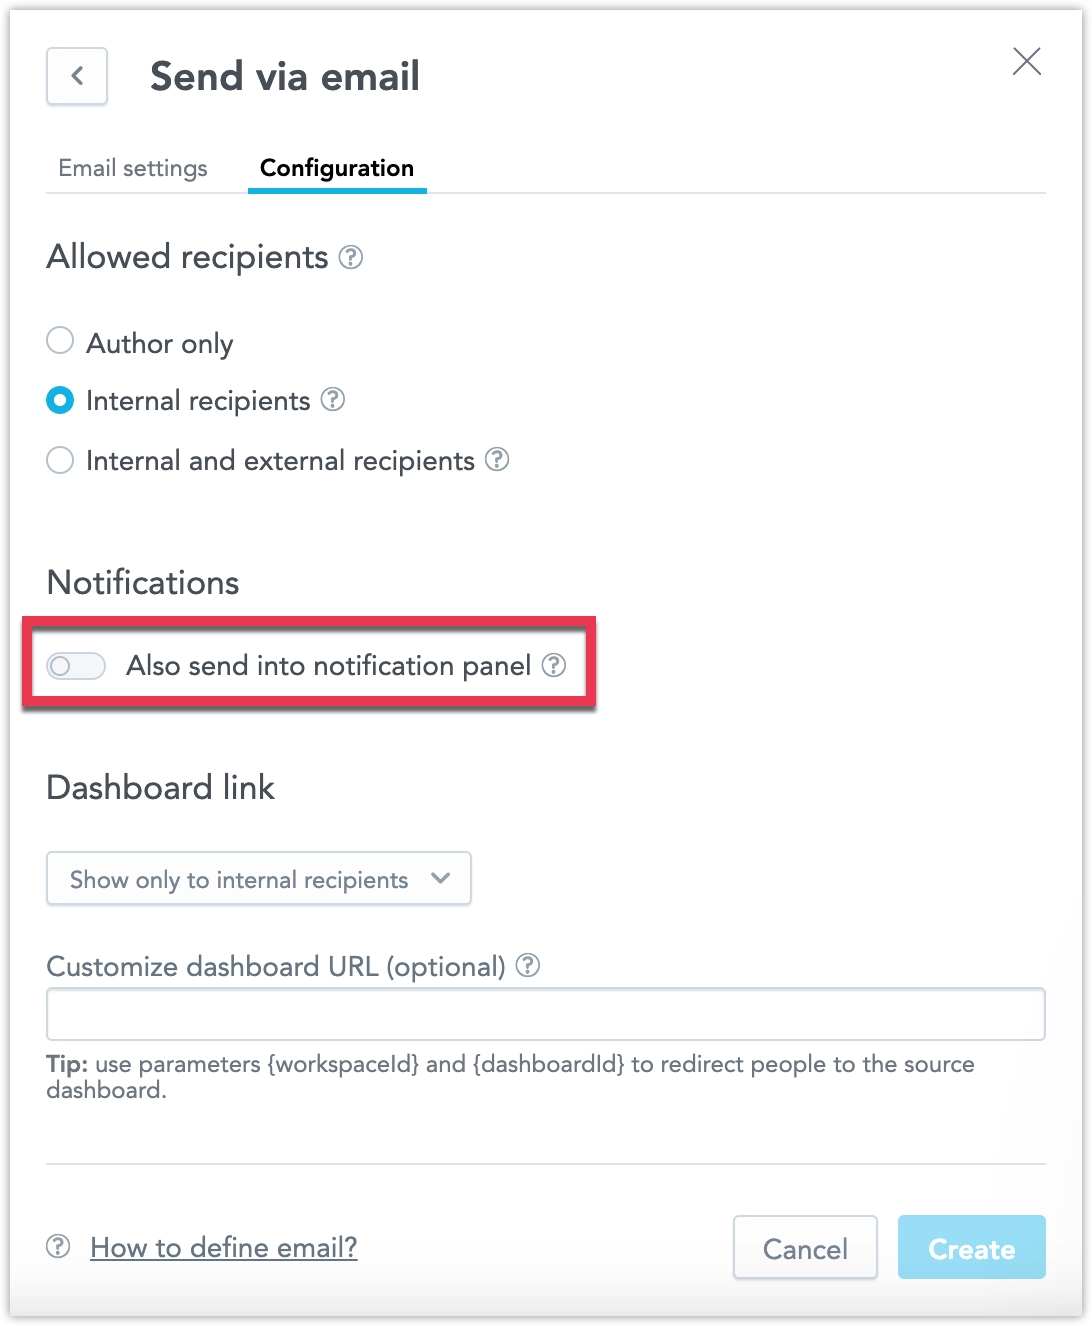
Switch to the Configuration tab and specify how this destination can be used.
For more details about dashboard links and email customization options, refer to the Customize Emails. section.
After setting everything up, click Create.
Test Your Custom SMTP Server
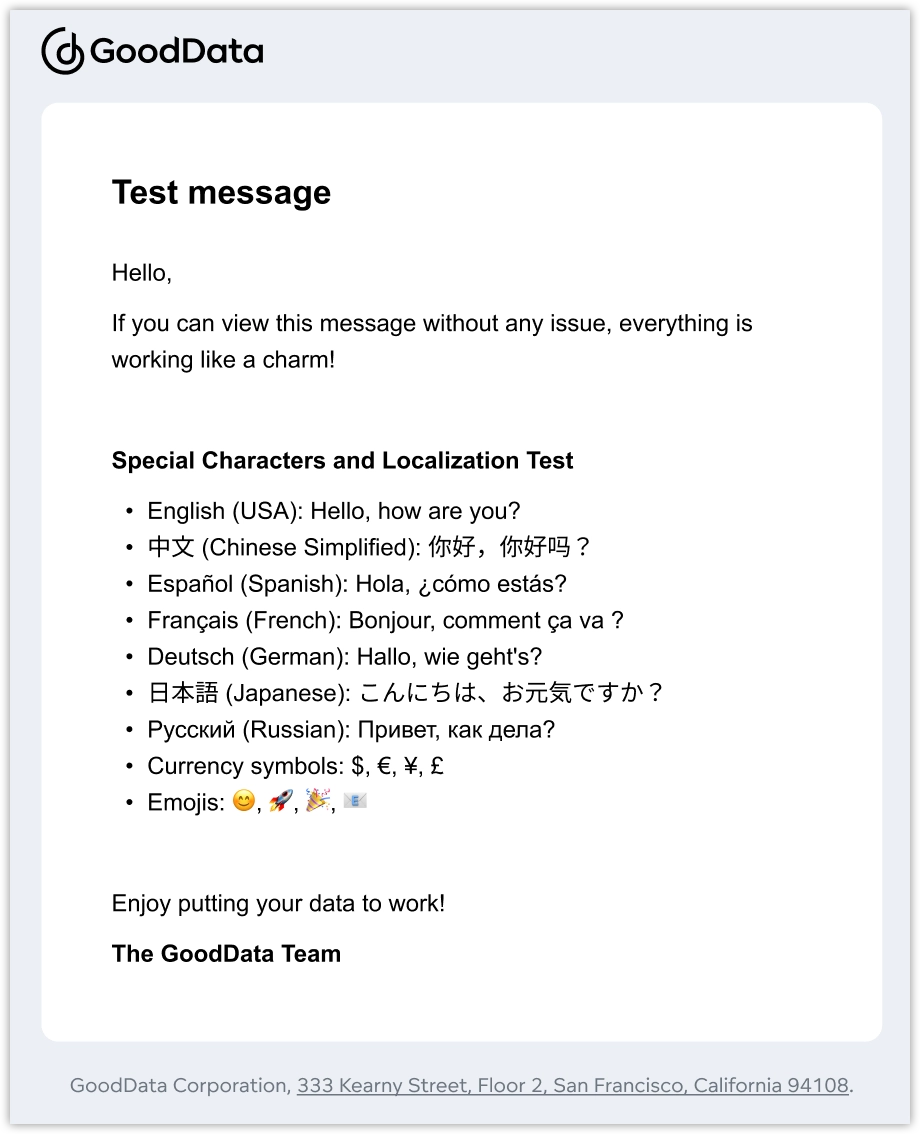
When you create a new email destination using a custom SMTP server, we automatically validate your setup by sending a test email to your account’s email address:
You can also re-test any existing email destinations using the Send test message button in the destination’s Configuration tab:
Webhook
GoodData can send alerts and export data as a JSON payload to a webhook destination. As an administrator, you are responsible for creating and managing these webhook destinations. For testing, you can use tools like webhook.site to capture and inspect HTTP requests, which simplifies the process of validating your webhook configurations before deploying them in production environments.
Steps:
Go to Settings.
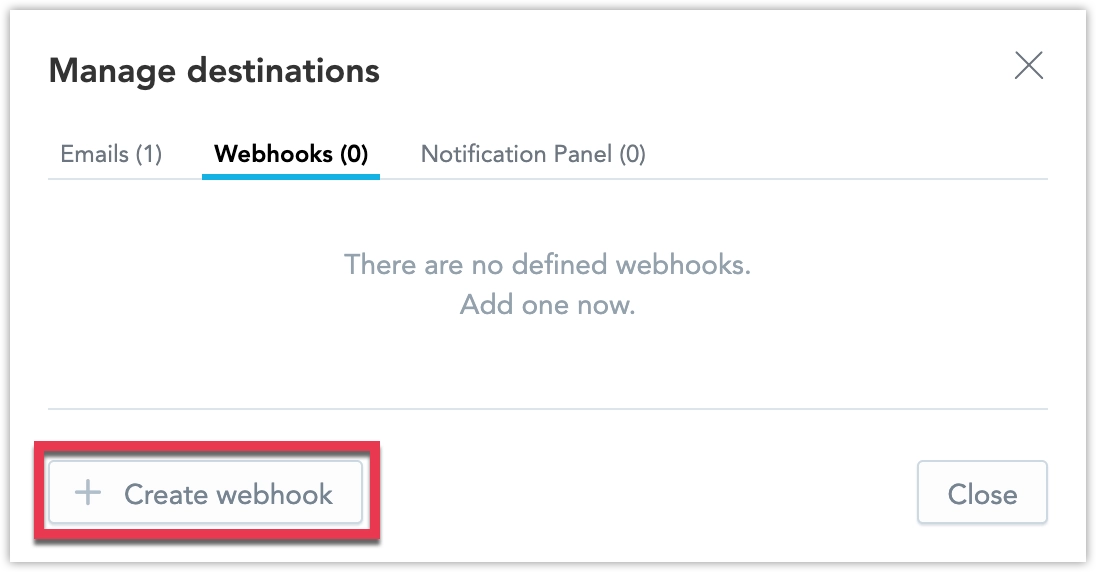
Under Destinations > Webhooks, click Create webhook.
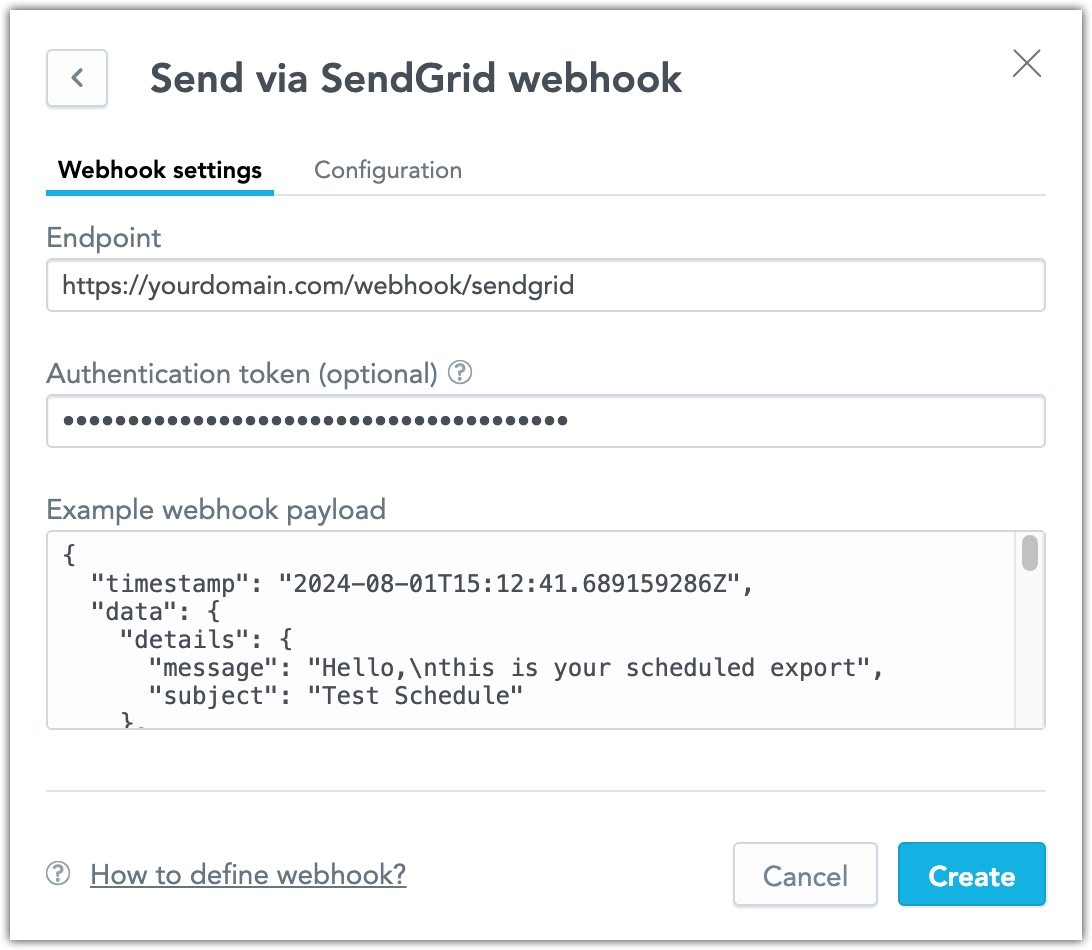
Configure the payload destination URL and, if necessary, provide a bearer authentication token. Click Create once everything is set up.
Webhook Payloads
Alert payload example:
{
  "data": {
    "alert": {
      "condition": "greater than",
      "currentValue": 9.0,
      "metric": "Metric",
      "status": "SUCCESS",
      "threshold": 8.0
    },
    "details": {
      "subject": "Hello, World!"
    },
    "recipients": [
      {
        "email": "admin@gooddata.com",
        "id": "admin"
      },
      {
        "email": "tester@gooddata.com",
        "id": "tester"
      }
    ],
    "remainingActionCount": 10
  },
  "timestamp": "2024-09-03T14:34:40.263549Z",
  "type": "automation-task.completed"
}
Scheduled export payload example:
{
  "timestamp": "2024-08-01T15:12:41.689159286Z",
  "data": {
    "details": {
      "message": "Hello,\nthis is your scheduled export",
      "subject": "Test Schedule"
    },
    "visualExports": [
      {
        "exportId": "<export_id>",
        "status": "DONE",
        "fileUri": "<presigned_generated_url>",
        "traceId": "ec020036de43"
      }
    ],
    "automation": {
      "id": "<destination_id>",
      "title": "Webhook test",
      "dashboardURL": "<host_url>/dashboards/#/workspace/<workspace_id>/dashboard/<dashboard_id>"
    },
    "recipients": [
      {
        "email": "jane.doe@gooddata.com",
        "id": "<user_id>"
      }
    ],
    "remainingActionCount": 123
  },
  "type": "automation-task.completed"
}
Note that visualExports is used in case of a dashboard export, and tabularExports in case of a widget export.
Webhook Error Payloads
If an error occurs, we send an error payload.
Example of a failed alert:
{
  "data": {
    "alert": {
      "condition": "greater than",
      "metric": "Metric",
      "status": "ERROR",
      "traceId": "847839egf3a0695c"
    },
    "details": {
      "subject": "Hello, World!"
    },
    "recipients": [
      {
        "email": "admin@gooddata.com",
        "id": "admin"
      },
      {
        "email": "tester@gooddata.com",
        "id": "tester"
      }
    ],
    "remainingActionCount": 10
  },
  "timestamp": "2024-09-03T14:34:40.263549Z",
  "type": "automation-task.completed"
}
Example of a failed scheduled export:
{
  "data": {
    "details": {
      "title": "example"
    },
    "tabularExports": [
      {
        "exportId": "5a422124df0c1342543b95eacc5b_982638b2f84c3e7e5a7fc5d7955",
        "status": "ERROR",
        "errorMessage": "Export failed due to internal exception",
        "traceId": "134839eff3e9515c"
      },
      {
        "exportId": "5a422124df0c1342543b95eacc5b_dc30f52a8f04d299bcea726d1f5",
        "status": "ERROR",
        "errorMessage": "Export failed due to internal exception",
        "traceId": "134839eff3e9515c"
      }
    ]
  },
  "timestamp": "2024-07-08T08:38:22.123200127Z",
  "type": "automation-task.completed"
}
Note that visualExports is used in case of a dashboard export, and tabularExports in case of a widget export.
Notification Panel
Every workspace contains a notification panel that collects notifications generated by triggered alerts.
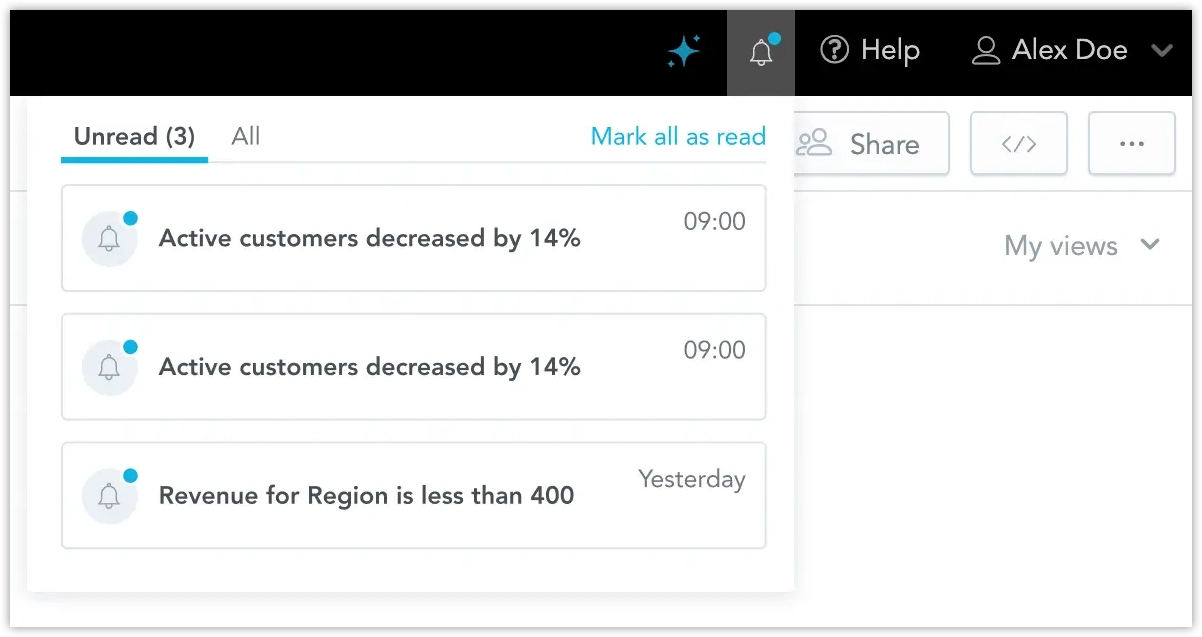
You can click individual notifications to navigate to the widget for which the corresponding alert was triggered.
Use the notification panel destination if you want to enable users to send alert notifications exclusively to their notification panel. Additionally, you can toggle the Also send to notification panel option for email and webhook destinations to include the notification panel as an additional delivery channel.
Steps:
Go to Settings.
Under Destinations > Notification Panel, click Create destination.
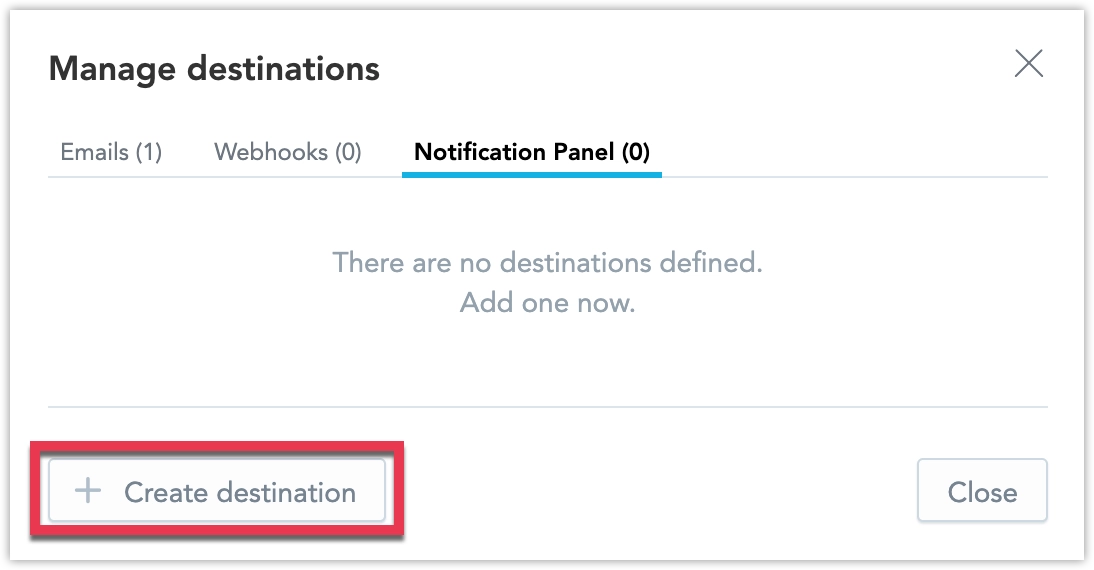
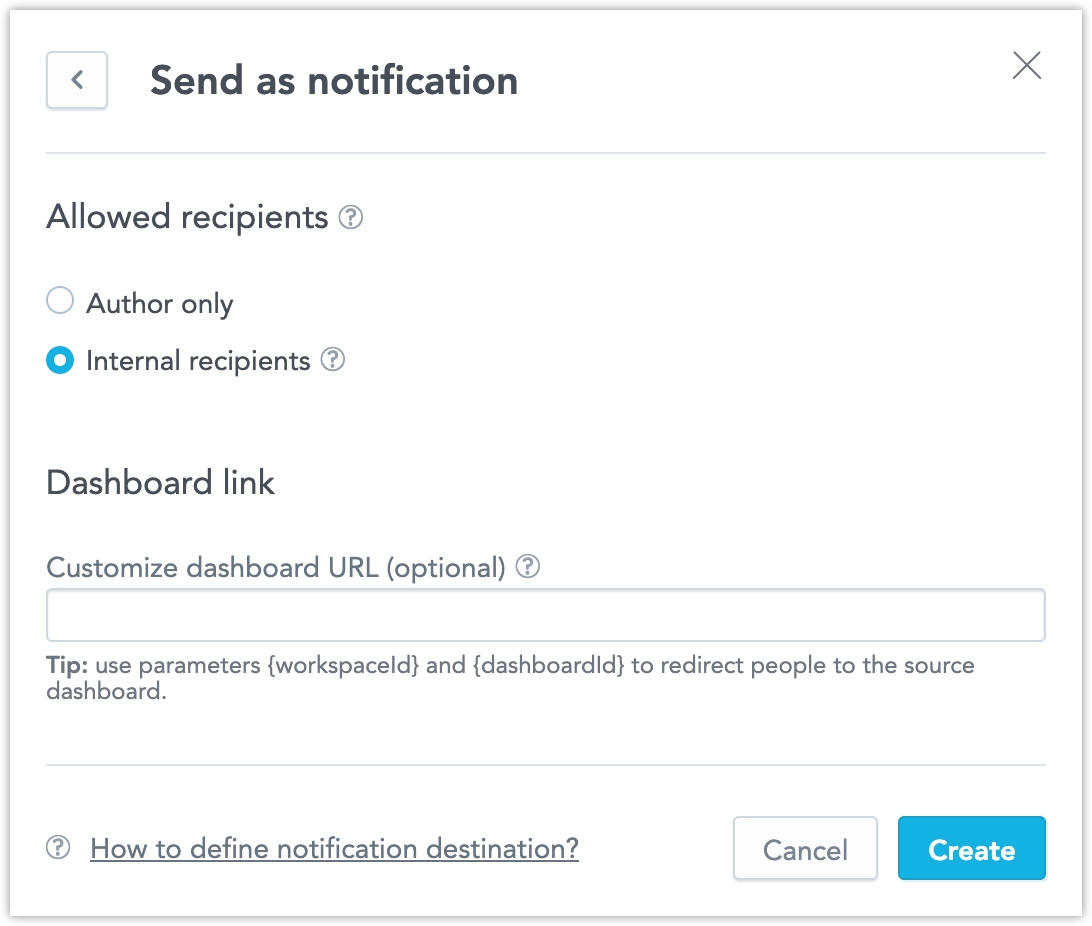
Provide a display name, select allowed recipients, and click Create.
Customize Emails
The appearance and behavior of both alert emails and scheduled export emails can be customized based on the following factors:
Enabling logo white-labeling hides the GoodData corporate address line and replaces the GoodData logo with your own branding.
Changing the primary color in your theme allows you to customize the color of the Open dashboard button.
The dashboard link in emails can be customized for each email destination through the configuration tab:
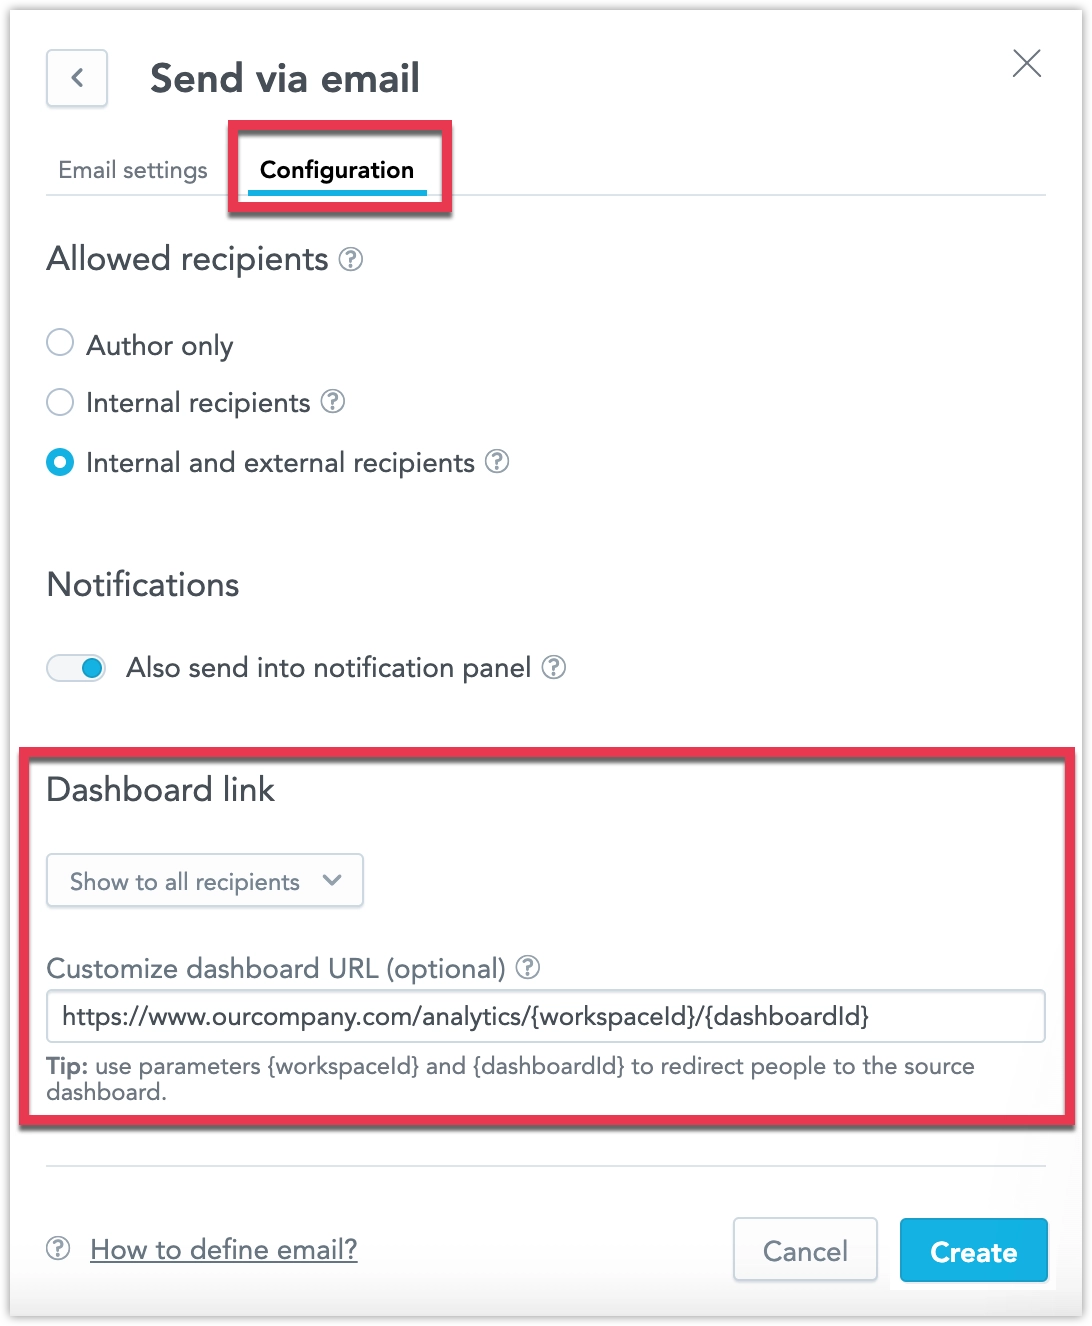
Valid examples of the customized link syntax include:
https://example.gooddata.com/client/{workspaceId}/dashboard/{dashboardId}https://example.gooddata.com/?client={workspaceId}&dashboard={dashboardId}https://example.gooddata.com/client/{workspaceId}?dashboard={dashboardId}https://example.gooddata.com/dashboard/{dashboardId}https://example.gooddata.com/client/{workspaceId}https://example.gooddata.com
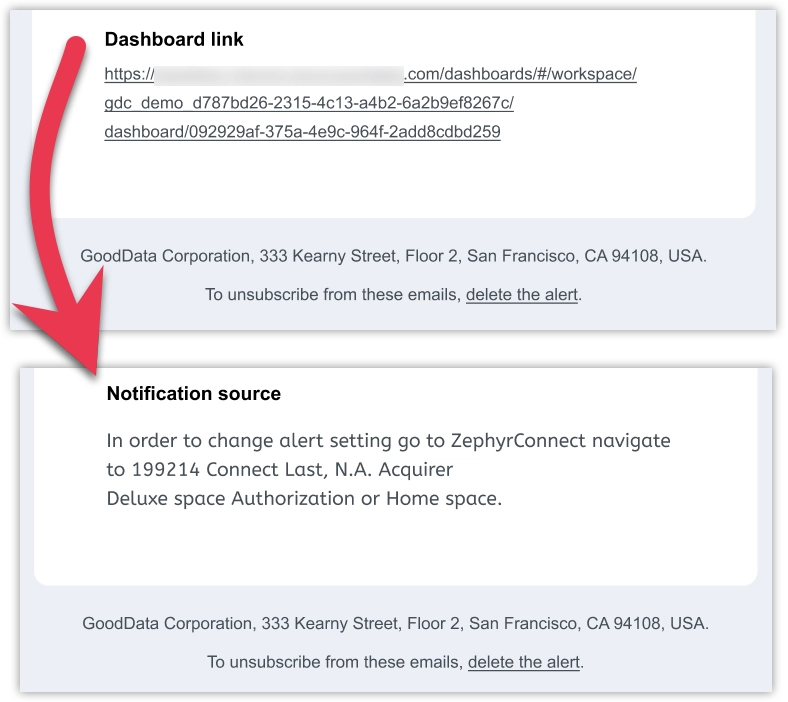
Notification Source
For email alers and scheduled exports, if you want to provide context about the data source without exposing direct dashboard URLs in email communications, you can use API to configure a notificationChannel property for a particular notification channel. This provides a human-readable alternative to dashboard URLs in email notifications.
The notification source supports the following variables:
{{ workspaceId }}{{ workspaceName }}{{ workspaceDescription }}{{ dashboardId }}{{ dashboardName }}{{ dashboardDescription }}
For example you can define notificationChannel as:
Dashboard: {{ dashboardName }} from {{ workspaceName }}{{ workspaceName }} - {{ dashboardName }}Report from {{ workspaceName }} workspace{{ dashboardName }} (ID: {{ dashboardId }})
Here’s how to create an email notification channel with a notification source via API:
curl https://your-gooddata-host.com/api/v1/entities/notificationChannels \
  -H "Content-Type: application/vnd.gooddata.api+json" \
  -H "Accept: application/vnd.gooddata.api+json" \
  -H "Authorization: Bearer YOUR_TOKEN" \
  -X POST \
  -d '{
    "data": {
      "type": "notificationChannel",
      "id": "email-channel-with-source",
      "attributes": {
        "name": "Sales Dashboard Email",
        "description": "Email notifications for sales dashboard exports",
        "notificationSource": "Dashboard: {{ dashboardName }} from {{ workspaceName }}",
        "allowedRecipients": "INTERNAL",
        "destination": {
          "type": "SMTP",
          "host": "smtp.example.com",
          "port": 587,
          "username": "notifications@company.com",
          "password": "your-smtp-password",
          "fromEmail": "notifications@company.com",
          "fromEmailName": "GoodData Reports"
        }
      }
    }
  }'
When notifications are sent through this channel, instead of showing a dashboard URL, the email will display the formatted notification source, such as “Dashboard: Sales Performance from Marketing Workspace”.
Evaluation Frequency
The evaluation frequency determines how often GoodData checks whether any alerts are triggered. You can configure this setting on the Settings page:
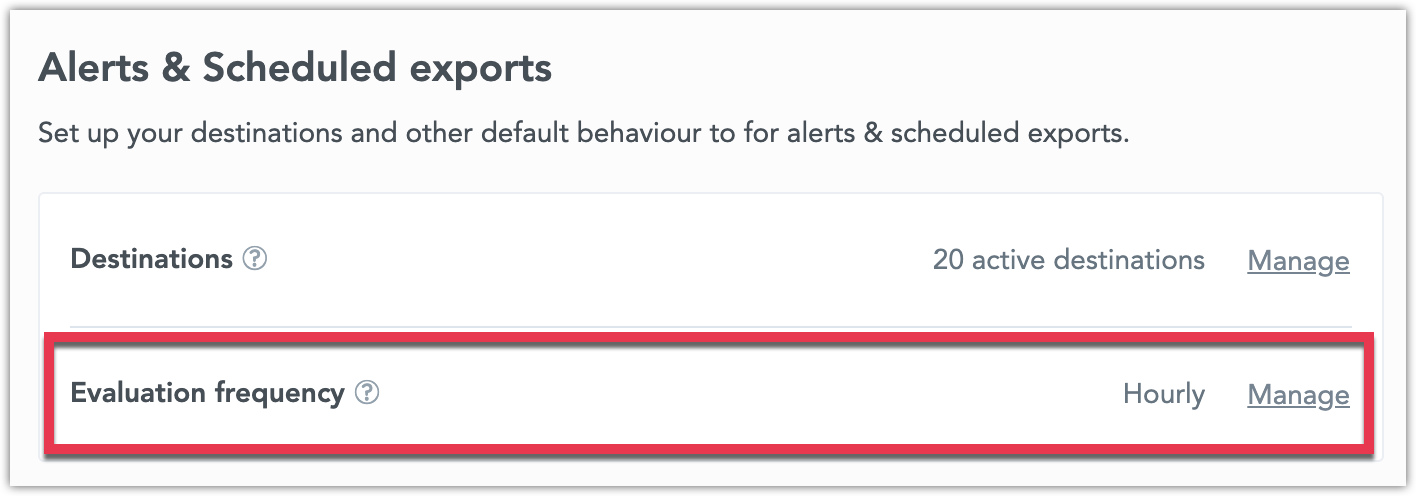
GoodData supports triggering automations at most once per hour, so your evaluation frequency should not be shorter than that. The frequency you set should align with or exceed your cache invalidation schedule. For example, if you set the evaluation frequency to hourly but only refresh your data once a day, alerts could be triggered repeatedly by the same stale data.
Central Management
Organization administrators can use the Automations section on the home page. This view centralizes all automations across every workspace in the organization, making it easier to oversee and manage them at scale.
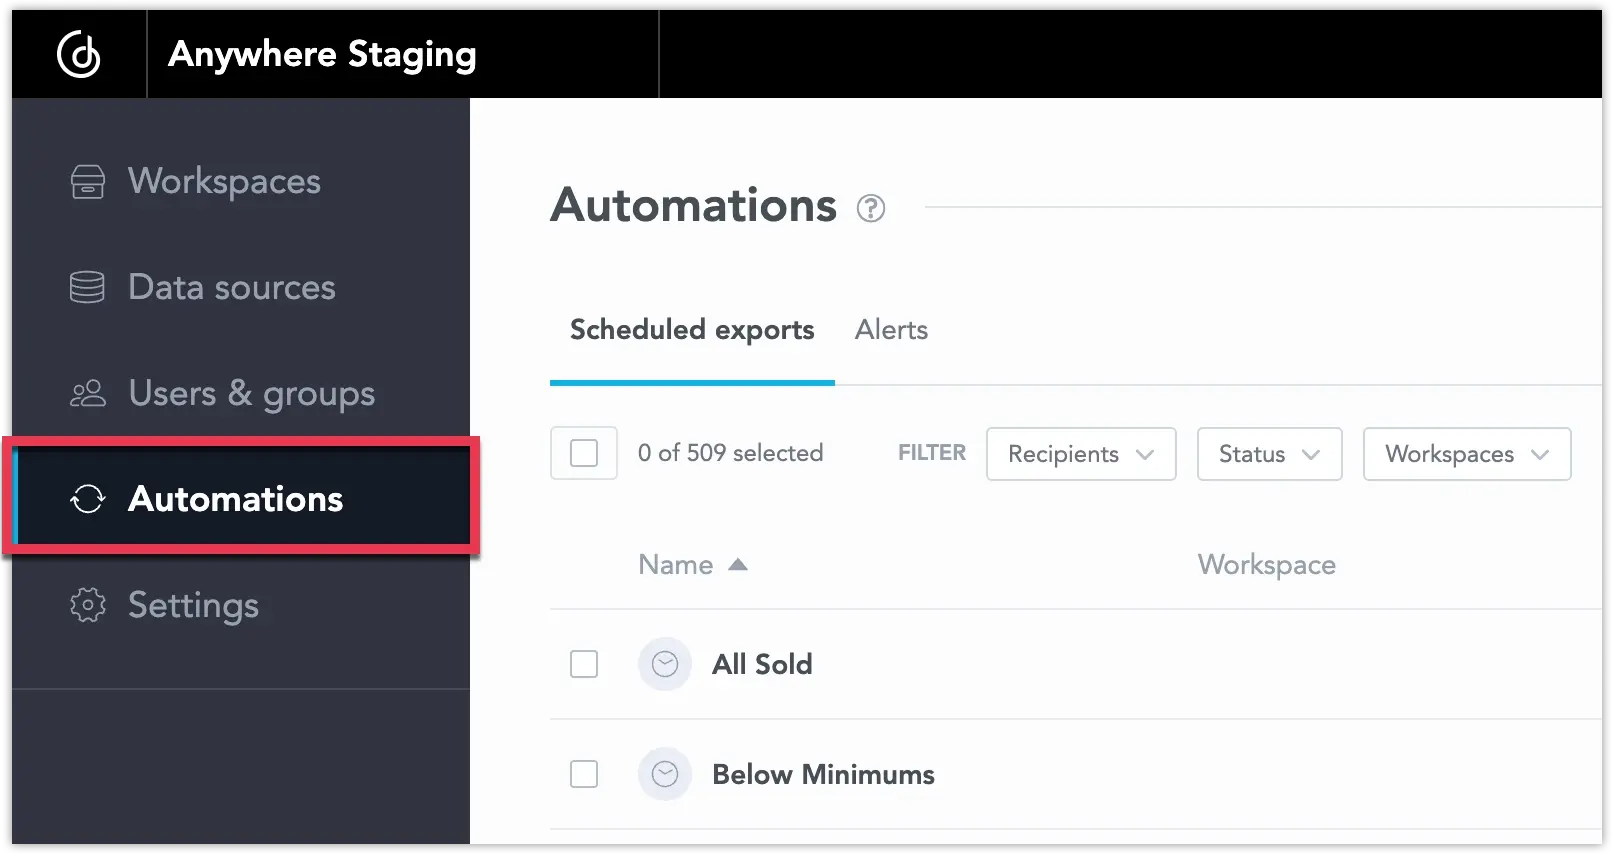
From this single location, you can:
- Filter automations by recipient, workspace, or status
- Search and sort by title
- Perform actions in bulk, including delete, pause, resume, or unsubscribe
Further customization of this dialog is available for developers using our React SDK users, see Automations article in the React SDK documentation.
Permissions
To create new alerts and scheduled exports, users must have the Workspace.CREATE_AUTOMATION permission. For more details on how to manage permissions, see Manage Workspace Permissions.
Users with this permission can create automations, while other users will continue to receive alerts and exports from active automations they are subscribed to. However, only the automation’s creator or an administrator can edit, pause, or delete the automation.
Administrators with the Workspace.MANAGE permission (or higher) can manage automations without needing the Workspace.CREATE_AUTOMATION permission. Additionally, automations can only be created for users who have access to the dashboard.
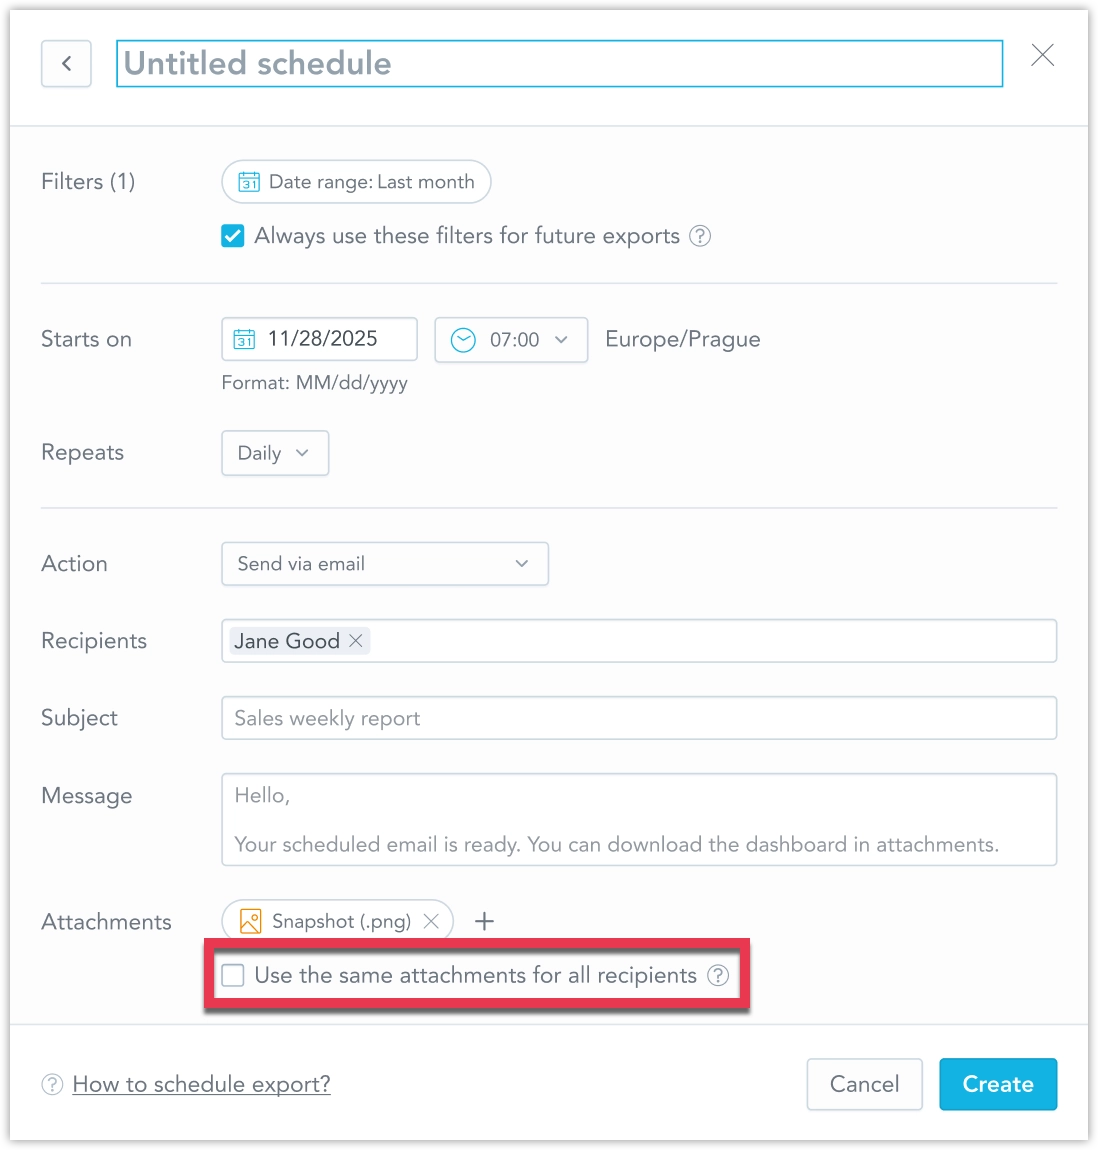
Please note that both alerts and scheduled exports respect user data filters. This means different users may receive different results, depending on which user data filters are applied to them. To change this behaviour, see Identical Exports.
External recipients do not have their own user data filter context and receive data as it appears to the creator of the alert or scheduled export.
Identical Exports
As an administrator, you can configure an organization or workspace to let users disable data filtering for exported dashboards and widgets. This ensures all recipients get the same file, regardless of their data access.
Because enabling this feature bypasses standard access controls, it is disabled by default. You can enable it at the organization or workspace level by setting ENABLE_AUTOMATION_EVALUATION_MODE to true:
curl $HOST_URL/api/v1/entities/organizationSettings/ \
  -H "Content-Type: application/vnd.gooddata.api+json" \
  -H "Accept: application/vnd.gooddata.api+json" \
  -H "Authorization: Bearer $API_TOKEN" \
  -X POST \
  -d '{
    "data": {
      "type": "organizationSetting",
      "id": "<some_setting_id>",
      "attributes": {
        "content": { "value": true },
        "type": "ENABLE_AUTOMATION_EVALUATION_MODE"
      }
    }
  }' | jq .
Limits
To maintain optimal performance and user experience, we apply limits on the number of automations that can be triggered per day, emails sent, webhooks called, and recipients assigned. These limits vary based on your product tier and are defined in your organization’s entitlements.
Tiered Limits
The following limits depend on your product tier:
| Limit | Trial | Professional | Enterprise |
|---|---|---|---|
| Maximum number of automation objects (alerts and scheduled exports) per workspace | 20 | 100 | 200 |
| Maximum number of recipients users can add to the Recipients field | 5 | 20 | 60 |
| Maximum number of scheduled export executions per workspace in a 24-hour period | 10 | 50 | 100 |
| Maximum number of alert executions per workspace in a 24-hour period | 100 | 360 | 600 |
The number of notifications stored in the notification panel is determined by your product tier. Once the limit is reached, older notifications are automatically replaced, starting with the oldest. Retention rules also specify how long notifications are stored:
| Tier | Number of Notifications | Retention (Days) |
|---|---|---|
| Trial | 100 | 3 |
| Pro | 500 | 7 |
| Enterprise | 1000 | 30 |
These limits ensure optimal performance while providing users with access to the most recent and relevant alerts.
Common Limits
The following limits apply to all product tiers:
- Minimum time between scheduled exports: 60 minutes
- Minimum time between alert evaluations: 60 minutes
- Maximum size of attachments: 10 MB per scheduled export, 40 MB per email
- Maximum number of attachments per scheduled export: 10
- Maximum number of destinations: 20