Access Raw Data Through API
Use the AFM (Attributes, Filters, Metrics) API if you want to get data from your GoodData and do not want to use Dashboards, Analytics Designer, or GoodData.UI (these applications get data automatically in the background).
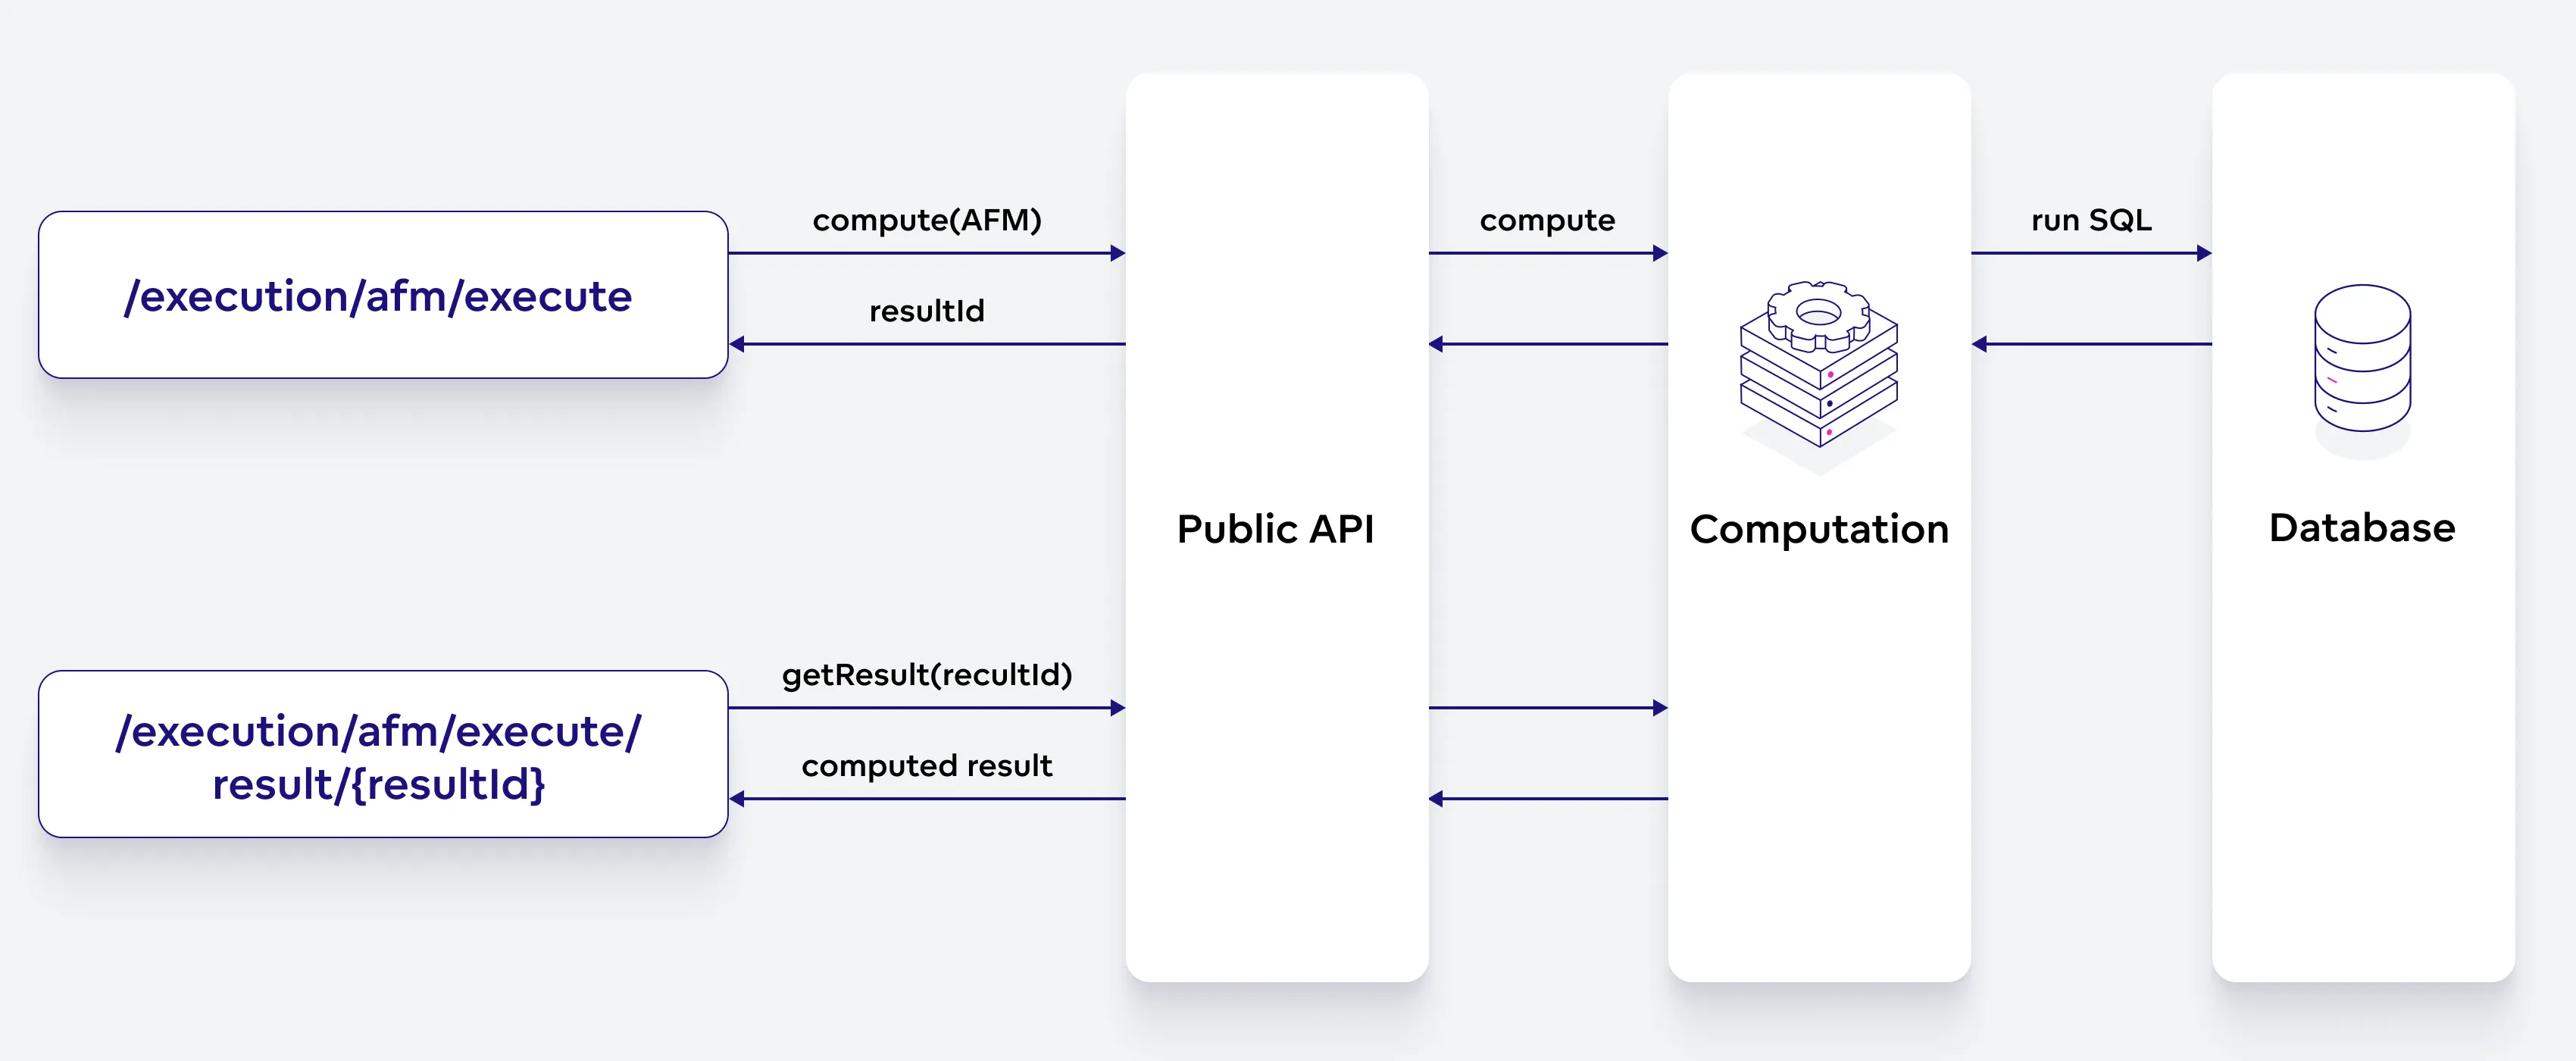
A simple scenario to get data uses the following two endpoints:
- Execute endpoint - executes an analytical request and returns a link to the result.
- Result endpoint - returns a response with computed data.
Retrieve Data by API
To retrieve data, you need to call the two endpoints mentioned above. The execute endpoint computes the result based on the AFM body. The result endpoint returns data based on resultId.
Take into account that the diagram is simplified. In the computation engine, other processes happen in addition to what is shown in the diagram.
Understand the Concept
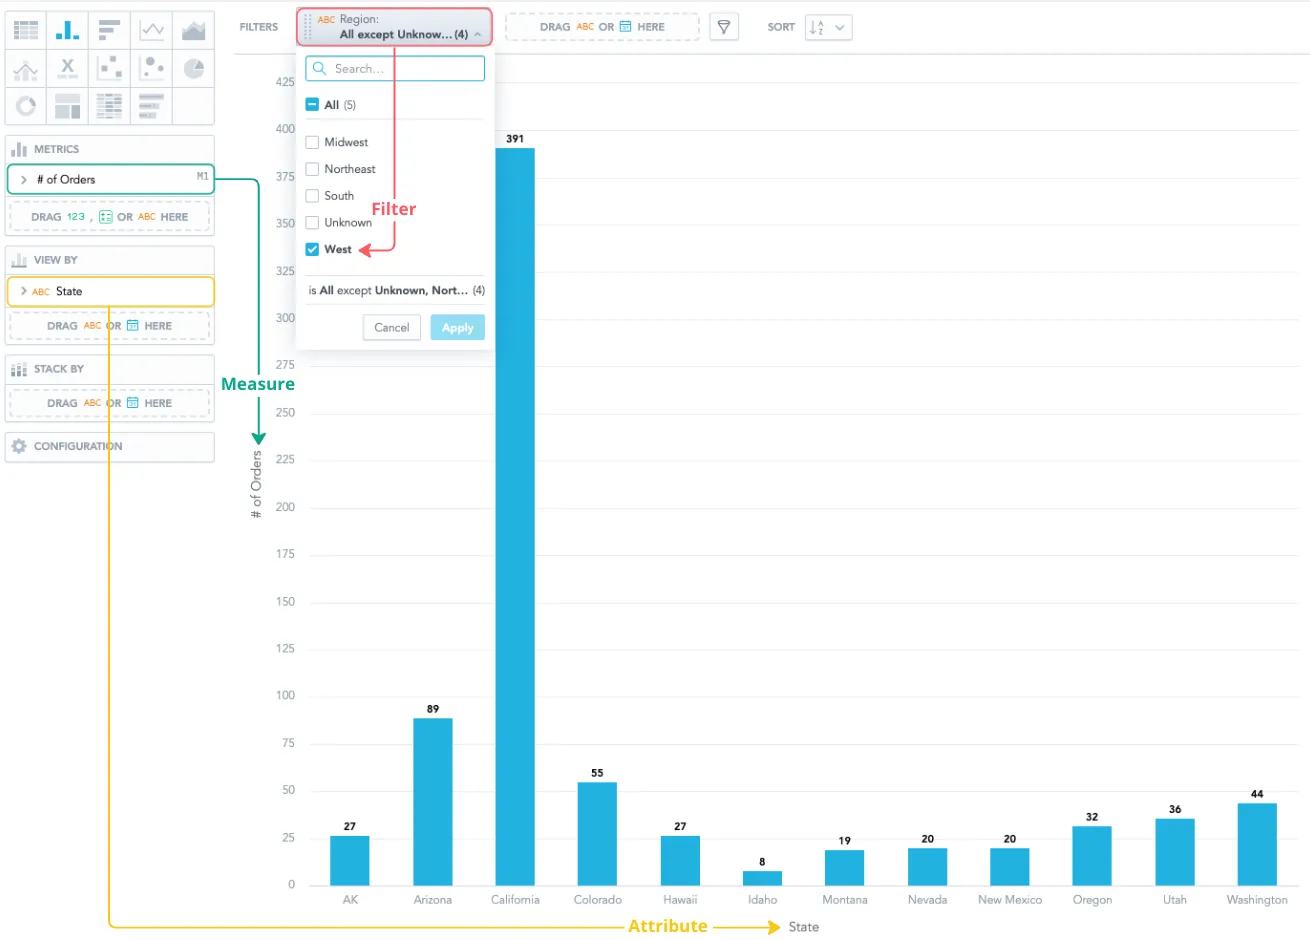
The key concept is the AFM (Attributes, Filters, Metrics):
- An attribute breaks the metric apart and provides context to the data.
- A filter is a set of conditions that removes specific values from your original data.
- A metric is a computational expression that aggregates one or more numerical values.
These are best described with an example. Imagine you are an account manager for an e-commerce shop. You want to know the number of orders in states that are in the ‘West’ region. Let’s display your data as a column chart:
Compute
To compute the result, you need to call the execute endpoint with the following body; in the body, you specify which attributes, filters, and metrics have to be used in the computation:
Metrics vs. Measures
In the API, metrics are often referred to as ‘measures’. Note that the two terms are entirely synonymous.
{
  "resultSpec":{
    "dimensions":[
      {
        "localIdentifier":"dim_0",
        "itemIdentifiers":["measureGroup"]
      },
      {
        "localIdentifier":"dim_1",
        "itemIdentifiers":["a_state"],
        "sorting":[
          {
            "attribute":{
              "attributeIdentifier":"a_state",
              "sortType":"DEFAULT"
            }
          }
        ]
      }
    ],
    "totals":[]
  },
  "execution":{
    "measures":[
      {
        "localIdentifier":"m_quantity_sum",
        "definition":{
          "measure":{
            "item":{
              "identifier":{
                "id":"quantity",
                "type":"fact"
              }
            },
            "aggregation":"SUM"
          }
        }
      }
    ],
    "attributes":[
      {
        "label":{
          "identifier":{
            "id":"state",
            "type":"label"
          }
        },
        "localIdentifier":"a_state"
      }
    ],
    "filters":[
      {
        "negativeAttributeFilter":{
          "label":{
            "identifier":{
              "id":"region",
              "type":"label"
            }
          },
          "notIn":{
            "values":[
              "Unknown",
              "Northeast",
              "Midwest",
              "South"
            ]
          }
        }
      }
    ],
    "auxMeasures":[]
  },
  "settings":{}
}
dimensions- communicate to the backend how to organize data. In this example, we have set in the body that allmeasureGroupmetrics will be in thedim_0dimension and thea_stateattribute in thedim_1dimension.
You can define one or two dimensions, where one can be empty. The default is to use two dimensions: typically, all attributes in one and measureGroup in the other. Both configurations are valid, and it’s also possible to have empty itemIdentifiers in a dimension, which can be useful depending on the desired output structure.
Tip
The first dimension (dim_0) usually refers to rows, and the second dimension (dim_1) to columns. However, while this is the typical case, it may vary based on specific use cases and configurations.Get Result
Once you get a response from the execute endpoint, you will be given a resultId:
{
   "executionResponse":{
      "dimensions":[...],
      "links":{
         "executionResult":"<resultId>"
      }
   }
}
You can then call the result endpoint using the resultId to retrieve the computed data:
{
   "data":[
      [27.0, 89.0, 391.0, 55.0, 27.0, 8.0, 19.0, 20.0, 20.0, 32.0, 36.0, 44.0]
   ],
   "dimensionHeaders":[
      {
         "headerGroups":[
            {
               "headers":[
                  {
                     "measureHeader":{
                        "measureIndex":0
                     }
                  }
               ]
            }
         ]
      },
      {
         "headerGroups":[
            {
               "headers":[
                  {
                     "attributeHeader":{
                        "labelValue":"AK",
                        "primaryLabelValue":"AK"
                     }
                  },
                  {
                     "attributeHeader":{
                        "labelValue":"Arizona",
                        "primaryLabelValue":"Arizona"
                     }
                  },
                  {
                     "attributeHeader":{
                        "labelValue":"California",
                        "primaryLabelValue":"California"
                     }
                  },
                  {
                     "attributeHeader":{
                        "labelValue":"Colorado",
                        "primaryLabelValue":"Colorado"
                     }
                  },
                  {
                     "attributeHeader":{
                        "labelValue":"Hawaii",
                        "primaryLabelValue":"Hawaii"
                     }
                  },
                  {
                     "attributeHeader":{
                        "labelValue":"Idaho",
                        "primaryLabelValue":"Idaho"
                     }
                  },
                  {
                     "attributeHeader":{
                        "labelValue":"Montana",
                        "primaryLabelValue":"Montana"
                     }
                  },
                  {
                     "attributeHeader":{
                        "labelValue":"Nevada",
                        "primaryLabelValue":"Nevada"
                     }
                  },
                  {
                     "attributeHeader":{
                        "labelValue":"New Mexico",
                        "primaryLabelValue":"New Mexico"
                     }
                  },
                  {
                     "attributeHeader":{
                        "labelValue":"Oregon",
                        "primaryLabelValue":"Oregon"
                     }
                  },
                  {
                     "attributeHeader":{
                        "labelValue":"Utah",
                        "primaryLabelValue":"Utah"
                     }
                  },
                  {
                     "attributeHeader":{
                        "labelValue":"Washington",
                        "primaryLabelValue":"Washington"
                     }
                  }
               ]
            }
         ]
      }
   ],
   "grandTotals":[],
   "paging":{
      "count":[1, 12],
      "offset":[0, 0],
      "total":[1, 12]
   }
}
data- the numerical points that you can display, for example, on the Y axis of a column chart.headers- the text-based points that you can display, for example, on the X axis of a column chart or in a legend.
Example
Compute a report by making a POST call to the API endpoint api/v1/actions/workspaces/<workspace_id>/execution/afm/execute with an AFM definition in the body of the call:
curl $HOST_URL/api/v1/actions/workspaces/<workspace_id>/execution/afm/execute \
-H 'Authorization: Bearer $API_TOKEN' \
-H 'Content-Type: application/json' \
-X POST \
-d '{
        "resultSpec": {
            "dimensions": [
                {
                    "localIdentifier": "dim_0",
                    "itemIdentifiers": [
                        "a_products.category"
                    ]
                },
                {
                    "localIdentifier": "dim_1",
                    "itemIdentifiers": [
                        "a_date.year",
                        "measureGroup"
                    ],
                    "sorting": [
                        {
                            "attribute": {
                                "attributeIdentifier": "a_date.year",
                                "sortType": "DEFAULT"
                            }
                        }
                    ]
                }
            ],
            "totals": []
        },
        "execution": {
            "measures": [
                {
                    "localIdentifier": "m_revenue",
                    "definition": {
                        "measure": {
                            "item": {
                                "identifier": {
                                    "id": "revenue",
                                    "type": "metric"
                                }
                            }
                        }
                    }
                }
            ],
            "attributes": [
                {
                    "label": {
                        "identifier": {
                            "id": "date.year",
                            "type": "label"
                        }
                    },
                    "localIdentifier": "a_date.year"
                },
                {
                    "label": {
                        "identifier": {
                            "id": "products.category",
                            "type": "label"
                        }
                    },
                    "localIdentifier": "a_products.category"
                }
            ],
            "filters": [],
            "auxMeasures": []
        },
        "settings": {}
    }'
You will get back an execution response:
{
    "executionResponse": {
        "dimensions": [
            {
                "headers": [
                    {
                        "attributeHeader": {
                            "localIdentifier": "a_products.category",
                            "label": {
                                "id": "products.category",
                                "type": "label"
                            },
                            "labelName": "Category",
                            "attribute": {
                                "id": "products.category",
                                "type": "attribute"
                            },
                            "attributeName": "Category",
                            "granularity": null,
                            "primaryLabel": {
                                "id": "products.category",
                                "type": "label"
                            },
                            "valueType": "TEXT"
                        }
                    }
                ],
                "localIdentifier": "dim_0"
            },
            {
                "headers": [
                    {
                        "attributeHeader": {
                            "localIdentifier": "a_date.year",
                            "label": {
                                "id": "date.year",
                                "type": "label"
                            },
                            "labelName": "Date - Year",
                            "attribute": {
                                "id": "date.year",
                                "type": "attribute"
                            },
                            "attributeName": "Date - Year",
                            "granularity": "YEAR",
                            "primaryLabel": {
                                "id": "date.year",
                                "type": "label"
                            },
                            "format": {
                                "locale": "vn-VN",
                                "pattern": "y"
                            }
                        }
                    },
                    {
                        "measureGroupHeaders": [
                            {
                                "localIdentifier": "m_revenue",
                                "format": "$#,##0",
                                "name": "Revenue"
                            }
                        ]
                    }
                ],
                "localIdentifier": "dim_1"
            }
        ],
        "links": {
            "executionResult": "<execution_result_id>"
        }
    }
}
You can use the <execution_result_id> to, for instance, create a tabular export of the data.
Technical Limits
| Feature | Limit | Notes |
|---|---|---|
| Maximum data size of a query result | 500,000,000 bytes | The maximum size of the raw result. Exceeding this limit results in computation failure. The following API endpoints are affected by this limit: - .../execution/afm/execute- .../execution/collectLabelElements |
| Maximum dimension size of a query result | 500,000 | Maximum single dimension size. Exceeding this limit results in computation failure. The API endpoint affected is: - .../execution/afm/execute |
| Maximum number of cells in a query result | 50,000,000 | Maximum count of result cells allowed in a returned result. Exceeding this limit results in computation failure. The API endpoint affected is: - .../execution/afm/execute |
Limits in a dedicated cluster can be changed after considering the individual use case.
Error Caching Period
When the API endpoint .../afm/execute encounters an error, subsequent attempts to make the same request may be blocked for 30 seconds to 3 minutes. This is due to the error being cached for a duration dependent on the error type. During this period, the request will not be re-executed until the cache clears. However, this timeout only applies to identical requests; other calls to the same endpoint with modified request bodies can still be processed during this time.
Next steps
If you do want to fetch data from GoodData, but you do not want to use an API, you can use both Python SDK or GoodData.UI as they provide you with a level of API abstraction.

