Why Augmented Analytics is Crucial for Modern Businesses?


Companies are dealing with rapidly growing amounts of data from diverse sources, making it increasingly difficult for decision-makers to extract meaningful insights. Augmented analytics offers a solution, enabling both data professionals and business users to interpret data quickly and easily, leading to more informed business decisions.
What is augmented analytics?
Augmented analytics is an advanced form of analytics powered by technologies like artificial intelligence (AI) and machine learning (ML), enhancing human interaction with data. It includes tools and software that offer analytical capabilities such as recommendations, insights, and query guidance to a wider audience. This technology simplifies data preparation, analysis, trend identification, and visualization, allowing business users to make informed decisions without requiring specialized expertise in data analysis or data science.
ML and augmented analytics
Machine learning is a subset of artificial intelligence that uses data and algorithms to imitate human learning and improve accuracy over time. In augmented analytics, ML is essential for generating recommendations, processing natural language, and automating data preparation. This blend of human curiosity and AI allows users to extract insights from data through intuitive conversational and visual interactions.
Augmented analytics features
Augmented analytics uses AI and ML technologies within BI and analytics tools to enhance data-driven decision-making. These platforms offer a range of features to transform data into actionable intelligence.
Advanced statistical methods
Advanced statistical methods provide in-depth data analysis and uncover hidden patterns and relationships within datasets. Common techniques include forecasting and clustering.
Forecasting uses historical data to predict future trends and behavior, helping businesses optimize strategies, effectively manage resources, and improve overall planning and performance.

Example of forecasting
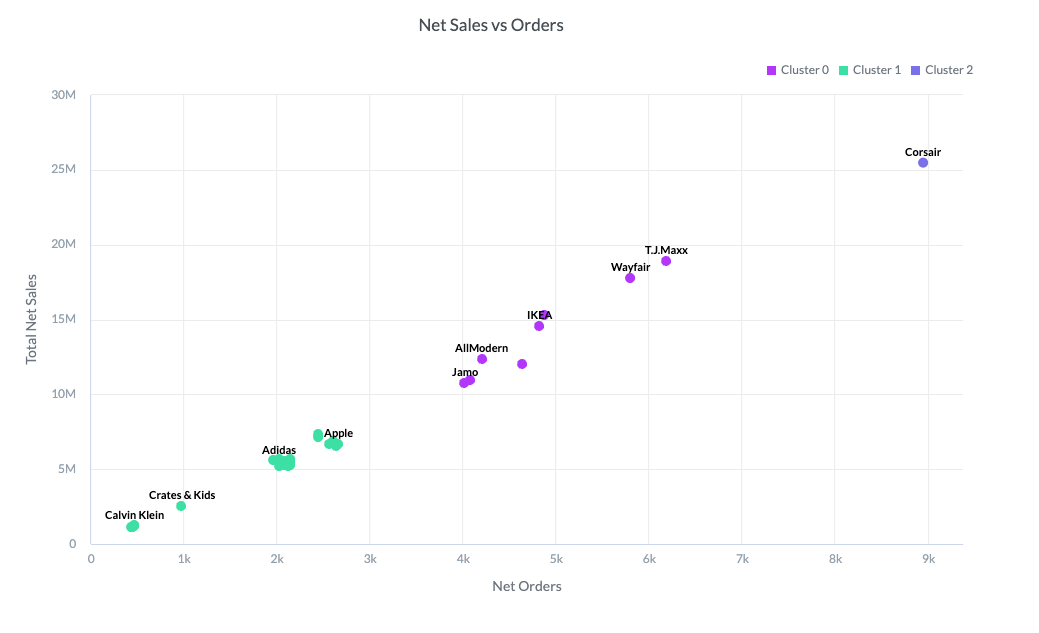
Clustering algorithms group data into meaningful segments based on similarities within the dataset. This helps identify natural patterns and groupings, such as customer segments, product categories, or behavioral clusters.

An example of clustering
One-click ML in dashboards
Many analytics platforms integrate machine learning technologies into dashboards to enhance data analysis and visualization capabilities. These capabilities are designed to be accessible to all users, offering ML insights with a single click. Examples of how ML is used in dashboards include:
- Detecting outliers: Users can automatically scan datasets to identify outliers (data points that significantly deviate from the norm). By detecting these anomalies, businesses can quickly identify potential issues such as fraud, data entry errors, or unusual trends that require further investigation.
- Highlighting data clusters: Machine learning in dashboards offers similar clustering capabilities to those in visualizations, but allows users to adjust settings directly within the dashboard interface.

An example of outlier detection
Smart data preparation
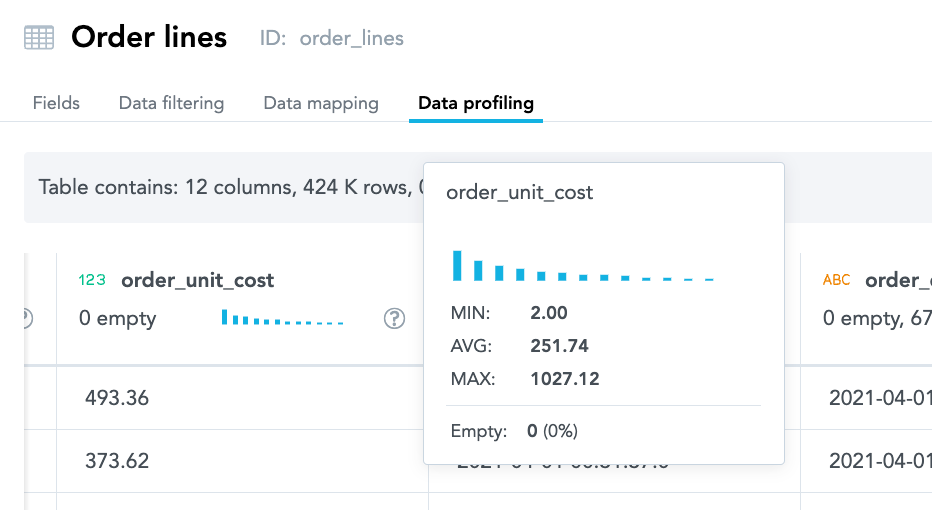
Smart data preparation uses augmented technologies to streamline and automate dataset management. It scans connected tables to create a detailed profile, highlighting key characteristics such as missing values, data types, and distribution.
Experience GoodData in Action
Discover how our platform brings data, analytics, and AI together — through interactive product walkthroughs.
Explore product toursAfter the data source is connected to an augmented analytics platform, it automatically offers the option to review the connected dataset. This includes understanding column contents, detecting empty values, and calculating statistics like minimum, maximum, and average values. You can also examine database tables to verify that your mental model matches the data, and use histograms to identify outliers. This process helps spot anomalies such as missing values, identify suspicious data, and verify table dimensions.

Checking suspicious outliers
Natural language interactions
Another key feature of augmented analytics is natural language interactions, which can be accessed within the analytics platform via built-in AI chatbots or through integration with other third-party tools.
The AI Chat Assistant, a native feature in analytics and BI tools, offers an innovative way to use generative chatbots for improved user interaction with data. By enabling users to ask questions in natural language, this tool simplifies the process of extracting insights and understanding data. Users can effortlessly ask questions of their data, see the answer sources, and generate visualizations through simple, conversational requests.

AI Chat Assistants allow all user types to interact with their data
Another approach to natural language interactions in augmented analytics is through third-party tools like Arria. This integration automates report generation and customization, offering descriptive and variance narratives, trend and ranking analysis, and correlation detection. Users receive insights in a conversational, easily digestible format, improving the user-friendliness of the analytical process. To learn more, check out Enhancing GoodData’s Semantic Layer With Natural Language.
Augmented analytics examples
Augmented analytics offers significant advancements across various sectors. In healthcare, it helps forecast patient outcomes, analyzes records and lab results for personalized treatment recommendations, and optimizes resource allocation. In finance, it assists with analyzing market trends, financial reports, and assessing various risks for better investment decisions. Insurance companies can use augmented analytics for fraud detection, risk prediction, and personalized offers. Marketing teams can use it to understand customer behavior, segment markets, and optimize campaign targeting. Augmented analytics can also be used across several other industries.
What are the benefits of augmented analytics?
- Faster insights: Augmented analytics significantly accelerates the data processing cycle, allowing businesses to gain insights at a much quicker pace. This rapid turnaround enables organizations to act swiftly, and in turn, deliver value to customers and stakeholders more efficiently.
- Improved decision-making: Augmented analytics enhances the accuracy of decision-making processes by leveraging advanced AI algorithms. It provides more precise predictions and well-informed recommendations, helping businesses to make better strategic decisions and anticipate future trends with greater confidence and accuracy.
- Deeper insights: Augmented analytics uncovers hidden patterns and trends within complex datasets that users might otherwise miss. This enables businesses to identify critical relationships and information that can drive innovative strategies and solutions.
- Improved data literacy: Augmented analytics empowers users of varying expertise levels to understand and interpret data more effectively, boosting overall data literacy within organizations. More employees can analyze, interpret, and communicate data findings confidently, leading to a data-driven culture and better decision-making across all levels of the organization.
What are the challenges of augmented analytics?
- Complexity: Augmented analytics may be powerful but it is only valuable if users can effectively use the tools. No matter how sophisticated, tools must be user-friendly to ensure broad adoption and meaningful use.
- Data quality and accuracy: High data quality is crucial for accurate AI and ML results. Poor data quality leads to inaccurate insights and erodes user trust. Implementing robust data governance ensures data is well-organized and reliable.
- Relevance: Insights from augmented analytics must align with the business context and user needs. If the tools produce complex and unclear results, it can be difficult to interpret and act on the information, reducing their effectiveness.
Next steps with GoodData
Are you interested in augmented analytics? Sign up for a free trial with GoodData to see for yourself how it can provide better business insights. Alternatively, if you have questions about augmented analytics or other BI-related topics, reach out to our sales team by requesting a demo.
Experience GoodData in Action
Discover how our platform brings data, analytics, and AI together — through interactive product walkthroughs.
Explore product tours

