The Best SQL Is the One You Do Not Have To Write and Maintain


Are You Tired of Writing SQL?
SQL has been the lingua franca for data manipulation for over 40 years now. Today SQL is an institution, one that very few people can imagine could replace. There is no denying though that its limitations are starting to show. Every experienced data engineer has reached a point of desperation when having to write the same SQL boilerplate code again and again, especially in the area of analytics with dynamic business requirements.
Let me give you a few examples of what I mean:

Count of flights that happened in the United States.

Count of flights by carrier OR by aircraft model manufacturer. The same metric (count of flights) in different contexts (Carrier / Aircraft model manufacturer) requires completely different queries.

Percentage of flights for each carrier from overall flights. Windowing function approach on the left, JOIN of subselects approach on the right. These simple questions result in queries that are complicated, hard to write, and even harder to maintain.
Simple SQL queries rapidly grow in complexity when real-world business requirements are applied to them.
Can We Solve It More Easily Using Another Language?
Yes, with next-generation analytical languages we can! Have a look at the following example, where we condense a complicated SQL query into three lines of code.
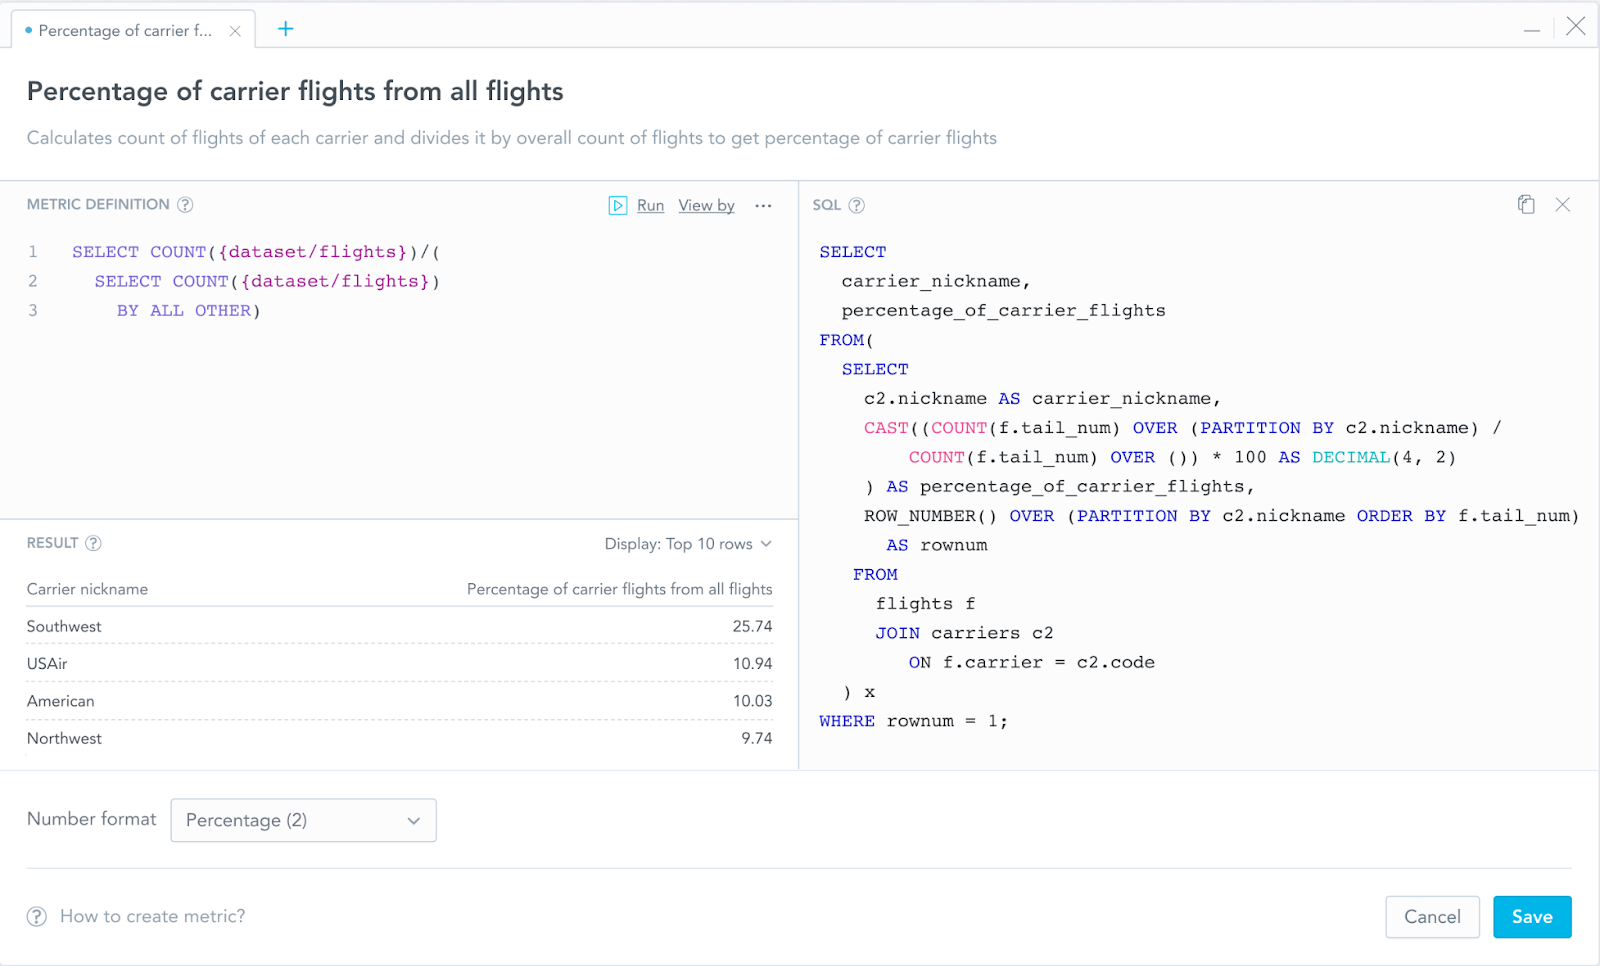
Very simple metric definition in the left top corner, context (View by) is defined separately, the corresponding SQL is on the right side and the query result preview is in the bottom left corner.
But how is something like this possible? How does the engine know how to connect all entities together and generate the SQL?
The answer lies in the semantic model.

Dataset relationships (arrows) enable platforms to generate SQL (JOINs).
Assumptions
Compared to SQL, new analytical languages are:
- Much simpler, more readable, and easier to maintain
- Capable of utilizing metrics that are reusable in multiple contexts (View/Slice by, filters, etc.)
- Capable of solving all important analytics use cases
The drawback is that you have to invest your time into learning a new language. Is the investment worth it?
Let Me Evaluate Such Languages for You
I will examine two of the most advanced languages:
- Looker Malloy
- GoodData MAQL
Specifically, I will guide you through the following three phases:
- Modeling
- Metrics
- Reports
You can then try it for yourself, the source code can be found here.
Example Model
Before we start with the aforementioned three phases, let me briefly show you what the underlying database model we are going to utilize looks like:

Federal Aviation Administration Model
Data collected from the Federal Aviation Administration.
Single “flights” fact table can be broken down by several dimensions — carriers, airports and aircrafts of various models.
Airports are playing two roles — origins and destinations.
Credit goes to developers from Malloy, who already prepared corresponding data files, models, and analytics use cases. Thank you!
The Three Phases
Modeling
We already have the physical data model, so why create yet another model (a logical data model on top of the physical data model)?
There are three reasons:
- Enable more users to analyze data
Create the model once, and reap the benefits forever.
It is much easier to build metrics and reports once the data has been modeled properly, and even business users can work with logical entities. - Store additional semantic metadata
Semantic properties like distinguishing facts/attributes/date dimensions.
Documentation.
Metadata can be utilized by various external systems striving for semantic information, for example in natural language processing (NLP). My colleague Jan Kadlec recently wrote a related article on NLP, I encourage you to read it! - Decouple analytics from physical models
Refactor the physical model without refactoring all analytics objects (metrics, visualizations, dashboards, …)
What does the logical data model look like?
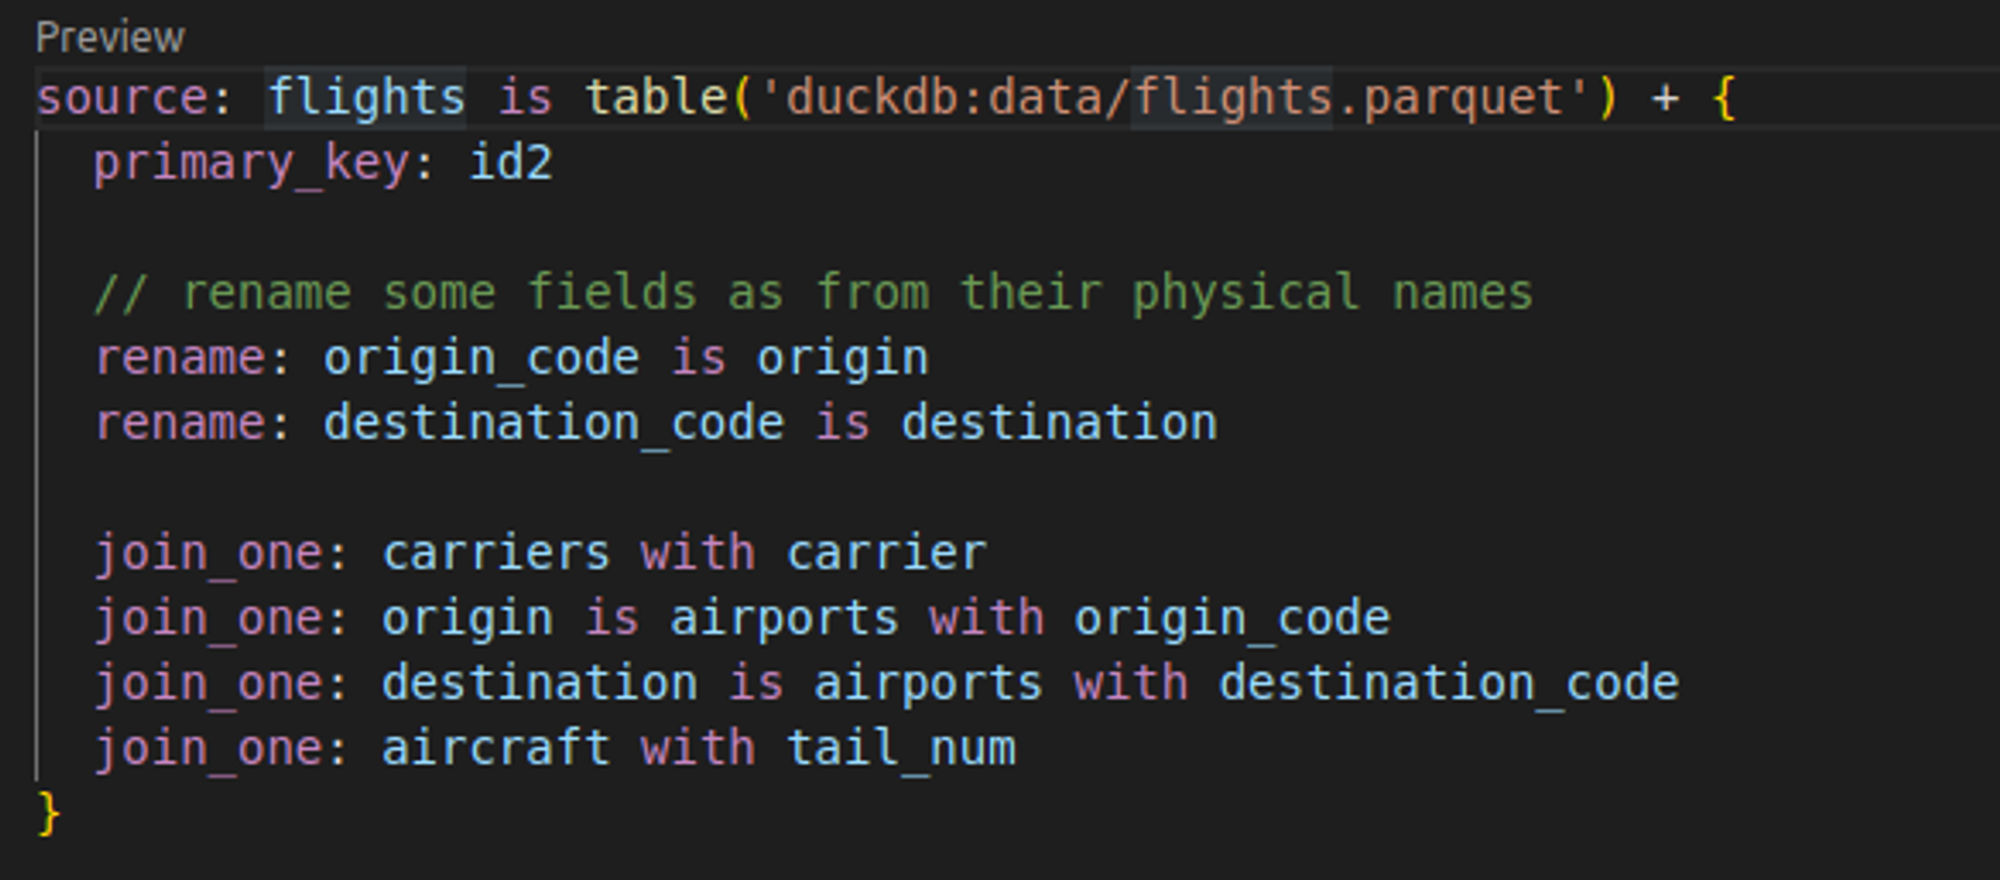
Malloy source (a logical dataset) on top of the flights table. Only primary key and references to other sources. Only two fields are renamed to simplify their usage.
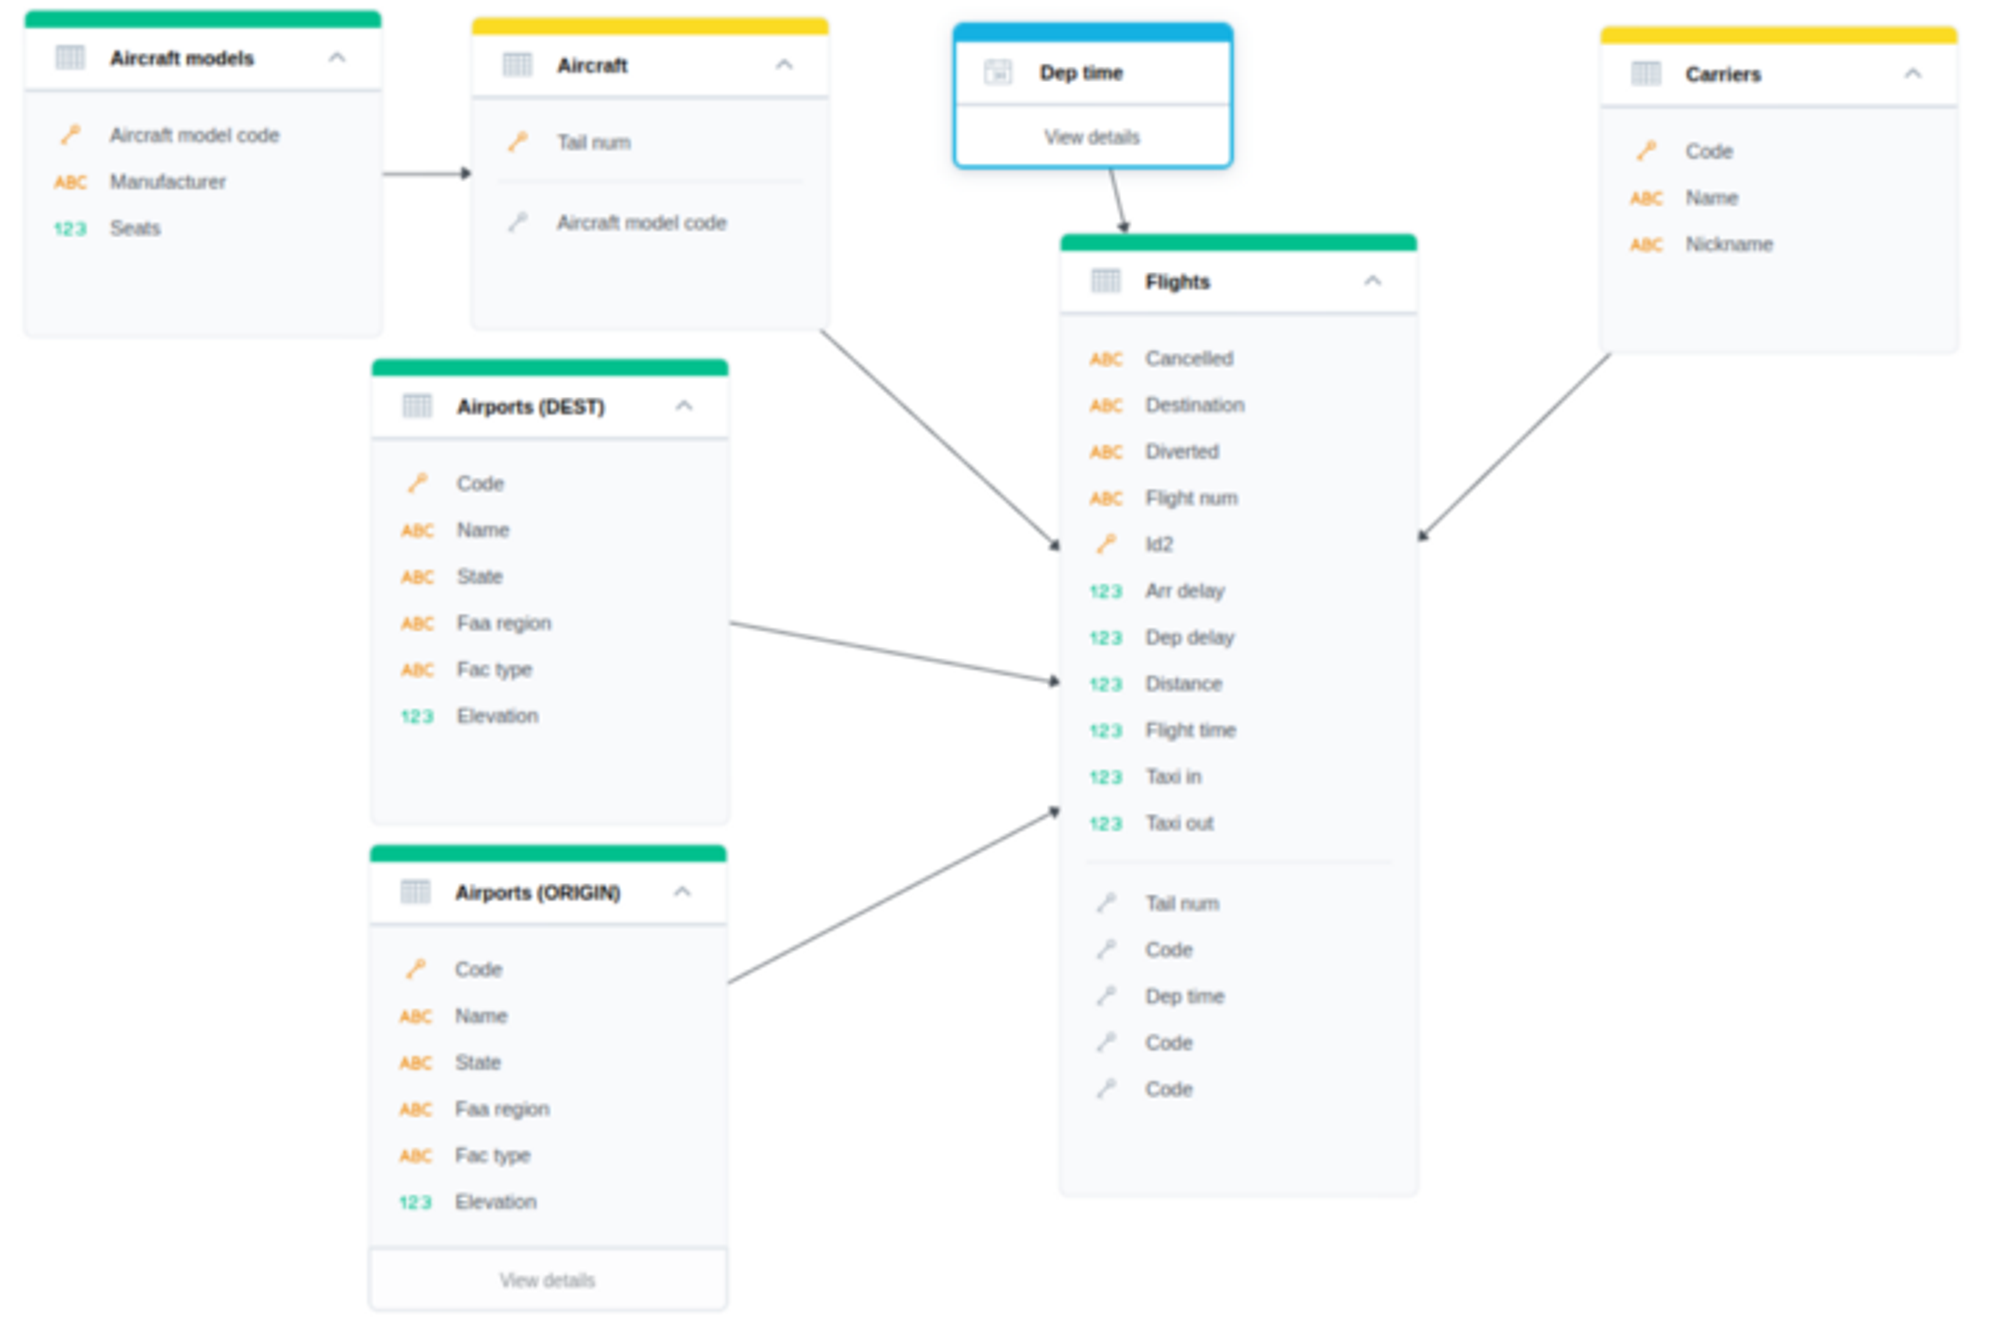
GoodData web UI for model visualization and editing.
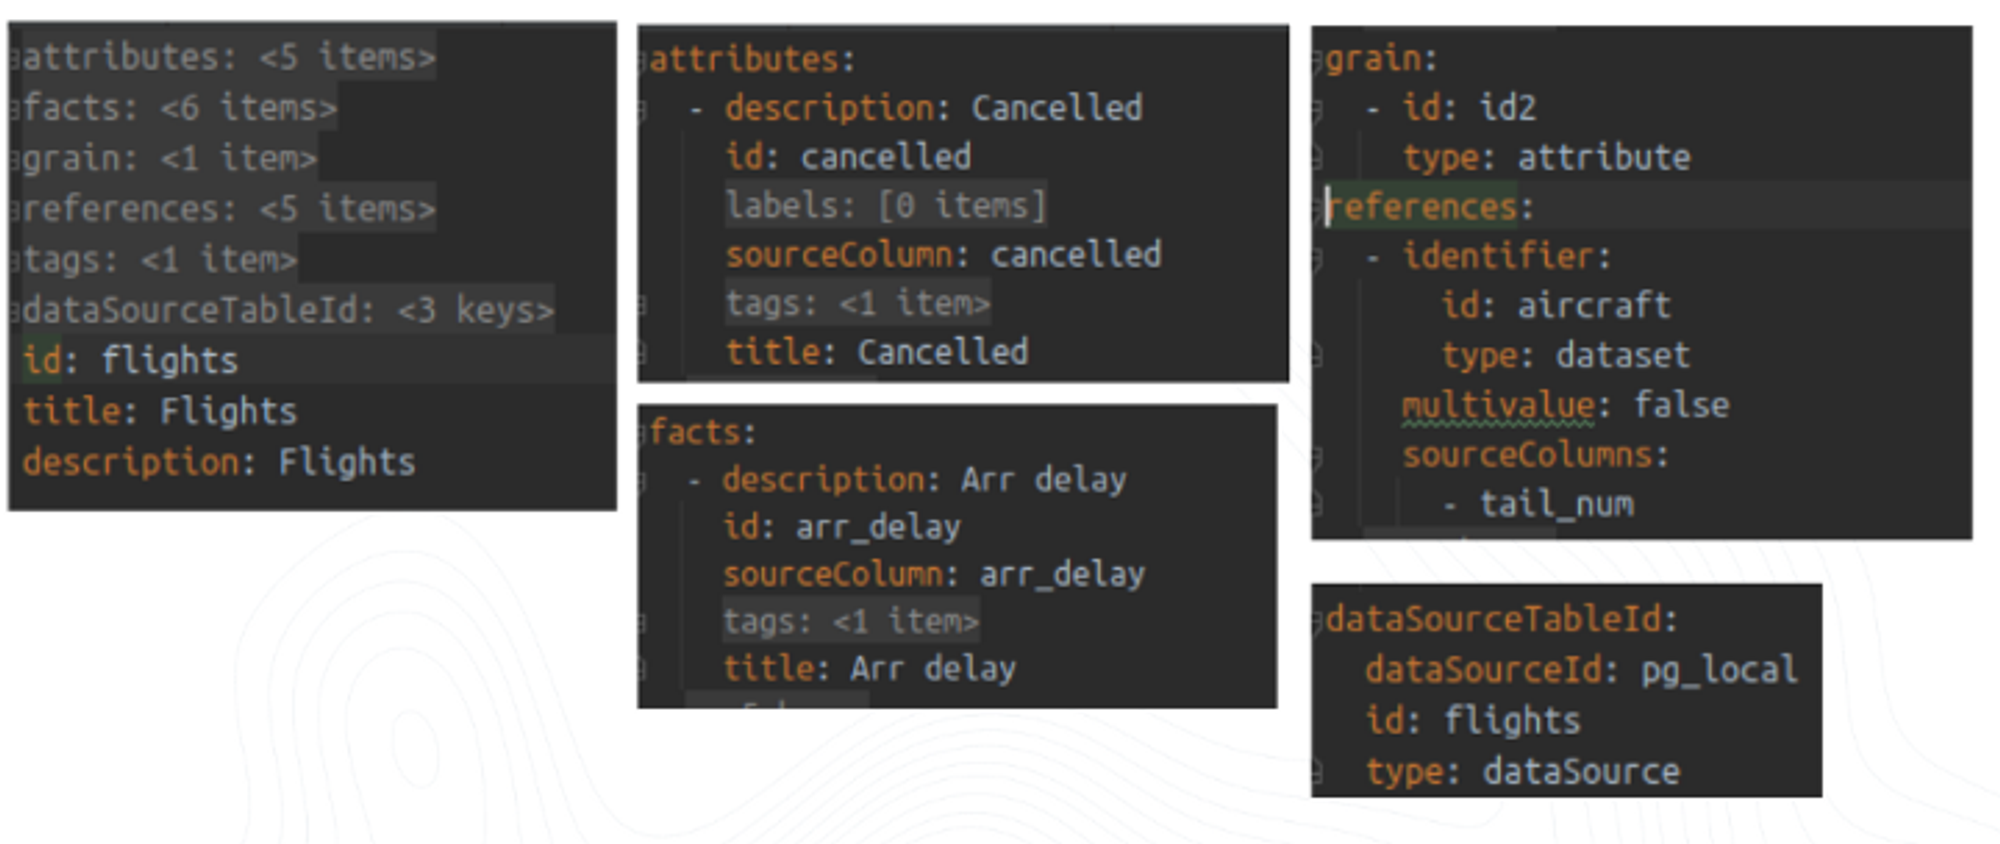
Declarative definition of GoodData dataset on top of the flights table. Primary key (grain) and references to other datasets. All entities must be declared, and attributes and facts must be distinguished. Datasets are mapped to tables, and attributes/facts to columns.
Modeling Comparison
I have put together a high-level overview of how logical data models are handled in GoodData and Malloy:
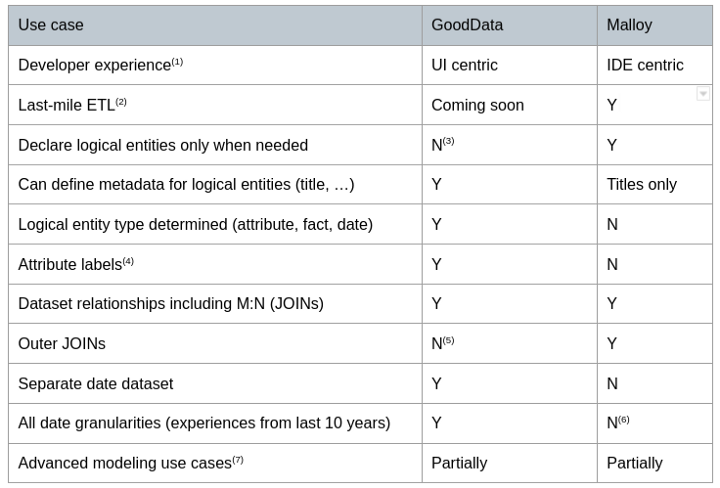
GoodData and Malloy Comparison
(1) Developer experience — Is it convenient for developers to manage the model?
Malloy provides a very good developer experience in IDE (VS Code with a Malloy plugin). Developers can write the model (and metrics, and reports, to be covered by the following chapters) in a single file and validate the solution (preview datasets/sources, execute reports). Moreover, the IDE plugin provides the corresponding IntelliSense — it reads physical data model entities and suggests them in the right places (for example it offers corresponding column names when trying to rename an entity to a better business name).
GoodData is more oriented towards UI experience and business users, but it also enables developers to store declarative definitions of models (and metrics, and reports) into YAML files, manipulate them and deliver them into any environment (CI/CD).
Additionally, GoodData provides two use cases — scanning the physical data model and generating a logical data model from the physical data model. It applies various rules to detect dataset (table) relationships, distinguish facts/attributes, etc. It is not perfect but it can significantly speed up onboarding.
(2) Last-mile ETL — i.e. transformations needed to prepare the physical model to be compatible with analytics use cases.
Some platforms require very complex transformations, for example, to denormalize everything into a single table due to the functional and performance limitations of these platforms. Neither Malloy nor GoodData requires such transformations — usually, we recommend to implement such transformations only on the dataset level, for example, to transform values 0 and 1 into Male and Female. Both platforms can work with Star/Snowflake schemas.
(3) Declare logical entities only when needed
You have to declare all entities and distinguish facts from attributes in GoodData.
This requires a slightly larger initial time investment, but it improves the experience for business users by allowing for a self-service drag&drop experience in the UI. We plan to simplify this experience even further in the near future.
(4) The concept of attribute labels in GoodData.
Attribute labels are a unique feature on the market. Users can declare that an attribute has one or more labels. GROUP BY is always applied to the column that is mapped to the attribute, e.g. customer_id.
Users can decide to display a label by default, e.g. customer_name. Users can define other types of attributes providing special capabilities, e.g. URL or geo-location.
We would like to discuss it with other vendors, including Malloy, whether it is a strong enough concept.
(5) Outer joins
While Malloy does, GoodData does not allow users to declare a relationship between datasets as “outer”, because we believe that users often use both inner and outer joins based on a business case implemented by a metric or a report. That is why we plan to soon provide an option to specify “outer” in metrics and also in reports (“show empty values”).
(6) Periodical granularities
Malloy does not support periodical granularities like dayOfWeek, weekOfYear, …
(7) Advanced modeling use cases
There are so many and no analytics platform supports all of them. This is a huge opportunity for discussion!
Examples:
- Role-playing dimensions
e.g. user -> creator/last updater - Aggregate awareness
single dataset mapped to multiple tables, e.g. aggregated by day, week, month, … - Additive/non-additive facts
affects in which context facts/metrics can be used
Experience GoodData in Action
Discover how our platform brings data, analytics, and AI together — through interactive product walkthroughs.
Explore product toursMetrics/Measures
Why should users invest in writing metrics? Because they can be reused in multiple reports!
Also, metrics support the single source of truth paradigm — when you define e.g. revenue metric once and it is reused across the organization, it cannot happen that two business departments bring two different revenue values to the board meeting.
What do metrics look like in Malloy and GoodData?

Malloy calls metrics ‘measures’. Both simple and more complex measures can be declared. Measures must be defined as a part of a source (dataset).

GoodData Metric UI editor. The metric definition is in the left top corner. “View by” enables you to put metrics into context (hereby Carrier nickname). The result preview is in the bottom left corner. The corresponding SQL statement is in the panel on the right.

Declarative definition of GoodData metrics. Both simple and more complex metrics can be declared. Besides metric ID and metric source code, additional semantic properties can be defined (format, description).
Metrics Comparison
Here is a high-level overview of how metrics/measures are handled in GoodData and Malloy:

Metrics Comparison
(1) Advanced analytics use cases
Whatever you imagine you can achieve in SQL (analytics use cases only!), you should be able to achieve with Malloy/GoodData.
Examples:
- Calculate contribution, e.g. city to region
- Period-over-period comparisons
- Filter by complex metric
(2) IntelliSense
Both GoodData and Malloy provide a very good IntelliSense.
In GoodData, we followed the concept of language servers, and now we utilize it in our web IDE. We have implemented a PoC of VS Code plugin as well and we know it is feasible. We believe that this is something all languages/platforms should provide.
Moreover, GoodData provides two additional advanced use cases:
- labelElements
suggests attribute(label) values - validObjects
suggests attributes/facts/metrics based on the context already existing in a metric.
Based on the model, we know which entities can be appended into a context.
(3) Outer joins
GoodData is going to provide an explicit language syntax to enable outer joins. Malloy provides outer join by default, developers have to utilize filters (where the joined entity is not empty) to enforce inner join.
This is an interesting difference — what should be the default? Let’s discuss it!
(4) Metrics reusable in multiple contexts
The concept of shared dimensions is not supported by Malloy, meaning that Malloy metrics cannot utilize entities from 2 or more fact tables connected by shared dimensions. See the shared dimension use case example below.
(5) Language “completeness”
It seems like it is possible to write any amount of complexity into GoodData metrics, see an example below. The Malloy measure definition is more strict. The question is if the same complexity can be achieved in Malloy by nesting metrics.
Metrics Reusability — Shared Dimension Use Case
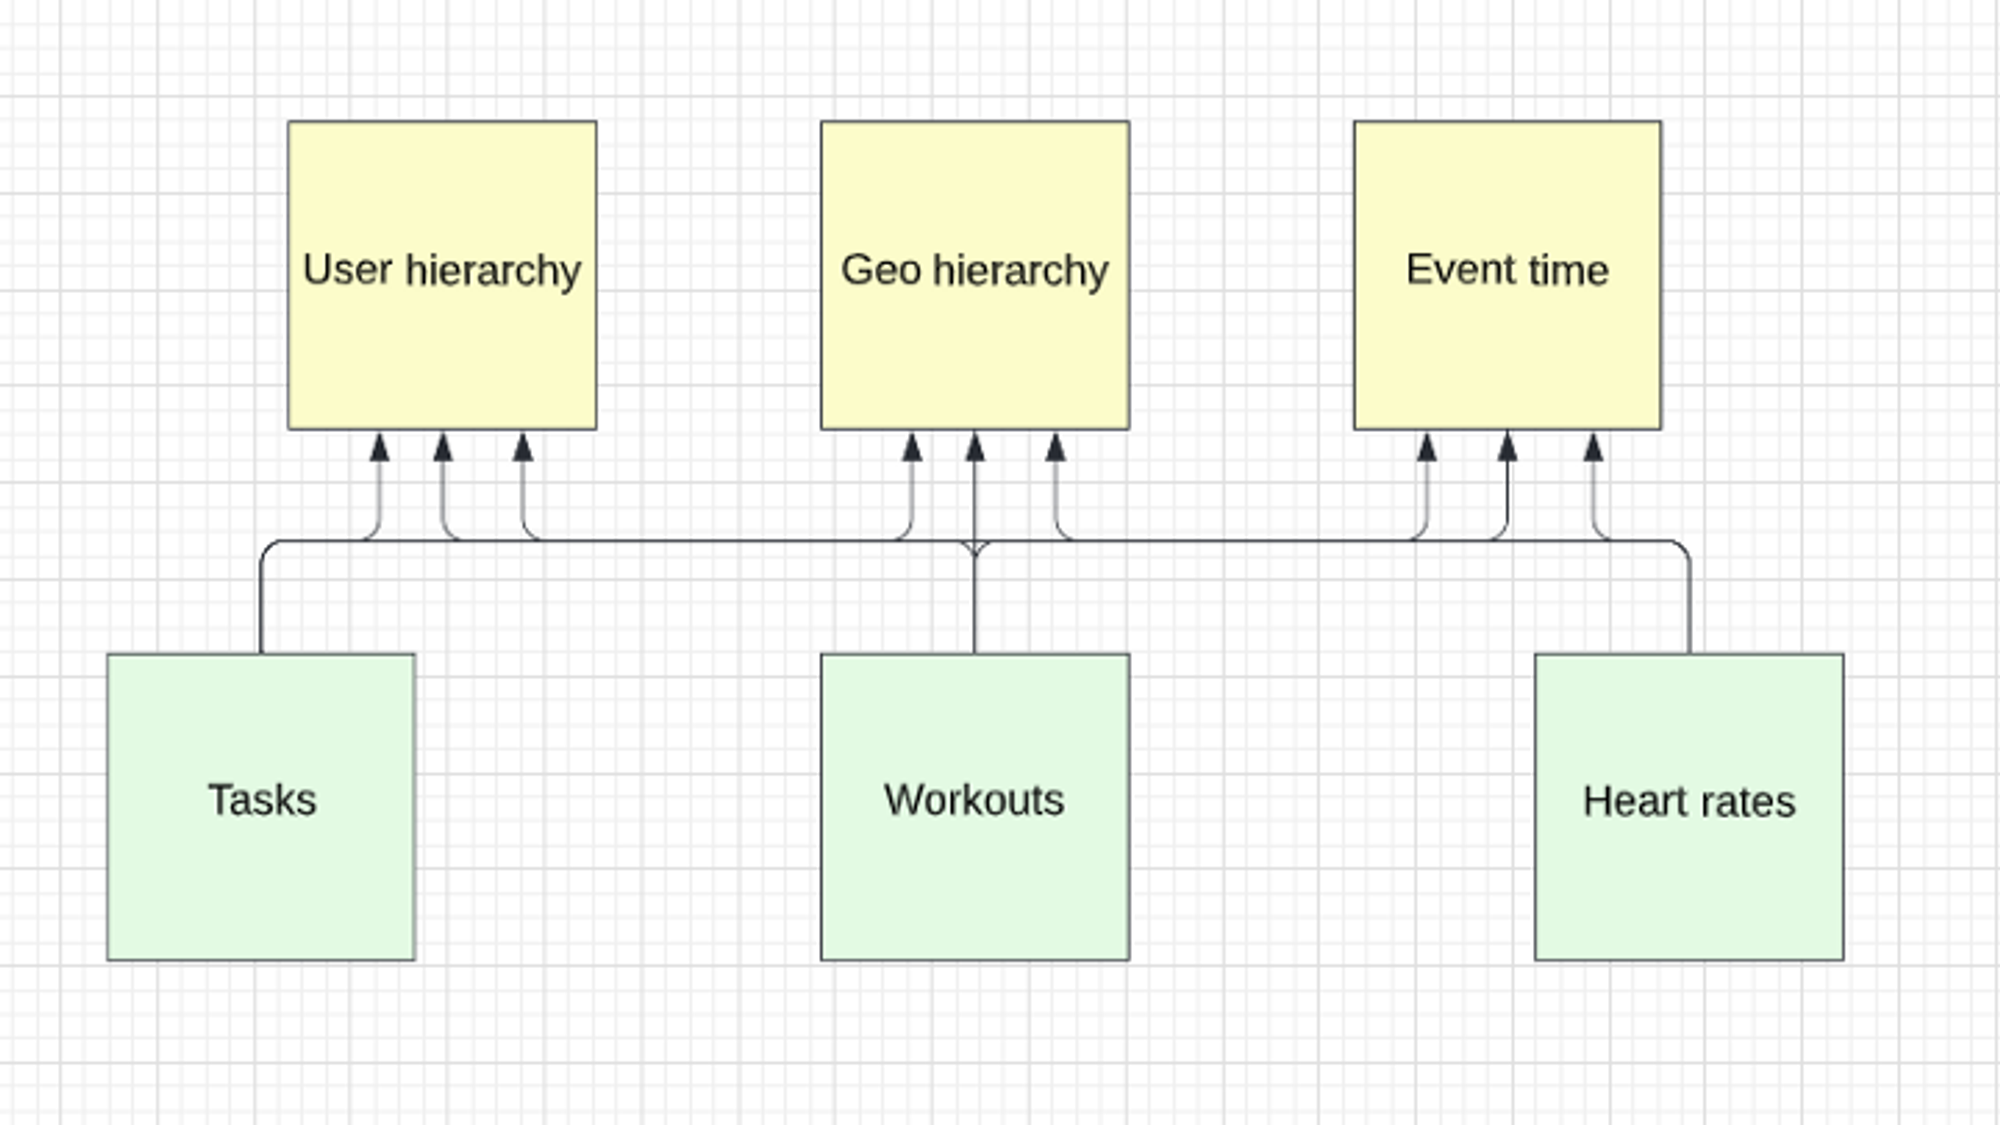
Metrics Reusability — Shared Dimension Use Case
In Malloy, if we model tasks, workouts, and heart rates as separate sources, we cannot build metrics utilizing entities from all these sources.
For example, try to correlate workouts and heart rates by time or by the user.
We would have to create a source on top of the user and join workouts and heart rates. We could not do it at all with the time dimensions (it is virtual).
This is possible without any limits in GoodData and it seems that it is possible in PowerBI(DAX) as well.
Complex MAQL Metric Example in GoodData

Complex MAQL Metric Example in GoodData
In GoodData MAQL language, you can combine any language constructs together, nest by “sub-selects”, even in filters.
Malloy requires a quite strict form of measure definition. You can implement complex expressions, and you can define a filter as a part of a measure, but you cannot nest measures in such a straightforward manner as is possible in GoodData MAQL, or at least that is my impression.
Reports (Queries, Visualizations)
Finally, we get to the real business value — reports (queries in Malloy, visualizations in GoodData). Reports are metrics (built in the above chapter) in context — viewed/sliced by attributes, filtered, sorted, etc.
Here is how reports look like in Malloy and GoodData:

Query (report) in Malloy is in the bottom left corner, putting three metrics into the Carrier nickname context (viewing / slicing it by Carrier nickname). The result preview is in the right panel, where developers can display the corresponding SQL statement as well.

GoodData metric editor also provides a way to prototype reports. Developers can put metrics into context with View by and see the corresponding result preview and SQL statement.
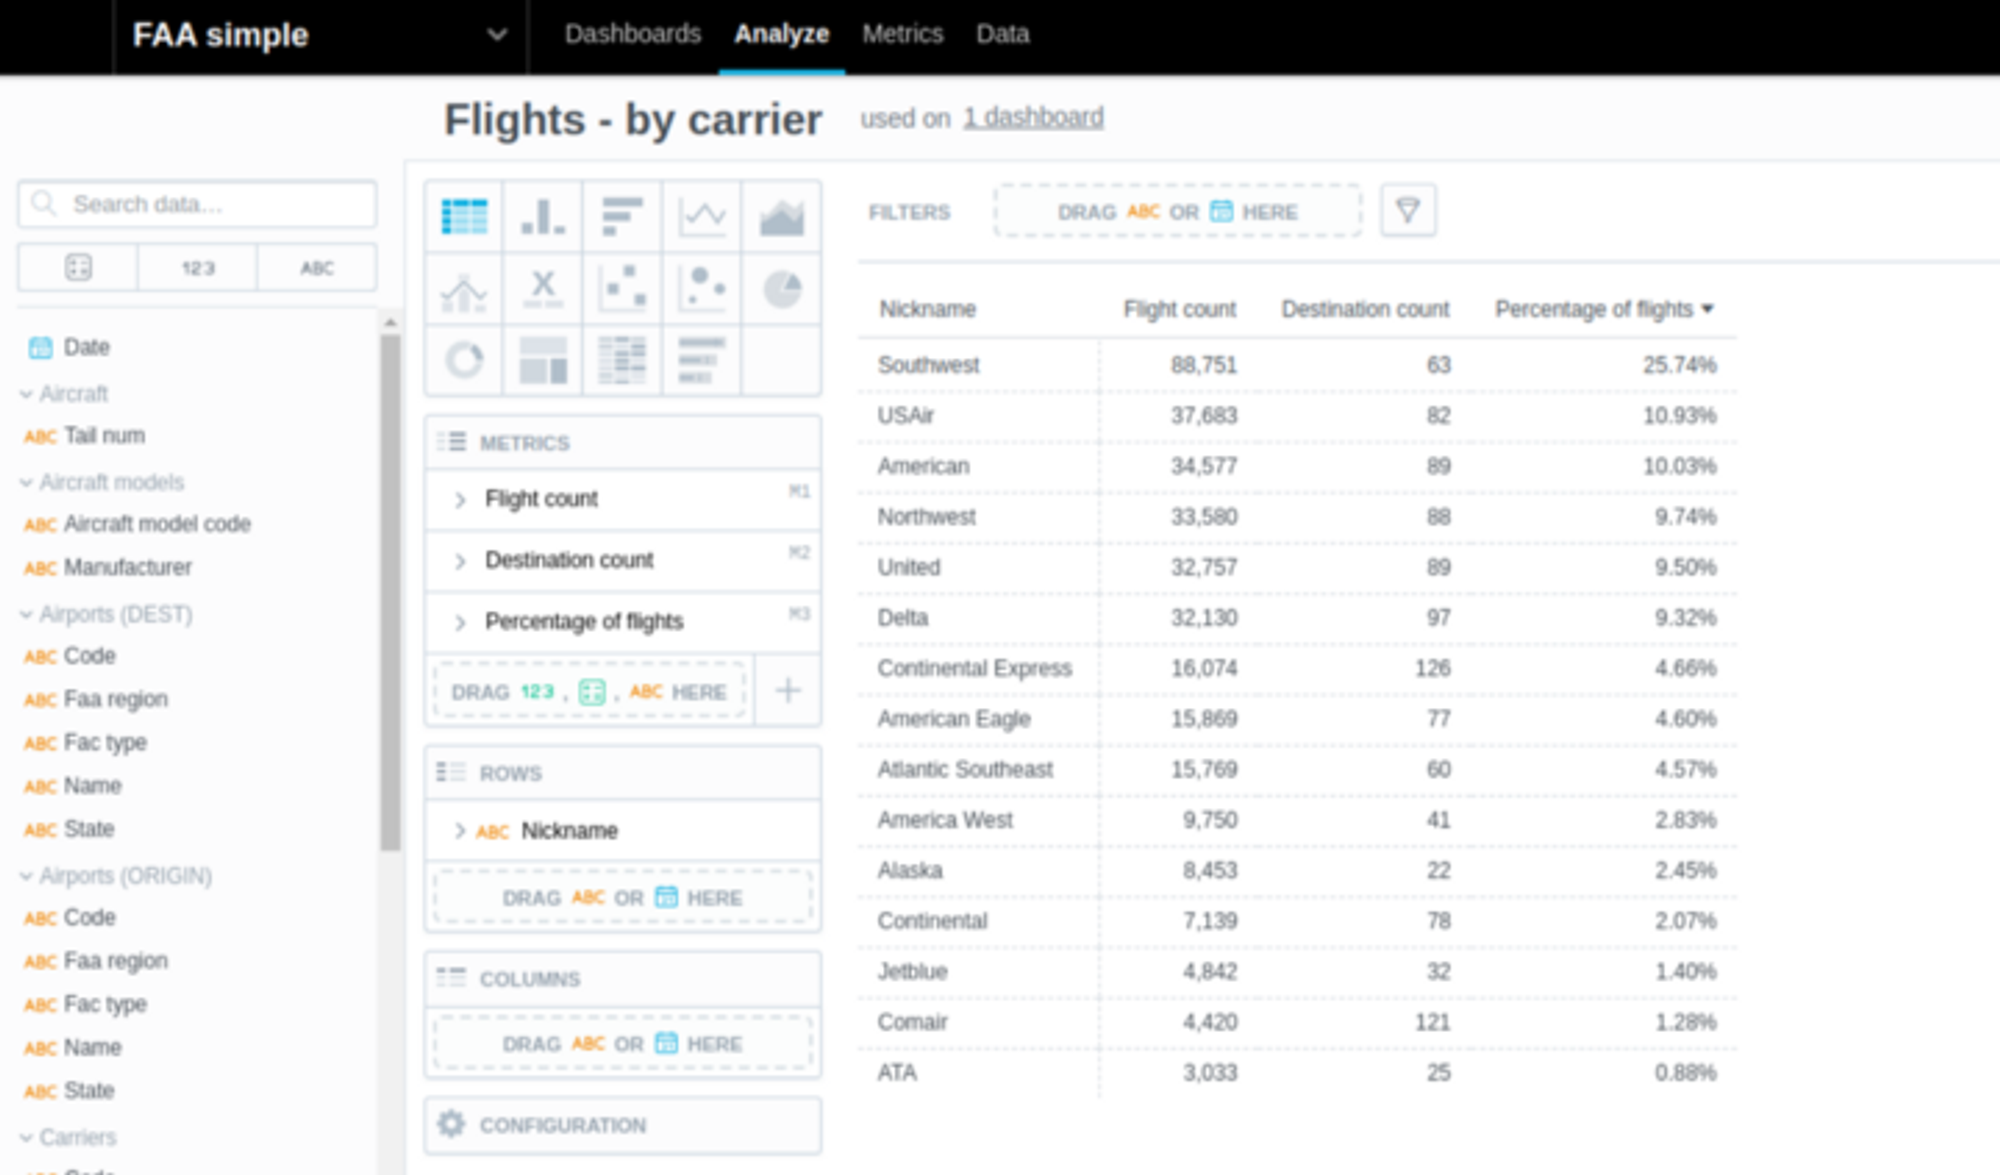
GoodData Analytical Designer for reports (visualizations) building. Drag&drop experience for business end users (drag&drop from the left panel containing facts/attributes/metrics).
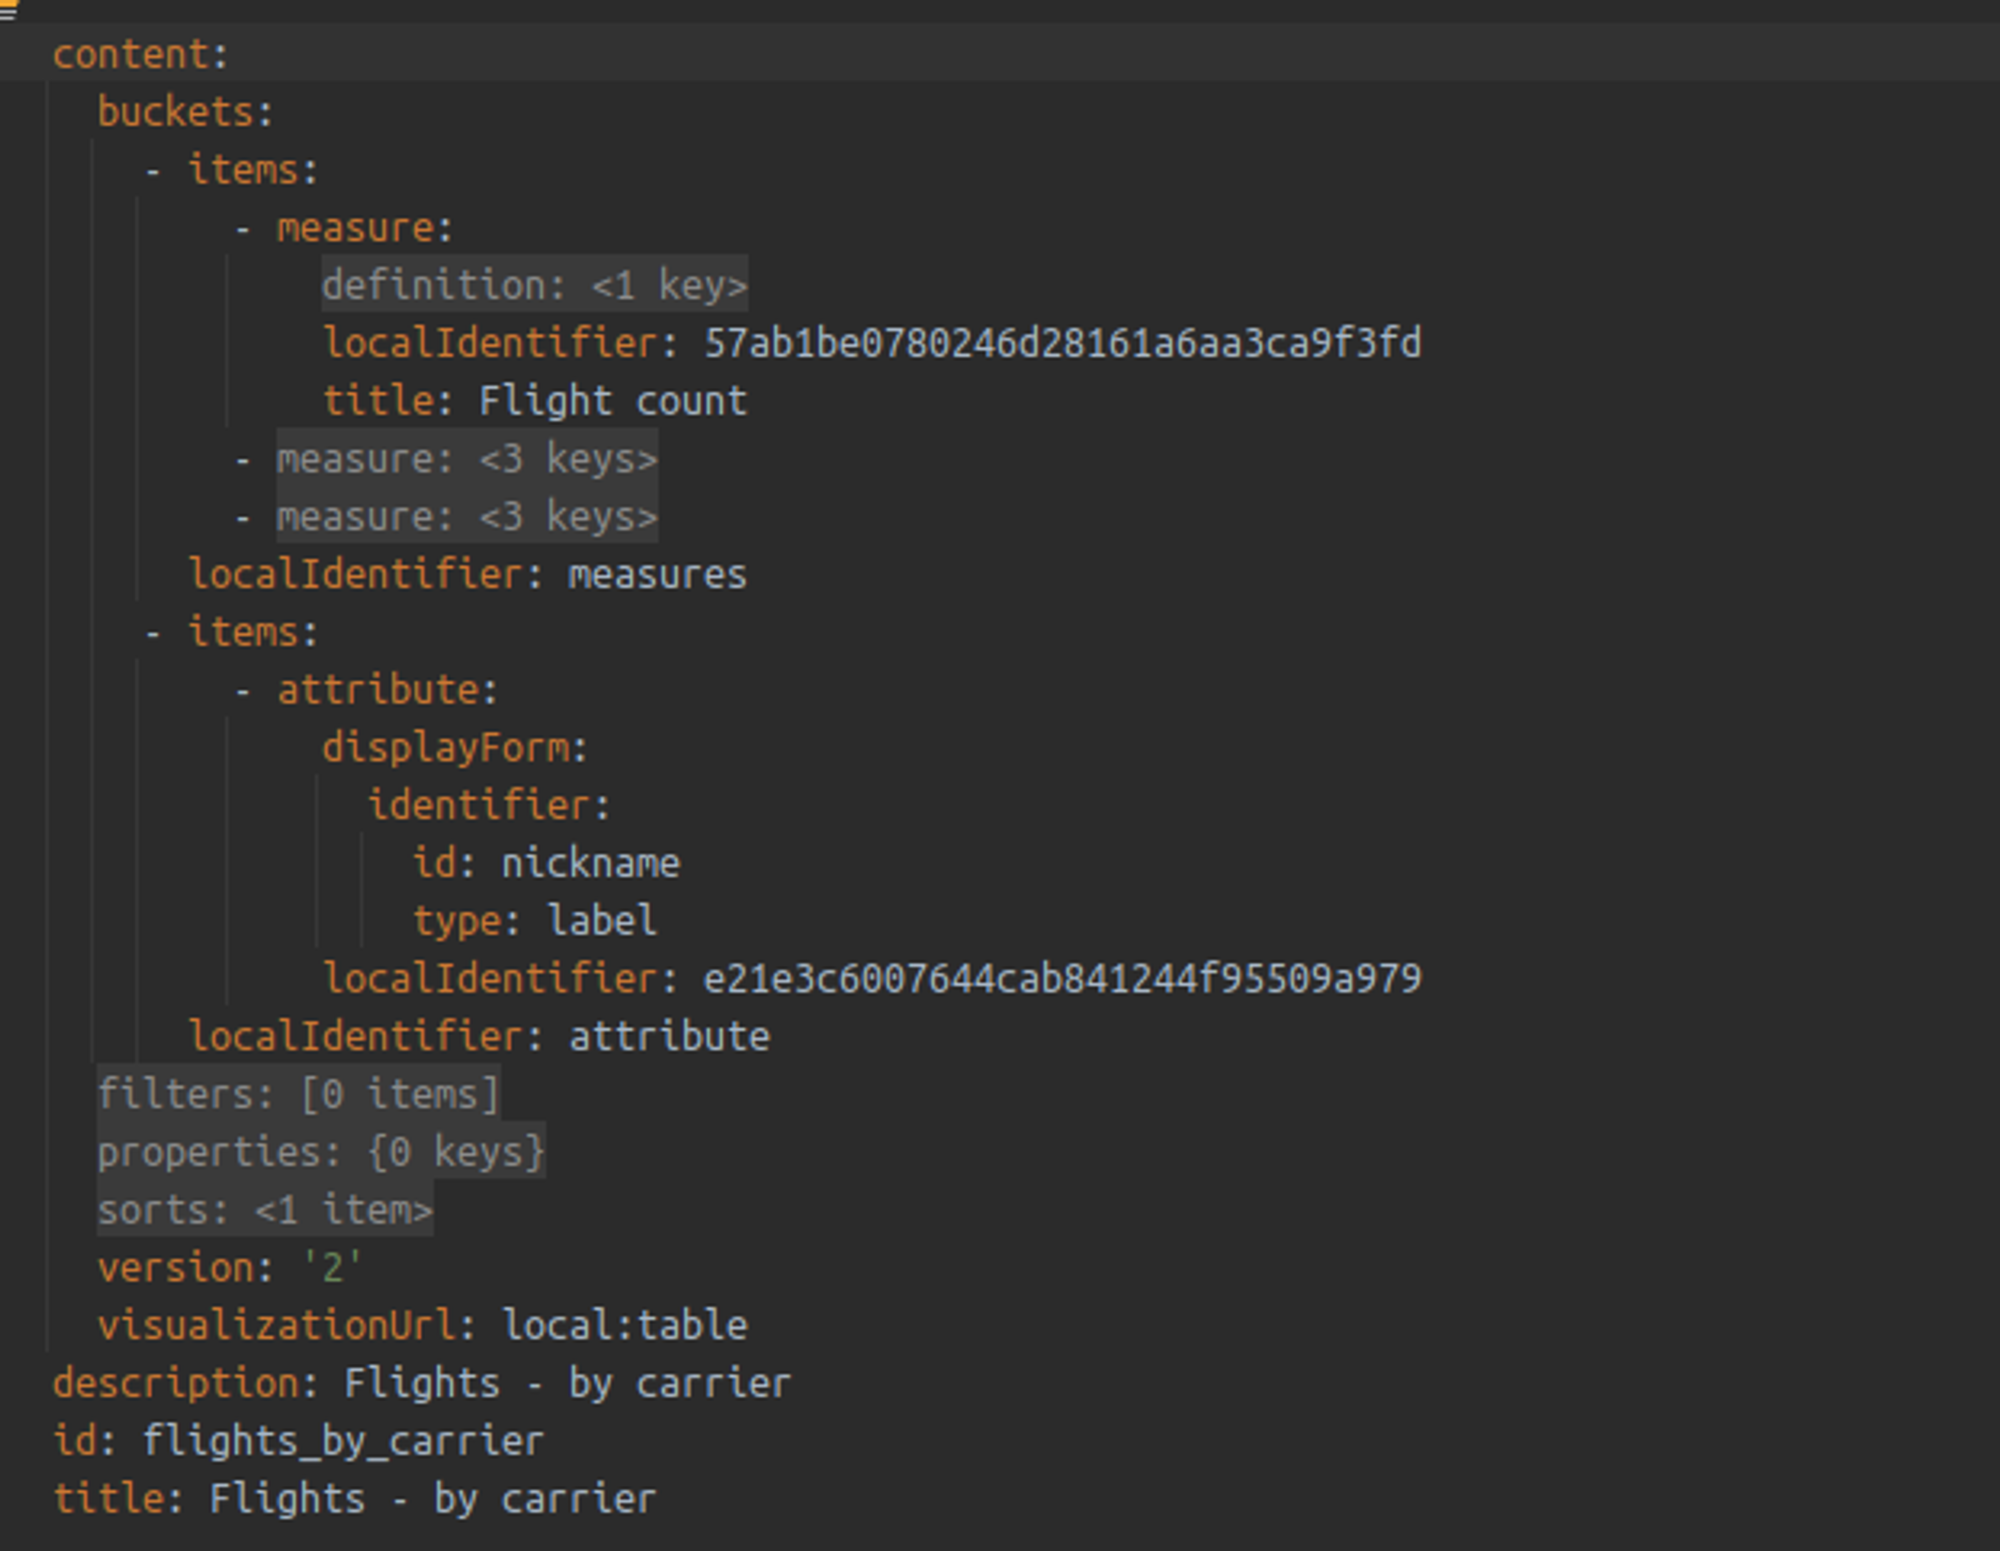
GoodData declarative definition of the same report (called insight in GoodData). It contains three metrics and the Carrier nickname attribute.
Reports Comparison
And finally, here is a high-level overview of how reports are handled in GoodData and Malloy:

Reports Comparison
(1) Pure report object
The GoodData report object (visualization) also contains presentation properties like colors. There is no pure report object which could be reusable.
(2) Reuse reports in another reports
Malloy provides a concept of pipelined queries, each with a full feature-set (group by, filters, …). Very powerful! GoodData does not provide anything like this.
(3) Ordering and limiting
GoodData reports cannot be ordered by multiple entities (attributes/metrics).
On the other hand, GoodData provides functions like RANK, which can provide more flexibility, even inside metrics.
(4) Report nesting
We are not convinced it is a good design to nest reports in other reports. However, it can save a lot of pings from clients to the server.
Report Nesting

Malloy nesting. Interesting concept, but we are not sure if it should not be only a feature of the visualization layers.
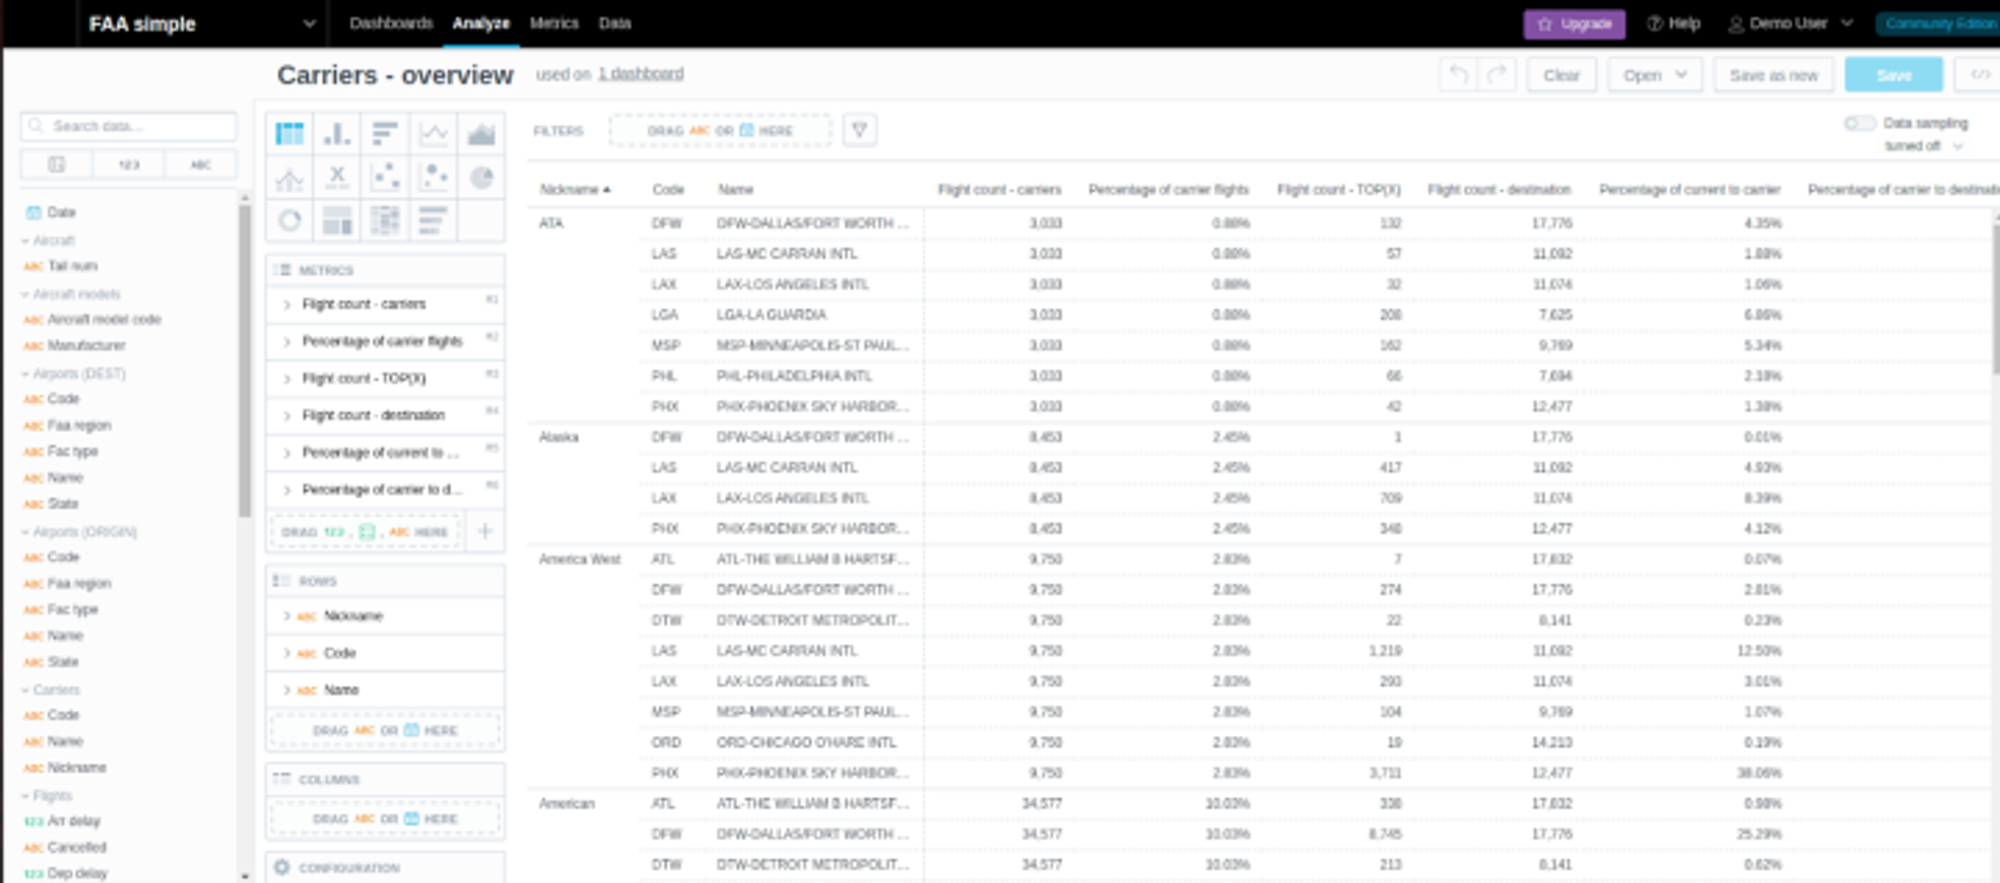
The same report in GoodData. The visualization layer could display the result in the same way as Malloy.
GoodData Pivoting
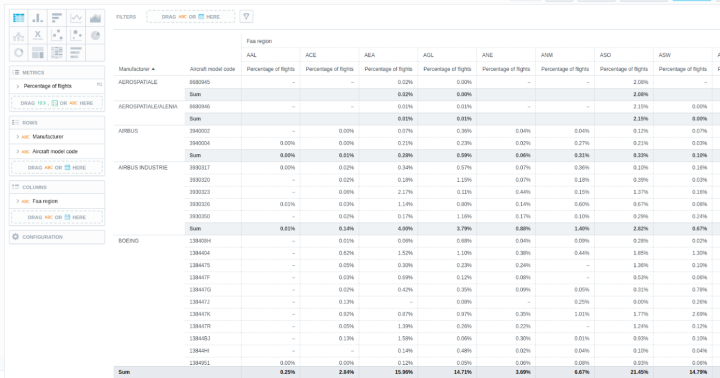
Table with pivoted FAA region attribute. Sub-totals and grand-totals are calculated as well. It is even possible to sort by the pivoted attributes.

The same pivot (by FAA region) is displayed as a nice TreeMap.
Conclusion
Follow the Malloy/MAQL Approach
Both languages bring significant added value to (not only) developers. They are relatively to pick up and start using and offer a very easy-to-use and maintainable approach to data analytics going forward. Both languages are developer friendly, though we at GoodData are going to learn from Malloy on this front ;-)
There are more alternatives to SQL, like dbt metrics, Microsoft DAX, etc. You may expect follow-up articles.
You should consider learning these languages, it is worth it!
Current Shortcomings of the Malloy/MAQL Approach
Generally, Malloy is not yet ready for a self-service experience. Maybe a decision will be made to port Malloy into Looker and make this experience available.
Malloy, by design, does not support metrics on top of multiple fact datasets (with shared dimensions). I would like to discuss this design decision with people from Malloy, as there is a lot of potential for growth in this area! By the way, PowerBI supports it. ;-)
In GoodData, it is not possible to write the logical data model, metrics, and reports in a unified and programmatic way and test it directly in an IDE. We want to focus on this in the near future. For instance, thanks to the concept of a language server, we already implemented a PoC of VS Code plugin for MAQL.
Regarding the analytics feature set: both languages cover even more advanced analytics use cases (contribution, period over period, …). As vendors of such languages, we should listen to developer needs and add support for missing use cases. If that’s done, developers do not have to context-switch between these languages and SQL too often (or hopefully, eventually, never).
Let’s Join Forces
The semantics are similar in all these languages. We, as language providers, should start talking together. We should find a balance between focusing on developers and on the end business users. We should enable generating one language from another.
What about open-sourcing the language interpreters under Apache 2.0 license?
Could we converge to a new standard? Let’s try it!
Try GoodData Yourself!
My aforementioned demo that this article was based on.
GoodData Cloud trial — cloud SaaS version.
Experience GoodData in Action
Discover how our platform brings data, analytics, and AI together — through interactive product walkthroughs.
Explore product toursIf you are interested in GoodData.CN, please contact us. Alternatively, sign up for a trial version of GoodData Cloud: https://www.gooddata.com/trial/


