8 Real Estate Dashboard Examples That Drive Smarter Decisions
Written by Tom Czaban |

Dashboards play a crucial role in the real estate sector, providing a real-time centralized view of key data across areas like residential sales, commercial property management, investment analytics, and facility operations. With a well-designed dashboard, real estate professionals can quickly track market trends, property valuations, occupancy rates, and financial performance. For property managers, dashboards streamline operations by visualizing maintenance schedules, lease expirations, and tenant requests. While real estate investors can benefit from data-driven insights into portfolio performance, rental yields, and risk assessments.
Building effective dashboards requires real estate data analytics software that can seamlessly integrate with multiple data sources, such as CRM systems, property databases, and financial tools. An optimal solution will offer customizable visualizations, automated reporting, and predictive analytics.
This article explores key examples of real estate dashboards, highlighting how they support strategic decision-making and streamline operations.
Most Common Types of Real Estate Dashboards
1. Real Estate Portfolio Dashboard
This provides property investors and managers with a comprehensive view of how their assets are performing in real time. KPIs include Total portfolio value, which gives a snapshot of the overall worth of all properties, and Return on investment, which measures profitability over time. The Capitalization rate helps assess the potential return based on rental income and property value, while Occupancy rate tracks tenant retention and leasing efficiency.
Additionally, a real estate portfolio dashboard tracks maintenance and management costs to keep operational expenses in check and displays projected cash flow to provide insights into future revenue and liquidity. Visualizing these key metrics in one place enables investors to make data-driven decisions, optimize asset allocation, and maximize long-term returns.
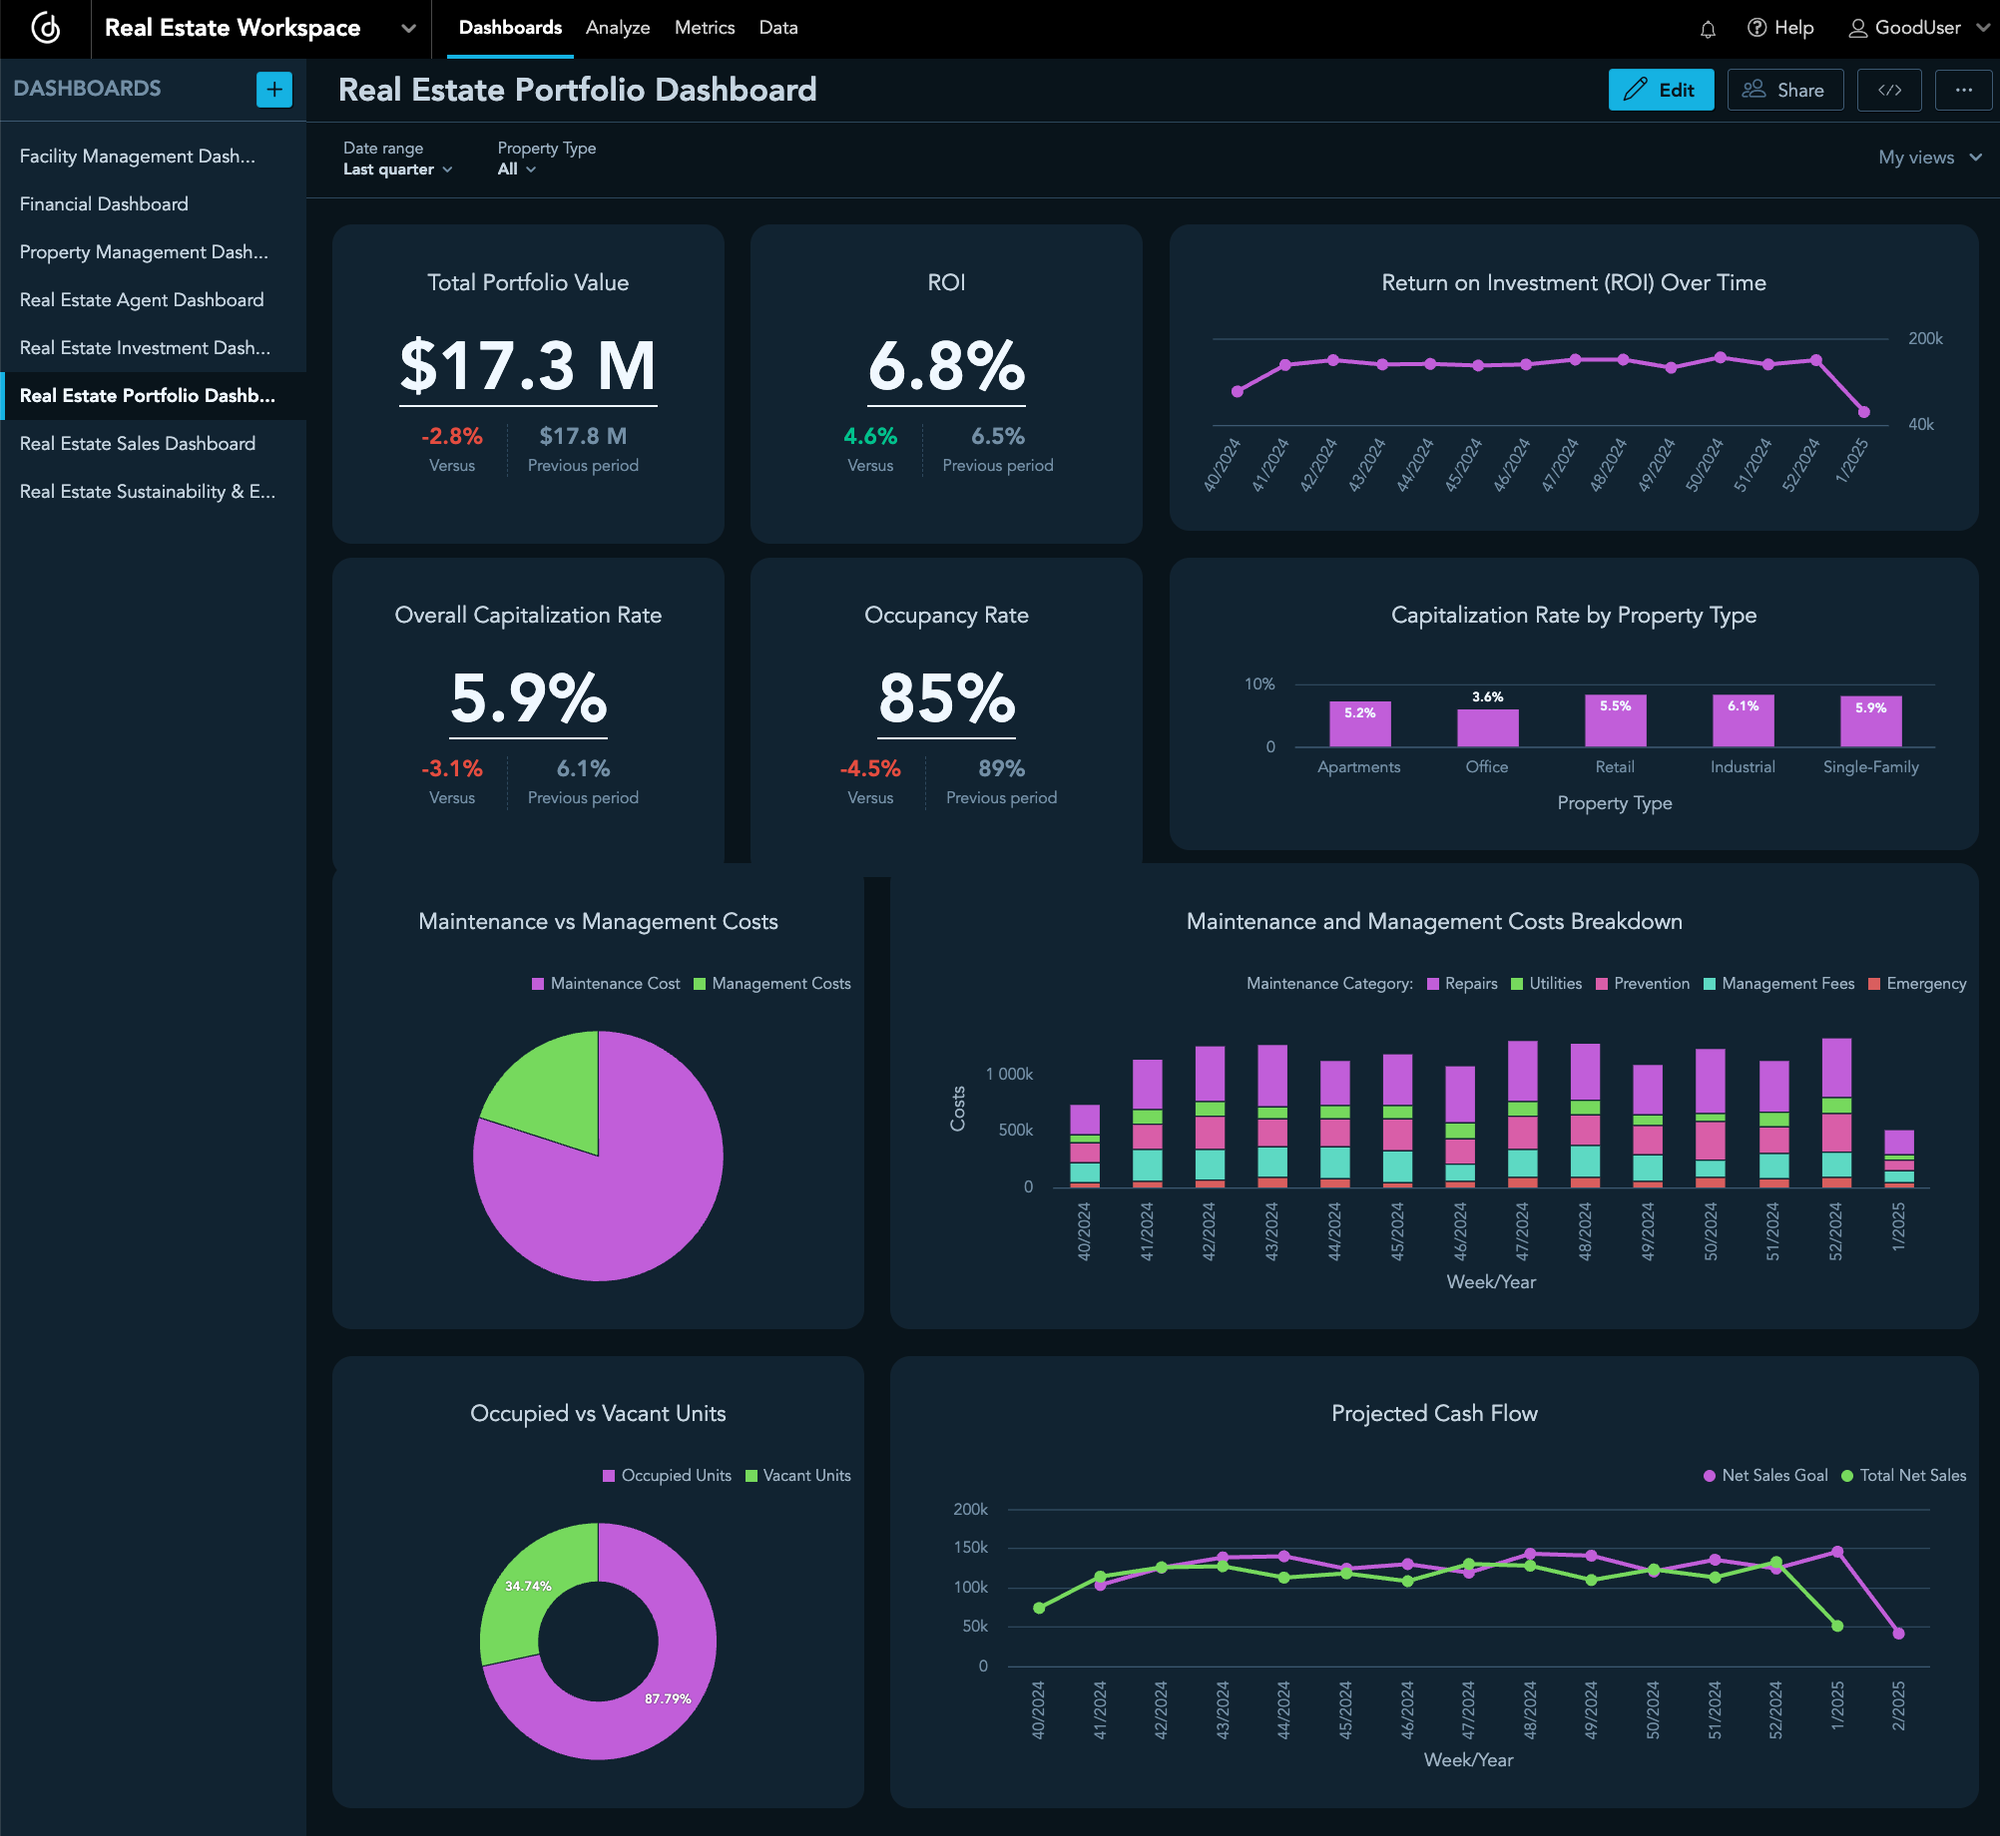
Real Estate Portfolio Dashboard
2. Real Estate Investment Dashboard
This dashboard helps investors track and optimize the performance of their properties by showing key financial and operational metrics. It provides real-time insights into Rental income, allowing investors to monitor revenue streams across different properties. Average cost per unit provides a clear picture of the expenses related to property acquisition and maintenance. While Net operating income shows the remaining profit once operating expenses have been deducted. The dashboard also usually visualizes Occupancy vs. vacancy to highlight leasing performance and rental demand. Another critical KPI is Holding period of assets, which tracks how long properties have been in the portfolio and helps with decision-making about when to sell or reinvest.
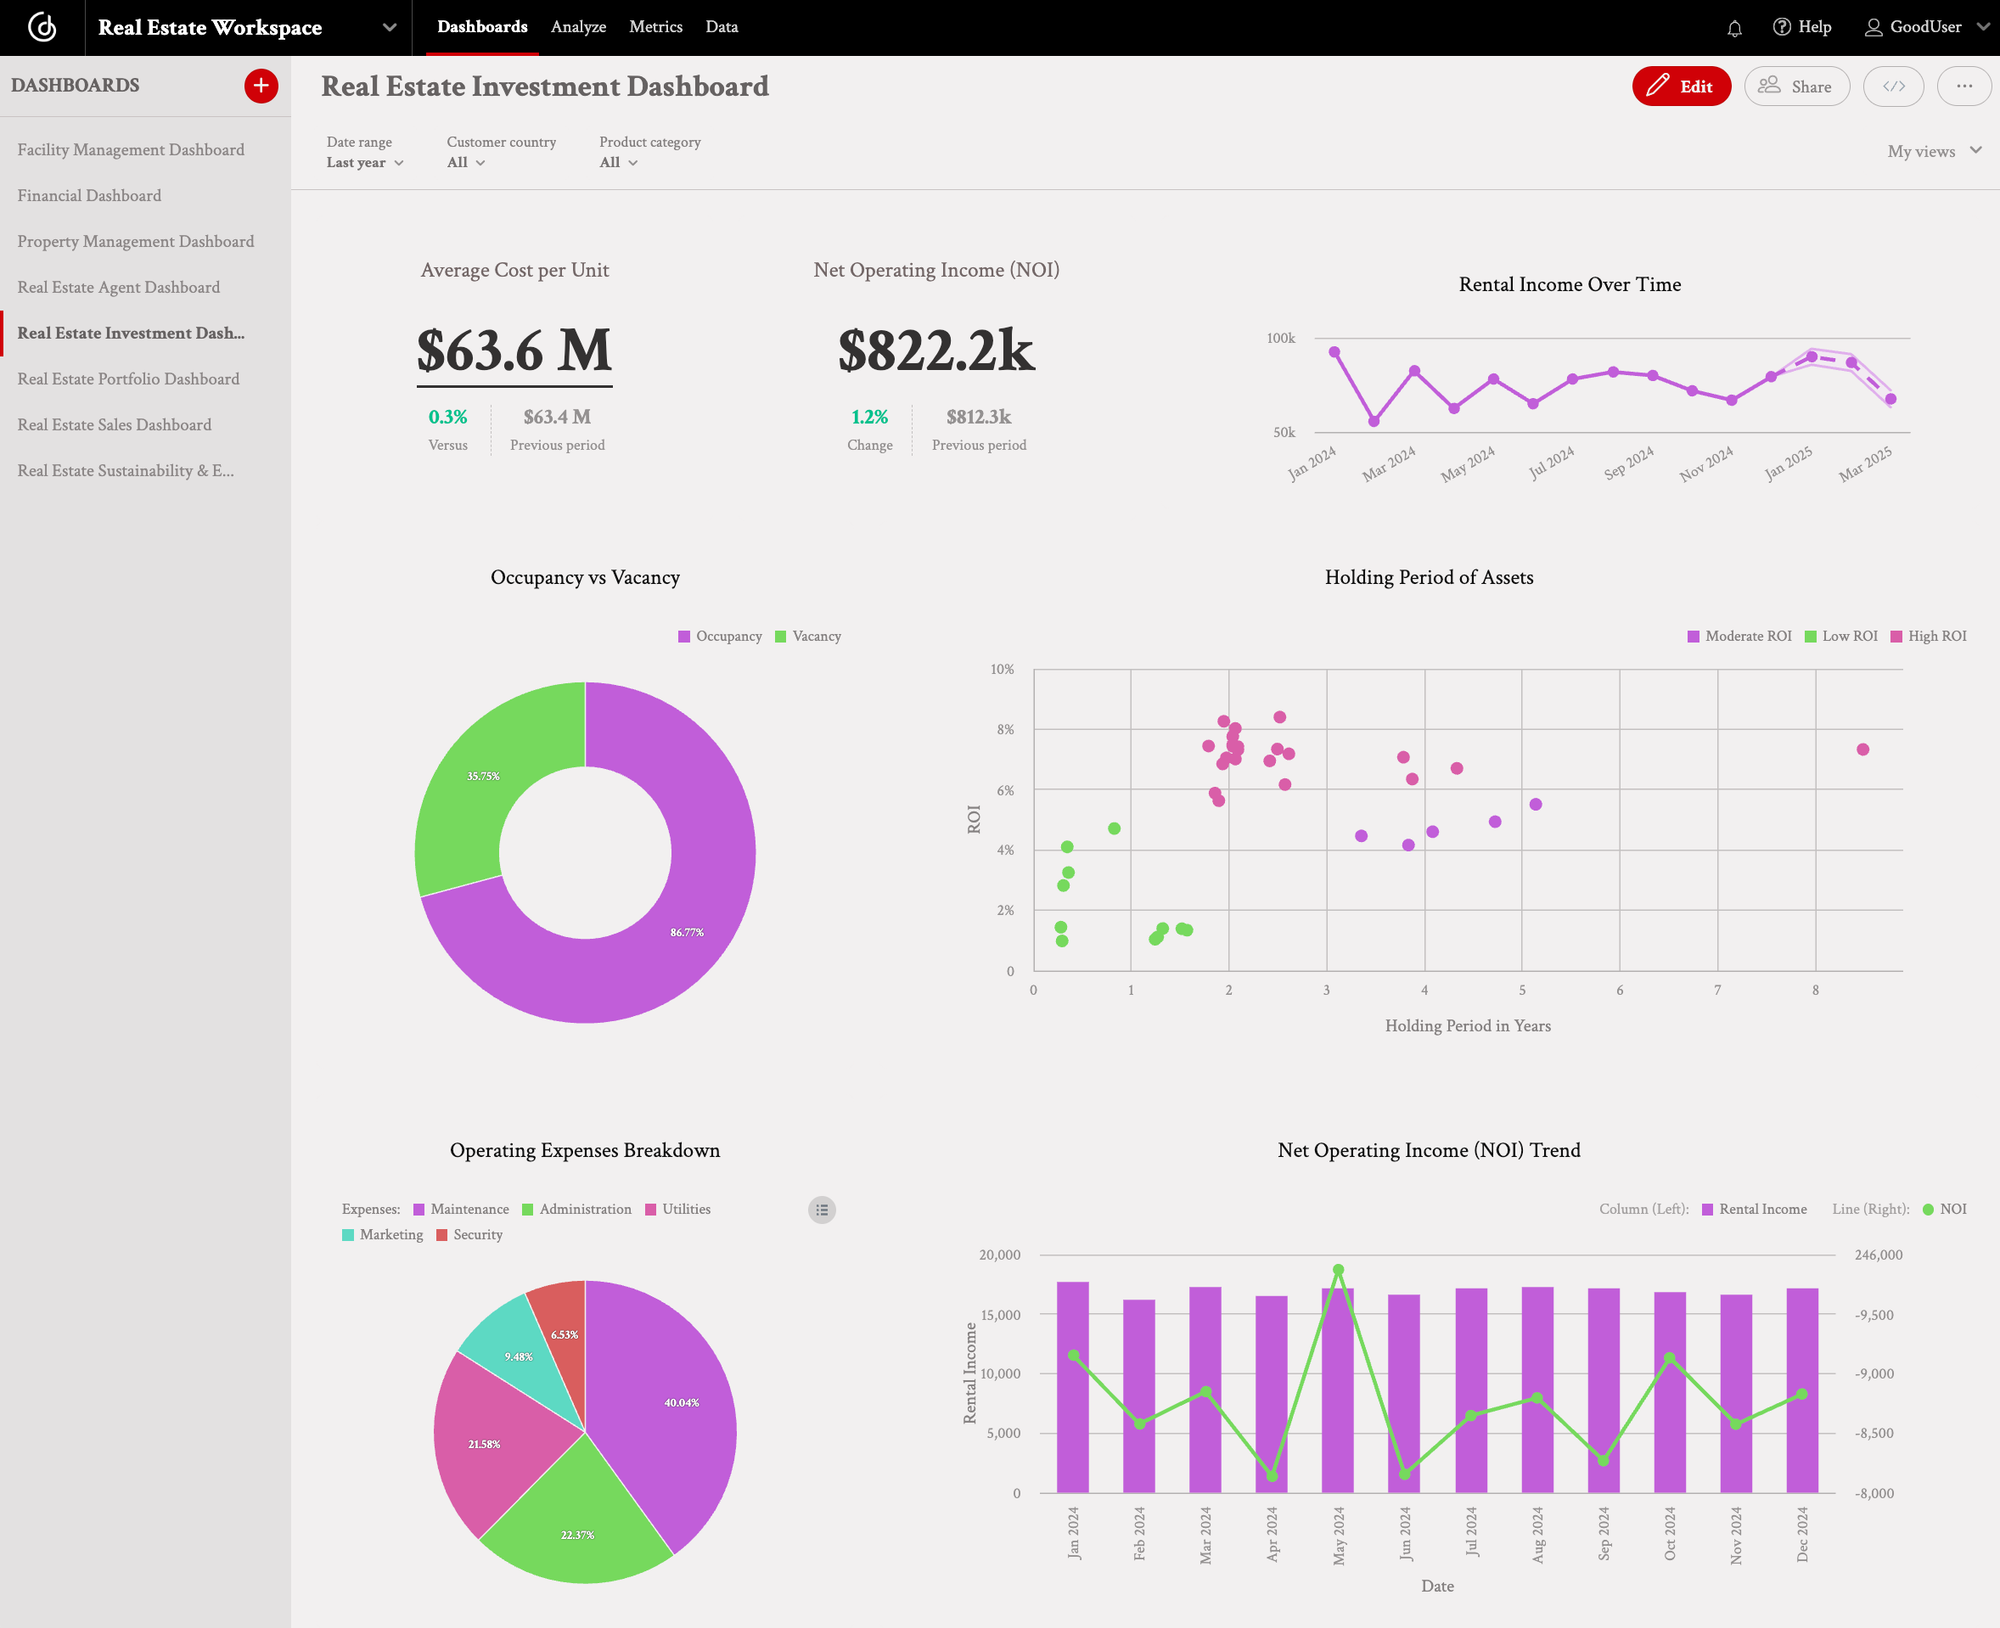
Real Estate Investment Dashboard
3. Real Estate Sales Dashboard
This is a vital tool for tracking and optimizing the sales process, providing insights into the effectiveness of lead generation and deal closures. It highlights KPIs such as Number of new leads (which allows sales teams to assess their pipeline strength) and Conversion rate (which measures how efficiently prospects are turning into buyers). Meanwhile, Average closing time helps monitor how long it takes to finalize a sale, ensuring that processes remain efficient. The dashboard also tracks the Average sale price of properties (providing insights into pricing trends and market dynamics) and evaluates the Performance of individual agents — enabling managers to identify top performers and areas for improvement. By centralizing these metrics, a real estate sales dashboard helps teams refine their strategies and drive higher revenue.
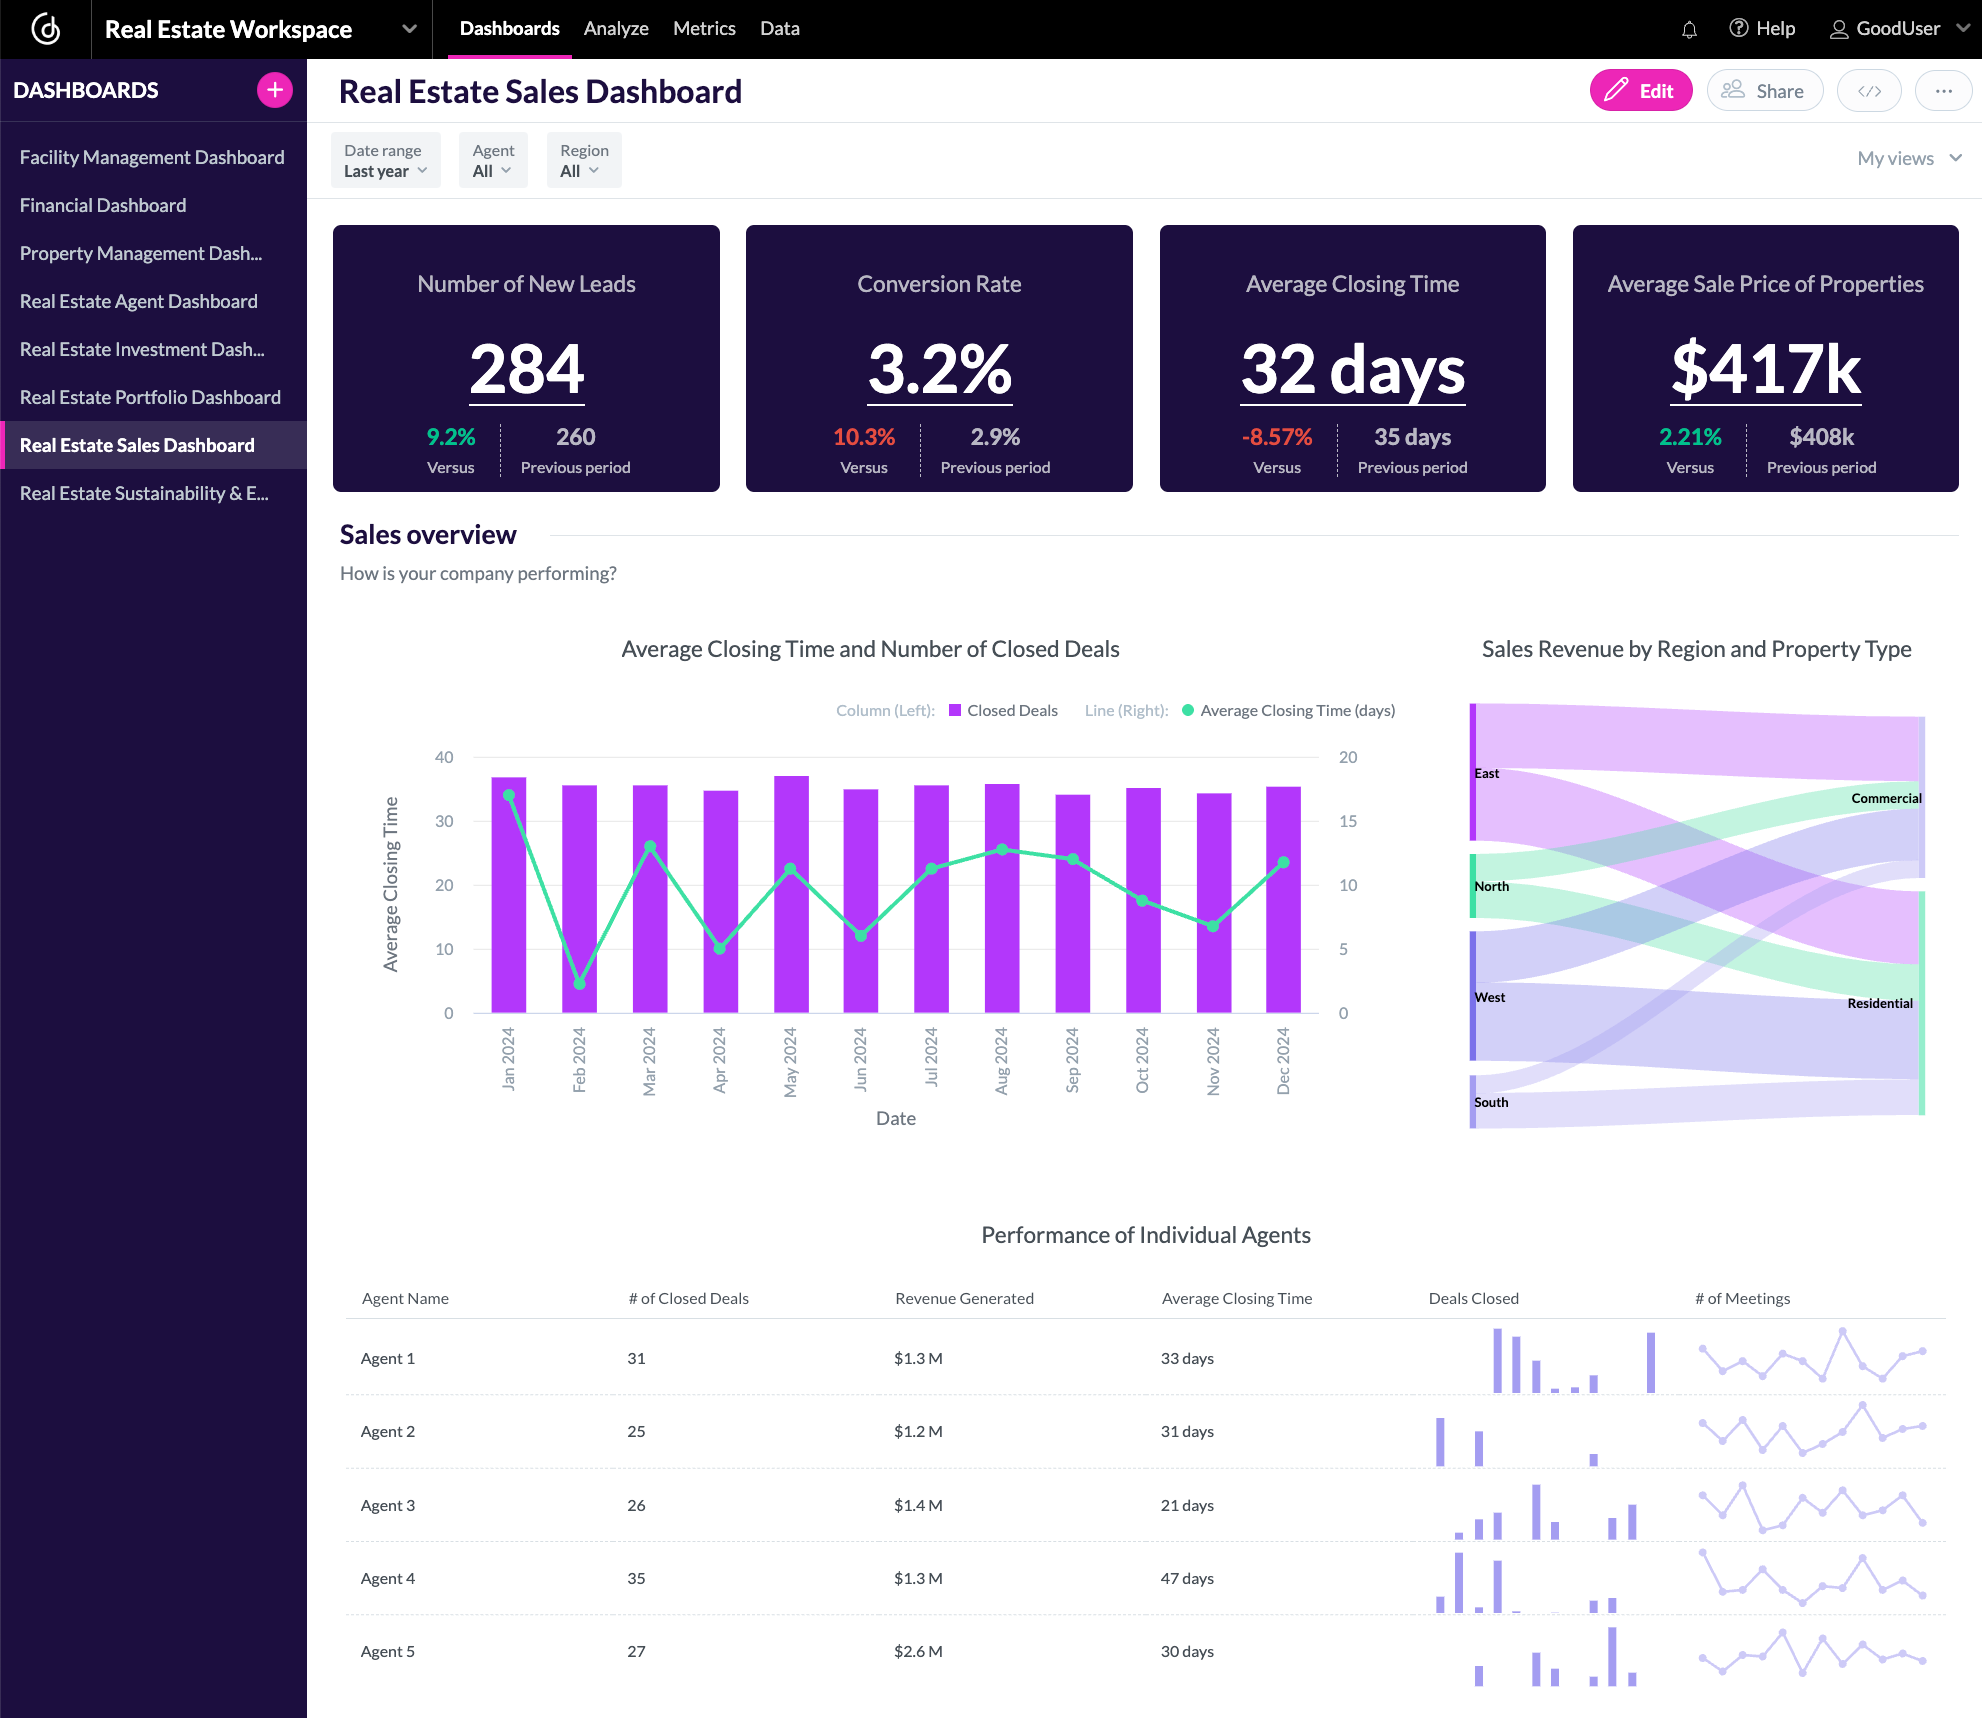
Real Estate Sales Dashboard
4. Real Estate Agent Dashboard
This type of dashboard helps agents and their managers manage workflows, optimize sales efforts, and enhance client relationships. It provides real-time insights into the Number of client meetings (to monitor engagement levels), and Number of offers and closed deals (to measure sales efficiency and success). Average commission per transaction helps agents to better understand their earning potential and identify high-value deals, while Client satisfaction scores offer crucial feedback on areas for improvement. Finally, the dashboard also tracks the Average time from listing to sale, which helps agents evaluate market conditions and refine pricing and marketing strategies accordingly.
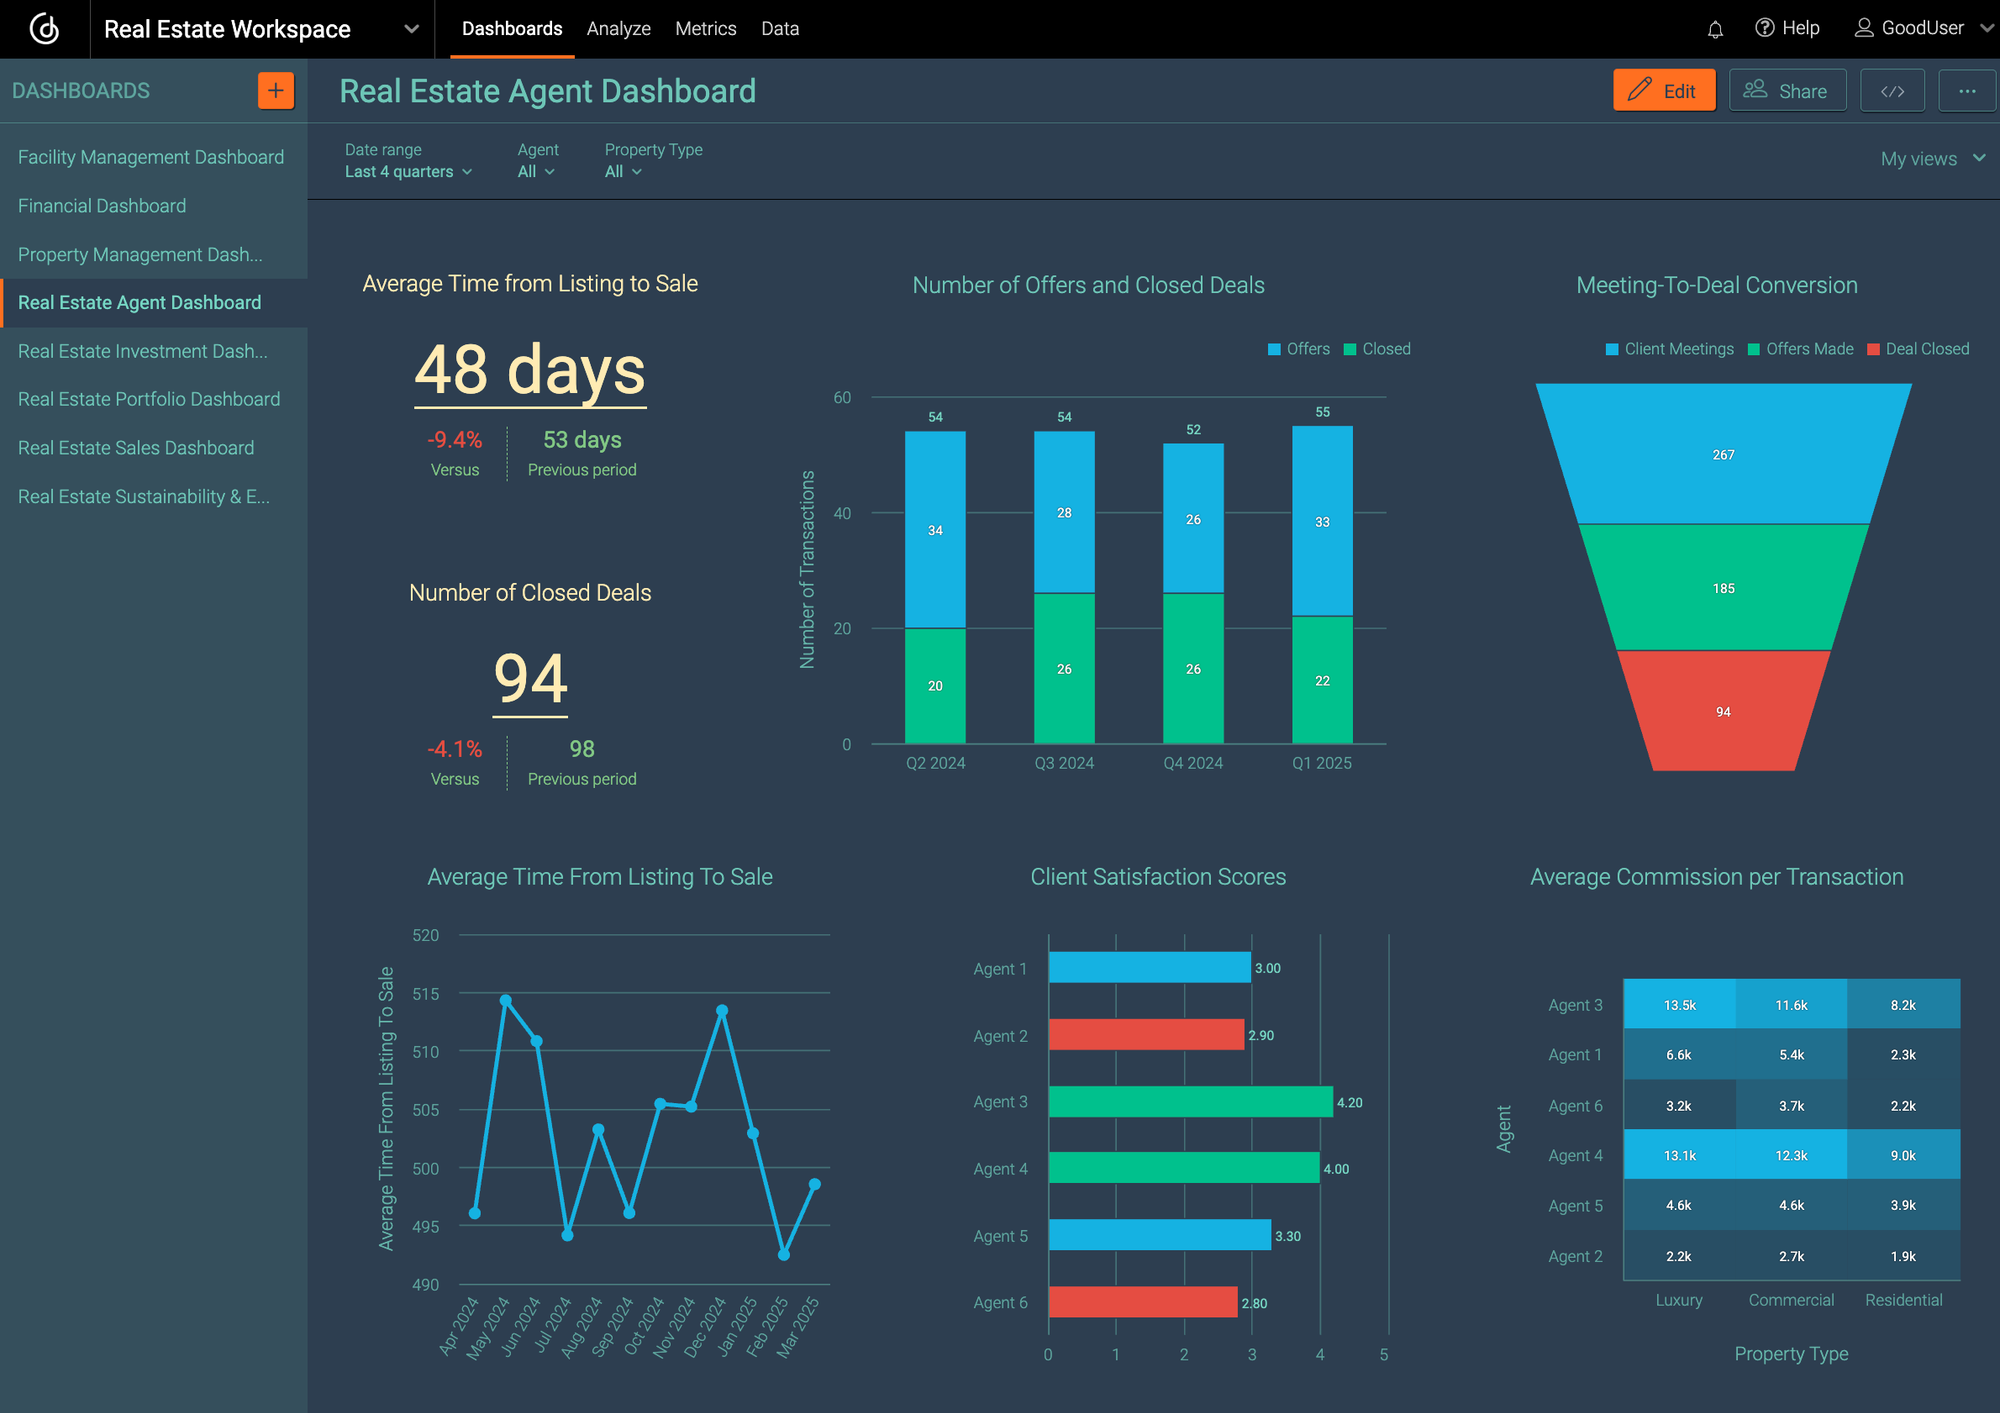
Real Estate Agent Dashboard
5. Facility Management Dashboard
Real estate professionals use this dashboard to track the efficiency and effectiveness of property maintenance and operations. It tracks the Number and types of service requests, helping facility managers monitor common maintenance issues and prioritize urgent tasks. The dashboard also measures Average response time to service requests, ensuring timely resolutions and a better experience for tenants. By visualizing Maintenance and repair costs, facility managers can control expenses and allocate budgets more effectively. The dashboard also offers insights into the Condition of technology and infrastructure, enabling proactive maintenance to prevent costly breakdowns. Tenant satisfaction scores provide valuable feedback on the overall quality of facility services, which often leads to better property management.
With these insights, a facility management dashboard enhances operational efficiency, reduces downtime, and ensures a high standard of service for tenants and property owners alike.
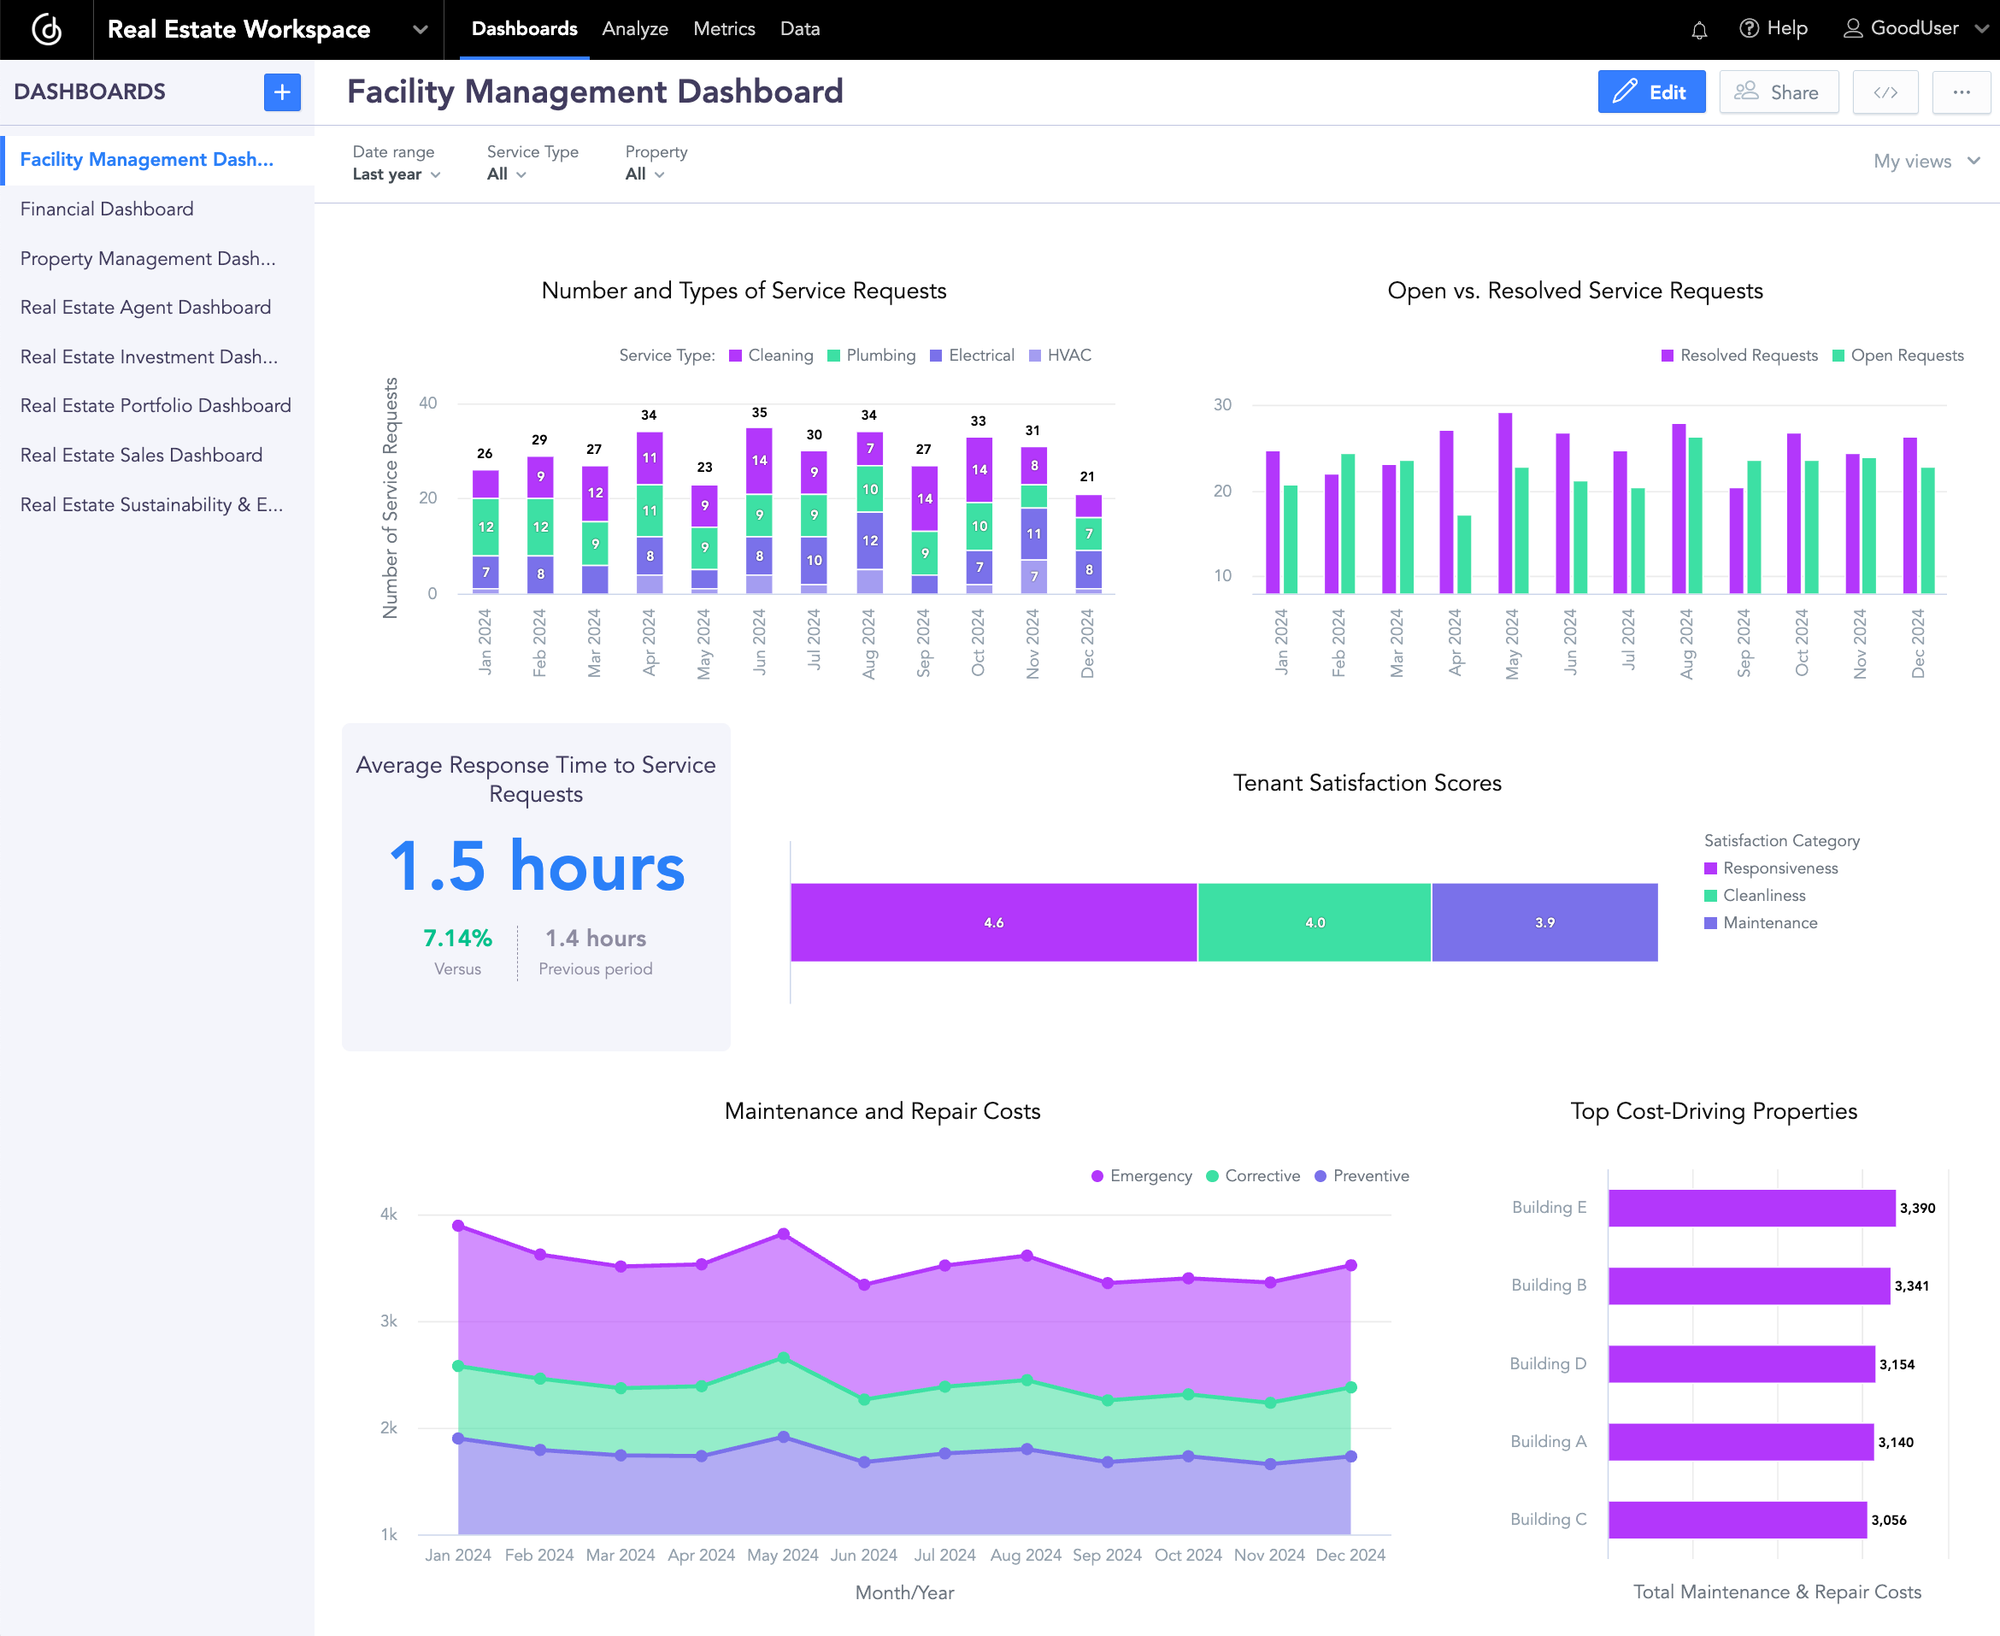
Facility Management Dashboard
6. Property Management Dashboard
Property managers use this dashboard as a key tool to track and optimize the performance of their rental portfolio. It shows Occupancy and vacancy rates, allowing managers to quickly identify underutilized properties and take action to fill vacancies. The dashboard also compares Rental income vs. operating costs, offering a clear view of profitability and expense management. By monitoring Average lease duration, property managers can assess tenant retention trends and plan lease negotiations accordingly. Additionally, tracking the Number of renewed contracts helps gauge tenant satisfaction and the effectiveness of lease renewal strategies. The dashboard also visualizes Rental revenue, providing a comprehensive view of income streams across different properties. With these key metrics, property managers can make data-driven decisions to increase efficiency and revenue, and improve tenant retention.
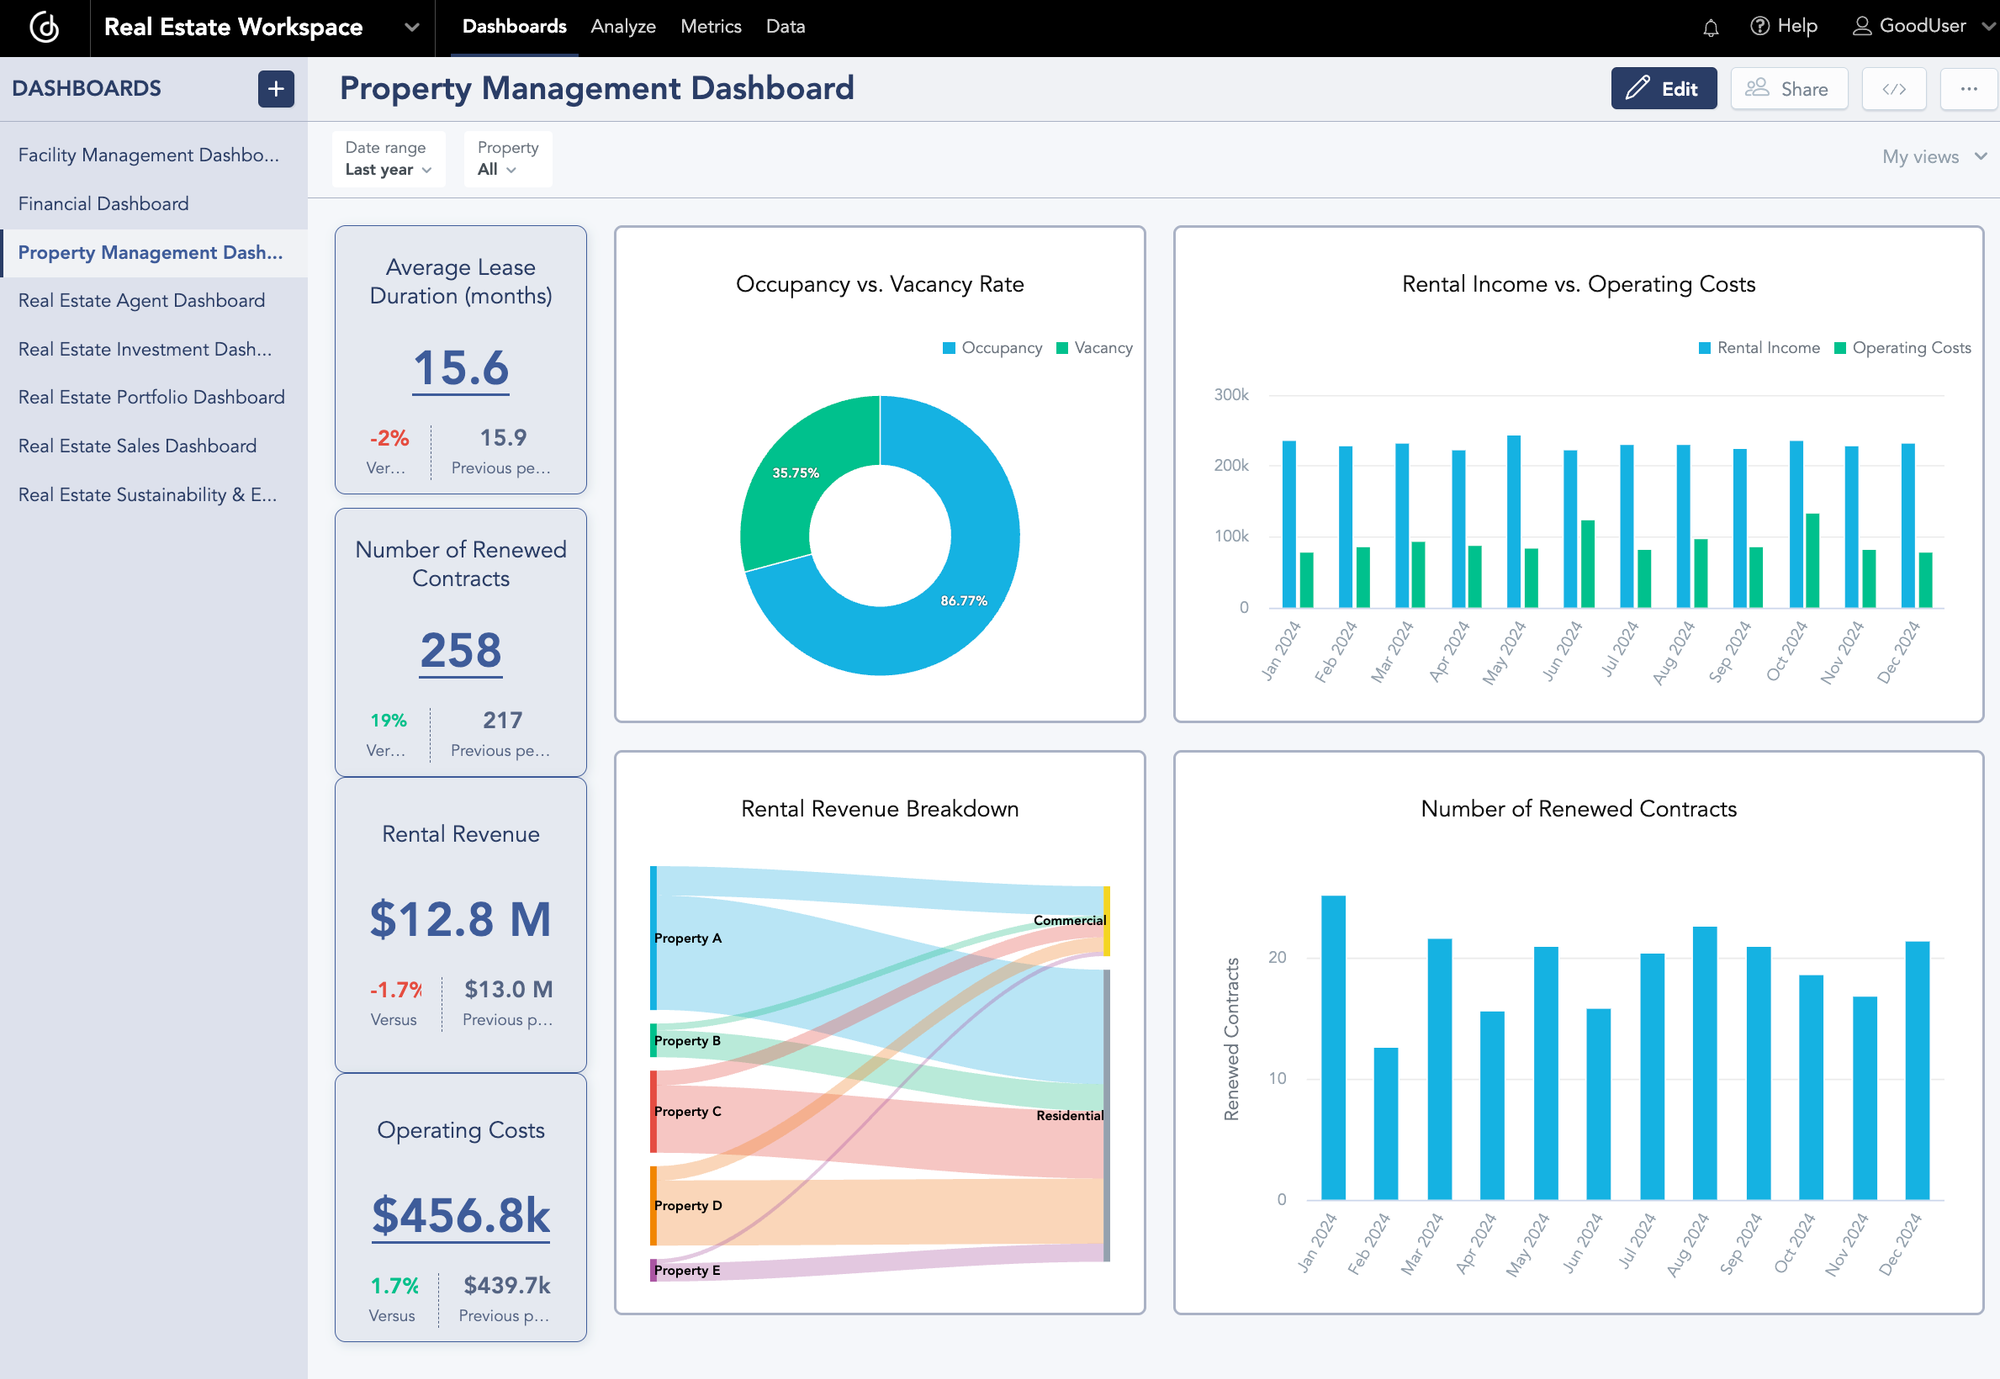
Property Management Dashboard
7. Financial Dashboard
This provides property owners, investors, and asset managers with critical financial insights about their real estate business. It offers a clear overview of Net operating income and assesses profitability by tracking revenue and operating expenses. It also monitors Gross property income, helping stakeholders evaluate rental revenue streams and other income sources. The dashboard analyzes management costs to enable effective budget control and cost optimization to improve efficiency. To support long-term investment strategies, it tracks property value trends, offering insights into market fluctuations and asset appreciation. Additionally, it includes a debt load analysis to provide a transparent view of liabilities and financial risk exposure.
By consolidating these key financial metrics, the financial dashboard enables real estate professionals to improve the performance of their assets, manage risk, and drive profitability.
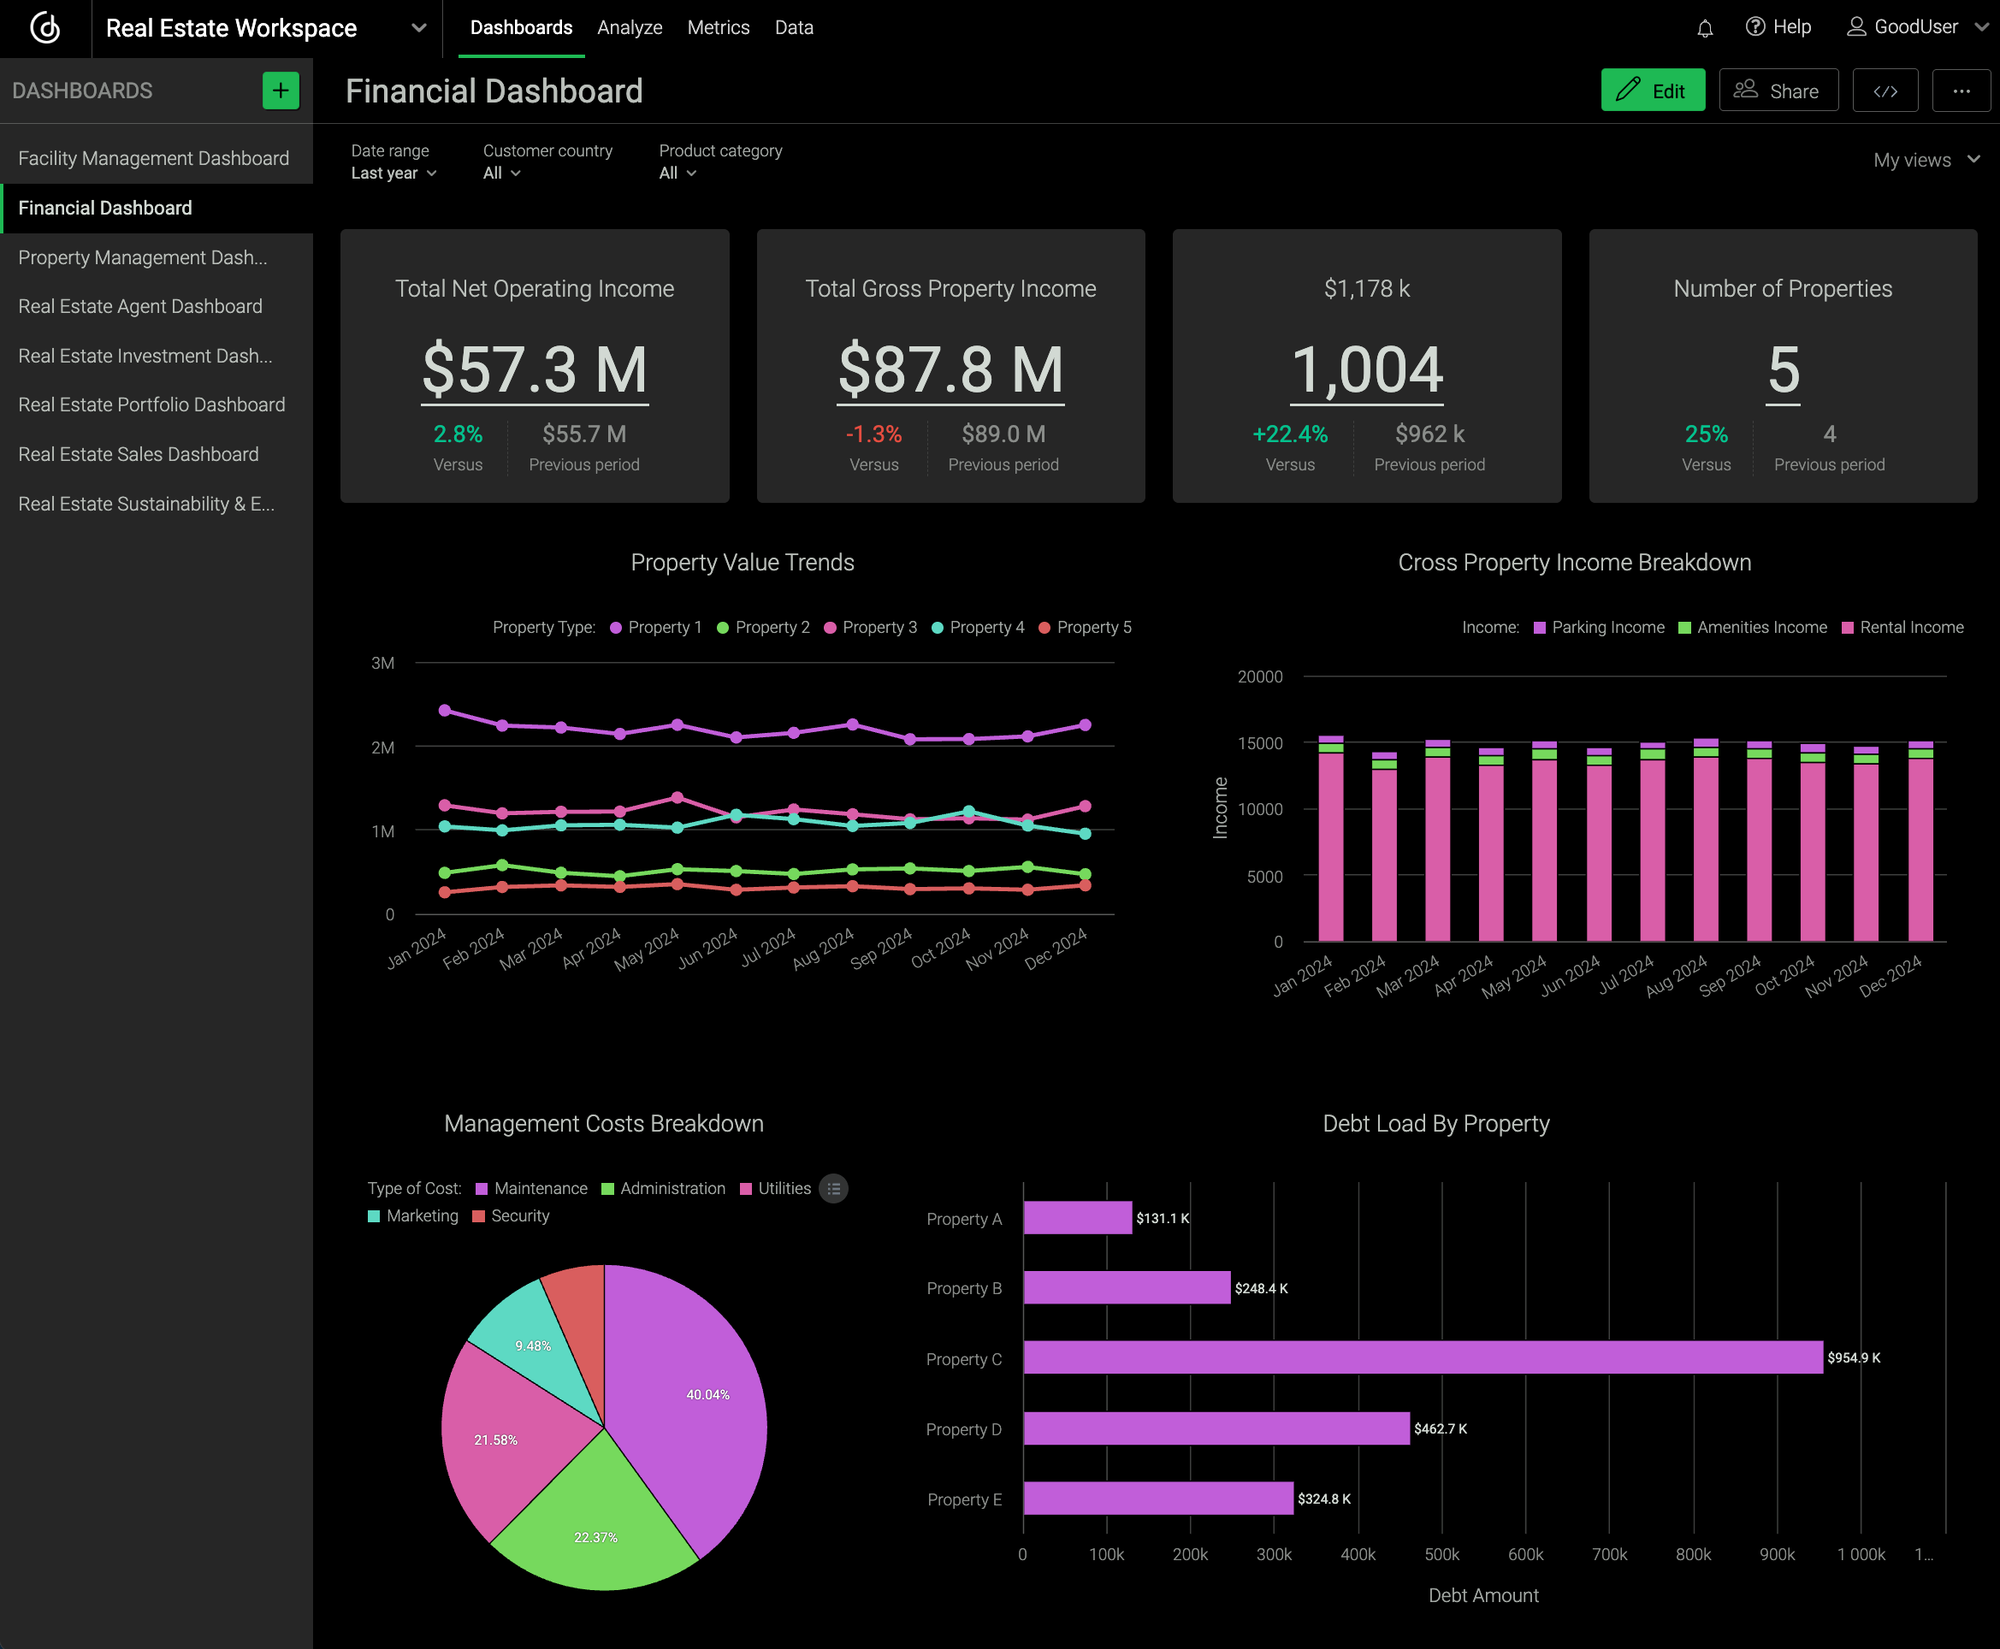
Financial Dashboard
8. Real Estate Sustainability & ESG Dashboard
This dashboard is designed to help property owners, investors, and managers track and improve their environmental, social, and governance (ESG) performance. It provides real-time insights into energy and water consumption, ensuring the right decisions are made to enhance efficiency and reduce waste. It also monitors the building's carbon footprint, ensuring stakeholders are aligned on sustainability goals and regulatory requirements. To support green building standards, the dashboard integrates LEED/BREEAM certifications, offering a clear view of compliance and sustainability achievements. Beyond environmental metrics, the dashboard assesses community and tenant satisfaction, offering valuable feedback to improve social responsibility and overall well-being within properties.
Ultimately, a real estate sustainability & ESG dashboard consolidates all critical ESG metrics in one place, empowering real estate professionals to drive meaningful sustainability initiatives that provide long-term value.
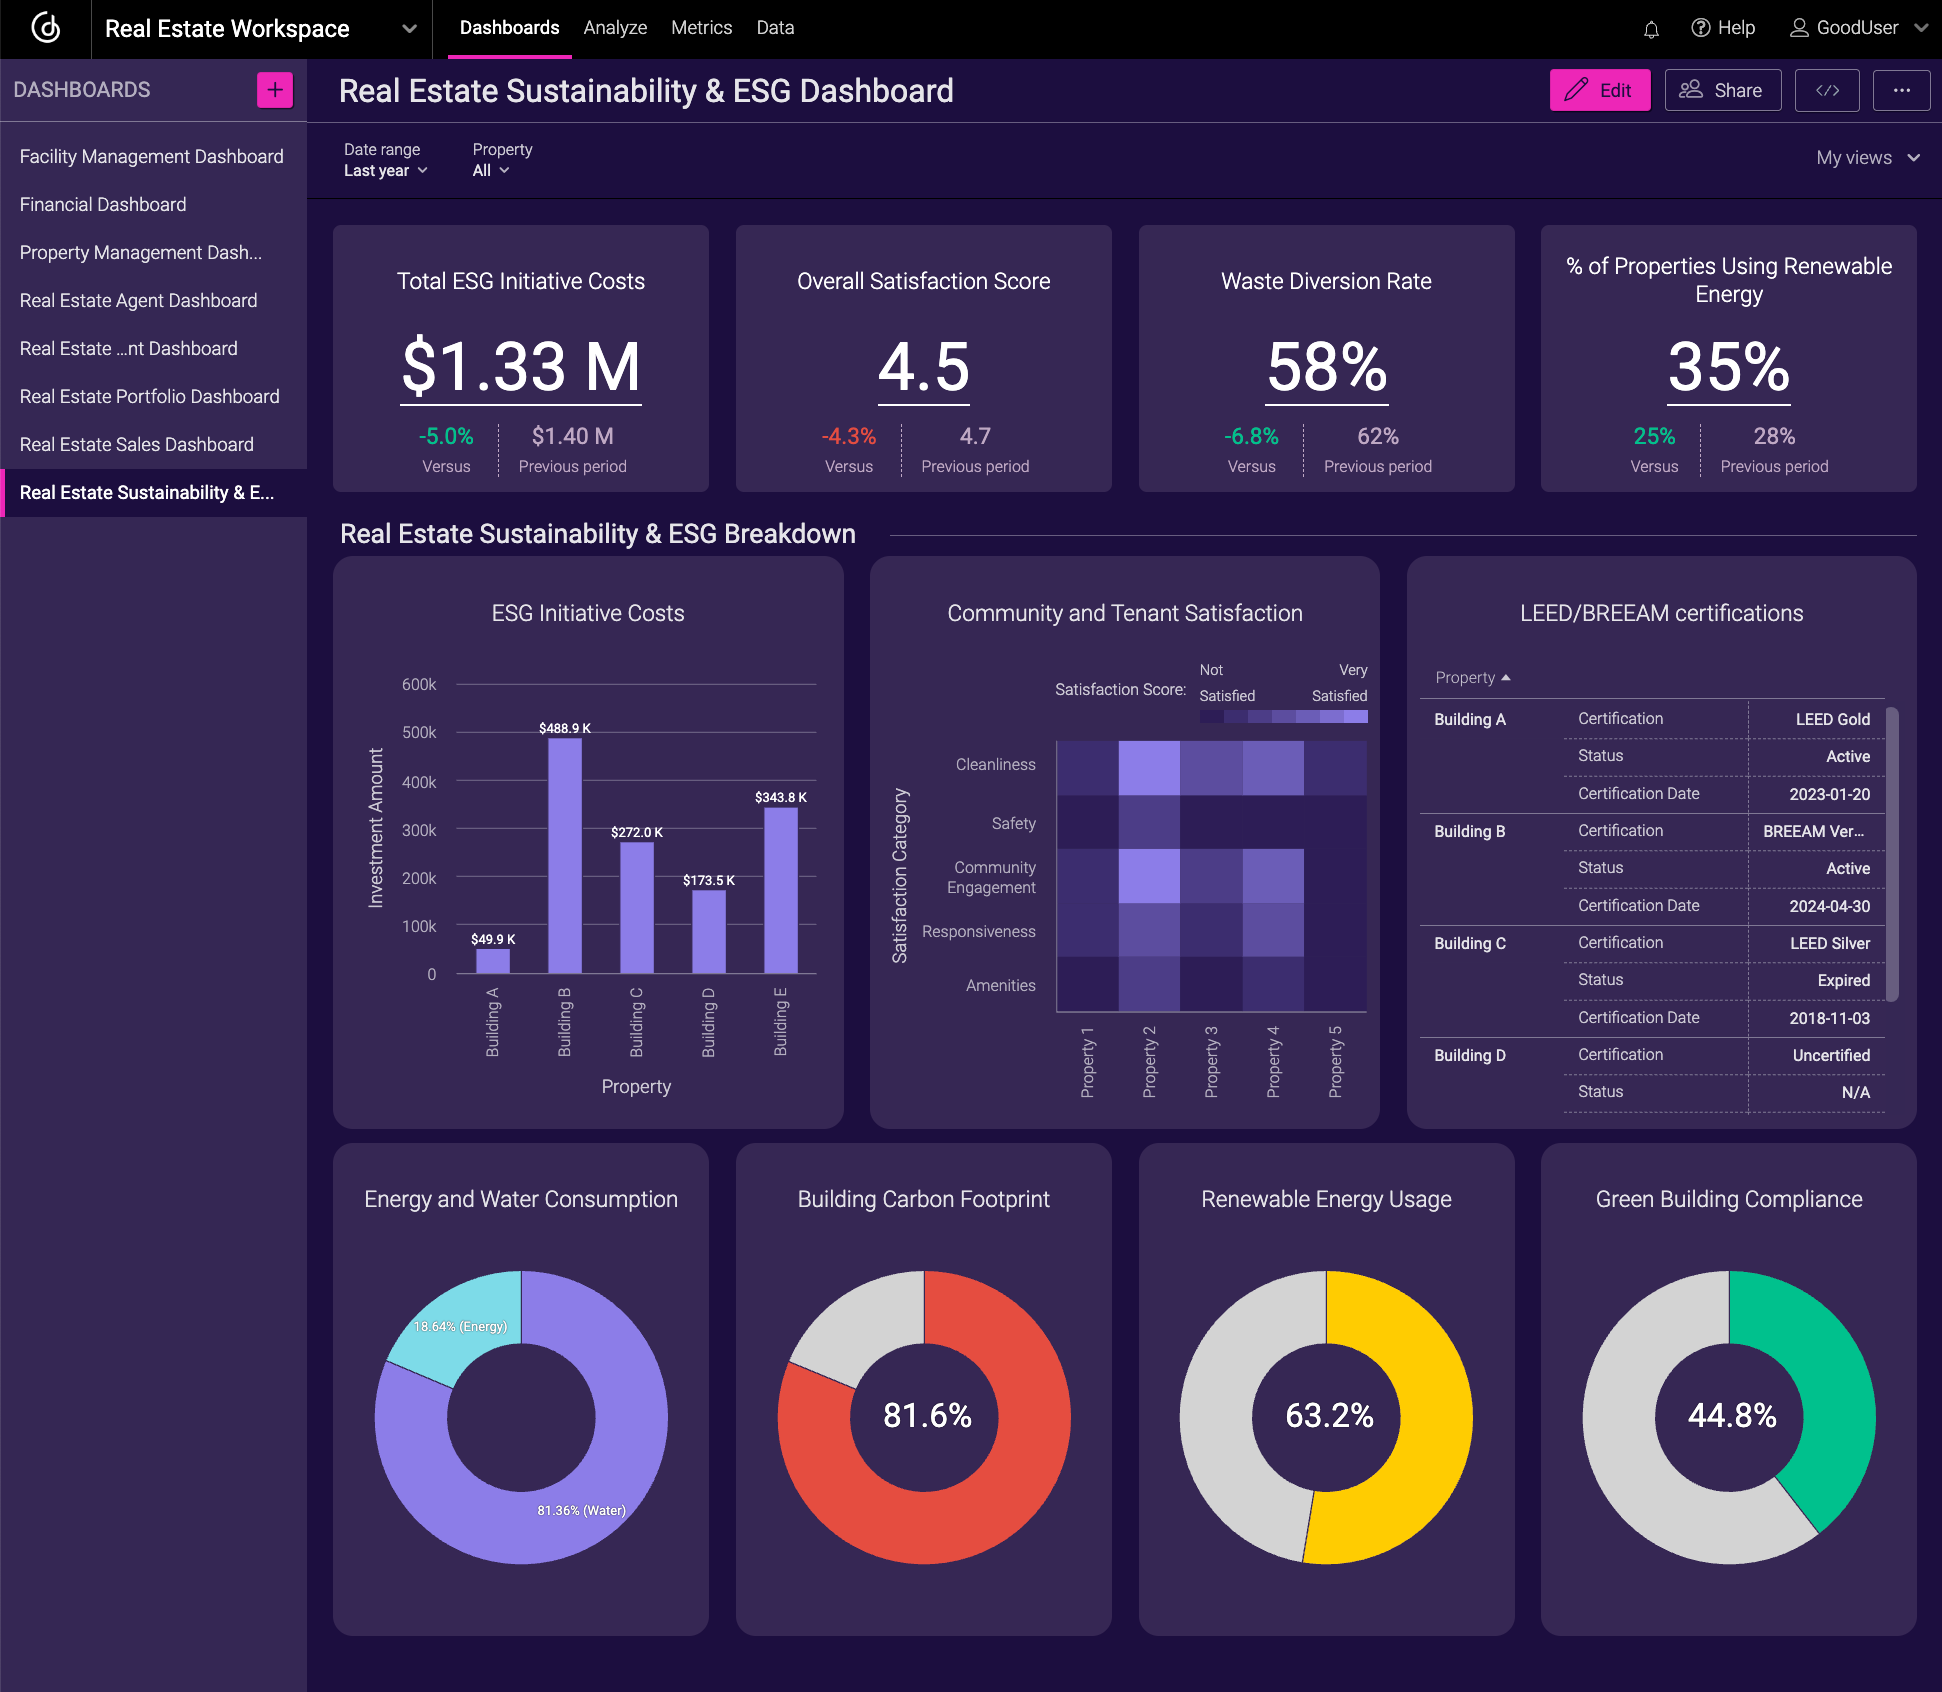
Real Estate Sustainability & ESG Dashboard
Create Your Own Real Estate Dashboards with GoodData
GoodData’s AI-enabled analytics platform makes it easy to create real estate dashboards like the examples in this article. But while intuitive, drag-and-drop, self-service dashboards are essential, they’re only part of the equation for a truly successful analytics strategy. A modern BI tool should go beyond visualizations and provide a semantic layer, multitenancy, scalability, automation, various embedding options, and seamless integration with your existing tech stack. To learn more about this, check out the 11 must-have features for a modern BI tool that will take your analytics strategy to the next level.
Alternatively, read our real estate customer stories to discover how real businesses leverage GoodData to build scalable, high-performance analytics solutions tailored to their needs. Or schedule a demo to see how our platform can help you drive operational excellence with a comprehensive, future-proof BI approach.
Written by Tom Czaban |

