Get the Most from Your Net Promoter Score Data
Written by GoodData Author |

Table of Contents
From surveys at retail checkout counters to text-message prompts from telecom companies, Net Promoter Score® (NPS) is popping up in every industry. That's no surprise since NPS has been shown to predict customer loyalty and revenue growth.
At GoodData, we track NPS and other customer metrics in a GoodData dashboard. Having all our relevant data in one place has created a single source of truth, saved countless hours of manual reporting, and helped our employees make better decisions.
This blog post shares how we report on NPS at GoodData, and how your company can do it too.
But first, what's NPS again?
Developed by Satmetrix, Bain & Company and Fred Reichheld, NPS measures customer loyalty and goodwill by asking: "How likely are you to recommend Company/Product X to your friends or colleagues?"
- Ratings range from "10 = Extremely Likely" to "0 = Not Likely At All"
- 9-10 votes are called Promoters – these respondents are likely to spread positive word-of-mouth about your product.
- 7-8 are called Passive – these respondents are relatively satisfied but could be wooed by a competitor.
- 0-6 votes are called Detractors – these respondents are likely to talk negatively about your product.
NPS is calculated by comparing the percentage of Promoters to the percentage of Detractors: (# Promoters - # Detractors) / # Respondents.
Why not try our 30-day free trial?
Fully managed, API-first analytics platform. Get instant access — no installation or credit card required.
Get startedBuilding an NPS dashboard in GoodData
Last fall, we launched an NPS widget that surveys users directly in their GoodData project. As a result, we have NPS survey data rolling in continuously. We added this data to our internal customer health project, GoodSuccess. This project combines data from Salesforce.com, Zendesk, and our internal data warehouse to help our Account Managers, Executives, and Product Managers drive customer success.
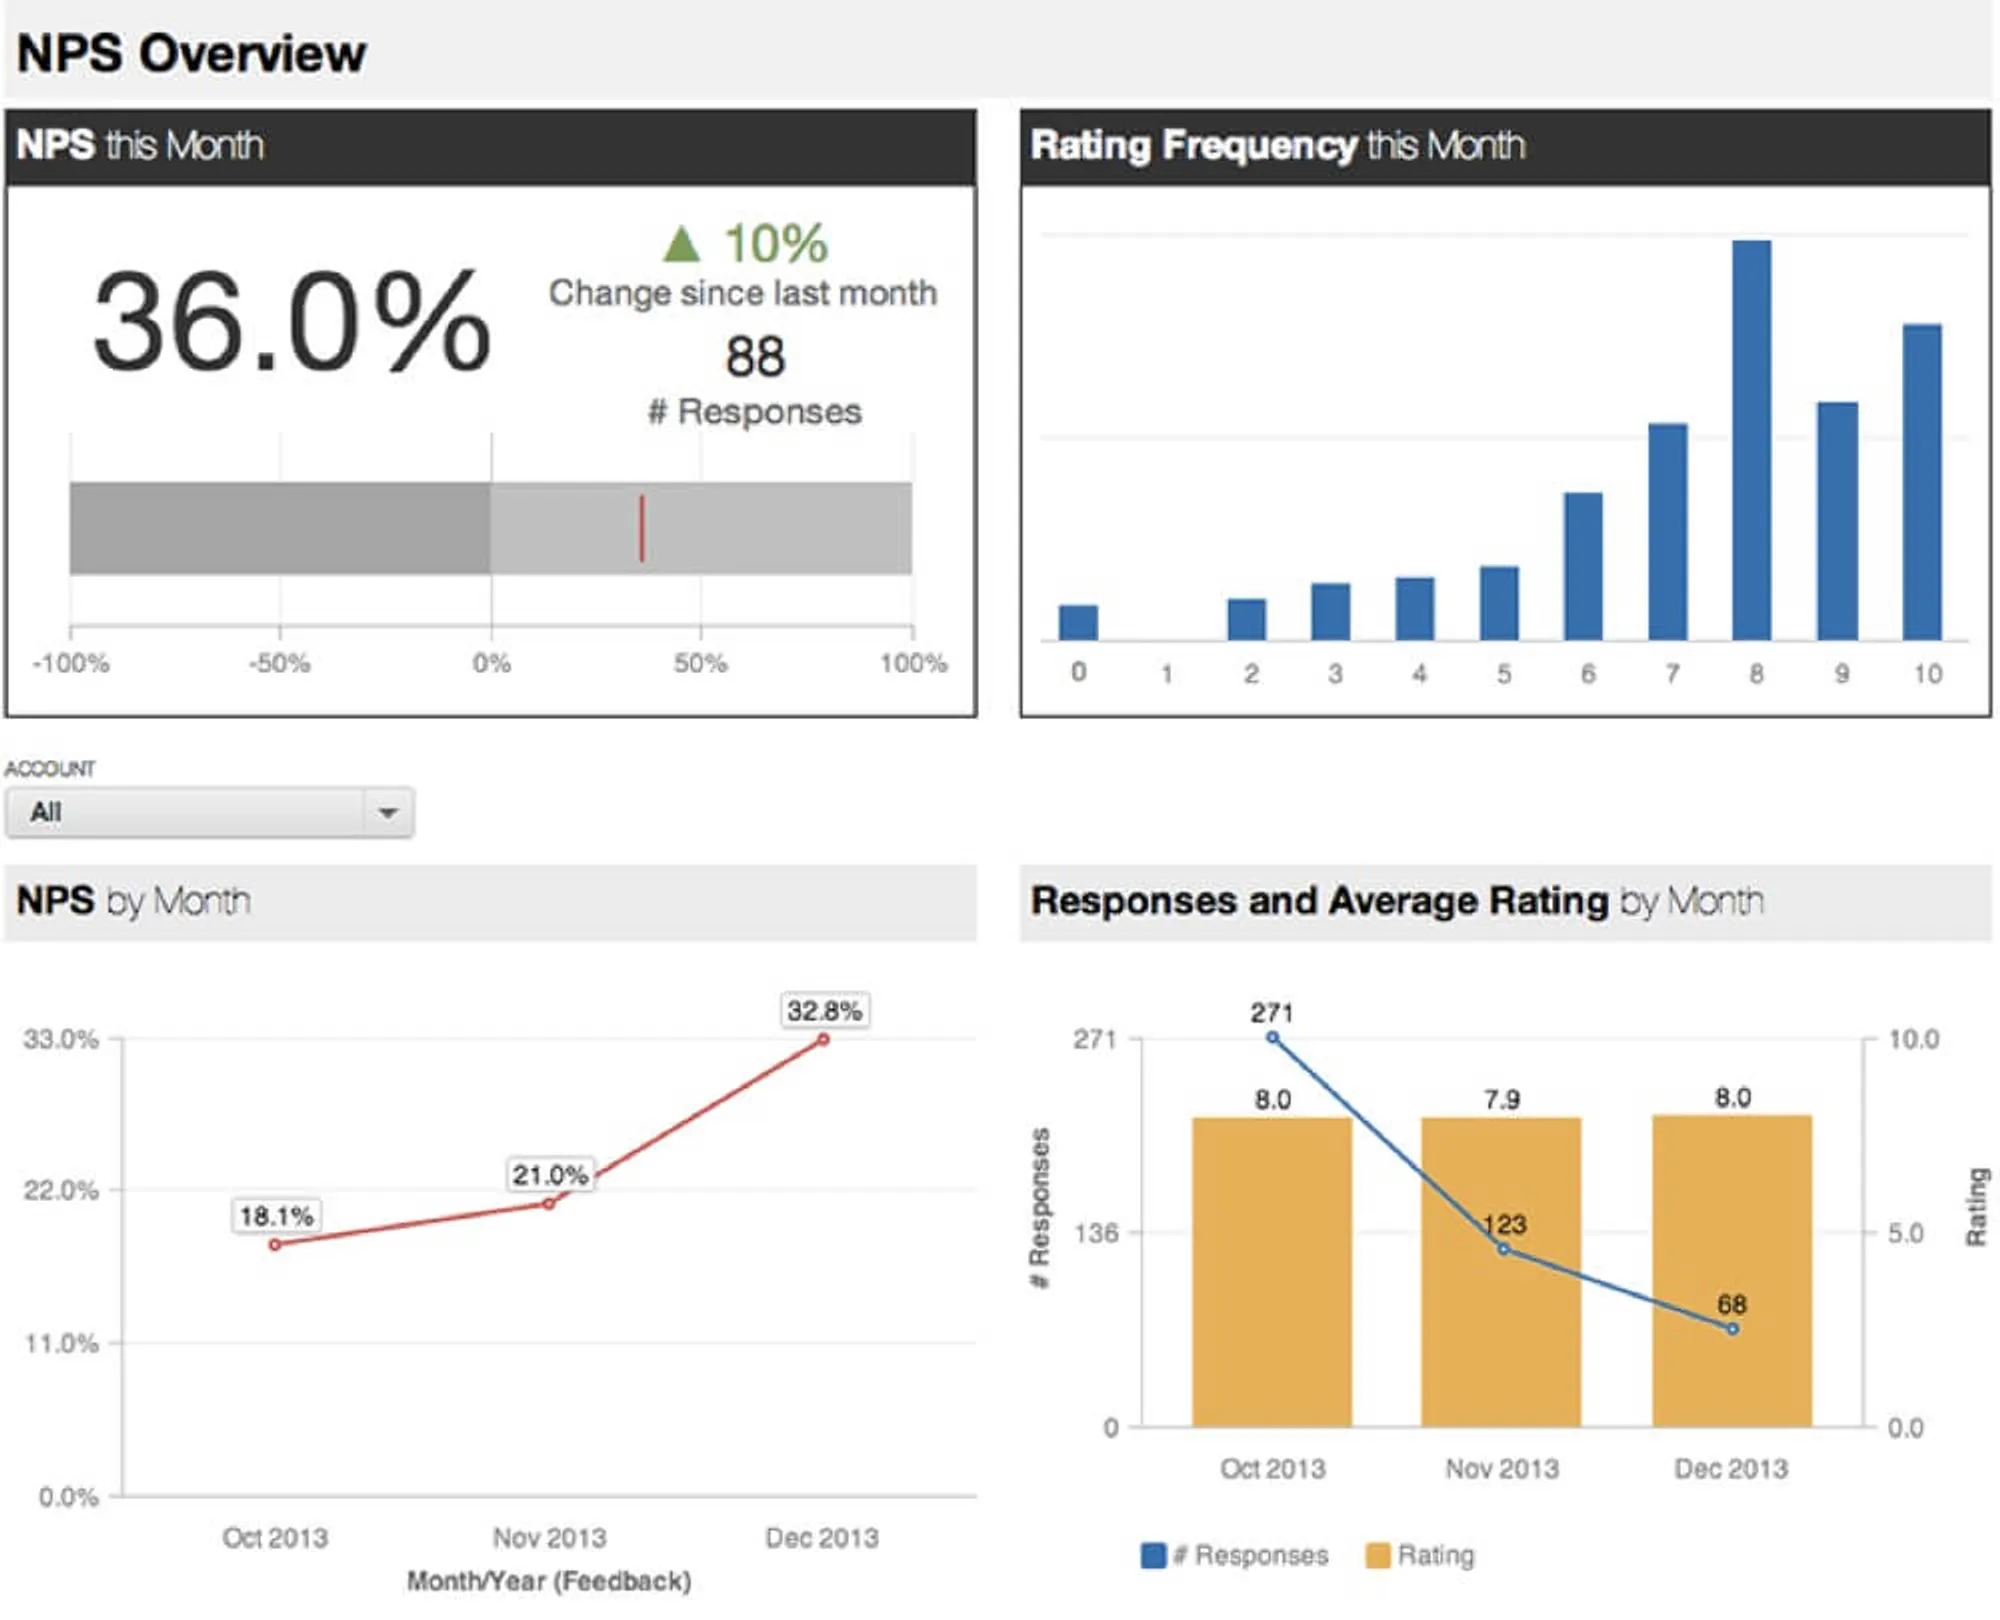
The NPS Overview dashboard below is similar to the summary dashboard we built internally:

NPS this Month: This section shows your NPS score so far this month, the percent change since last month, and the number of responses received.
Rating Frequency this Month: This chart shows your distribution of scores. Since the NPS formula is based only on the relative percentages of Promoters and Detractors, you could have highly polarized scores or middling ones, and have a similar NPS. Seeing the rating distribution can add important insight.
NPS by Month: In addition to looking at data for this month, we can also track trends on a weekly, monthly, or quarterly basis. This report shows an NPS trendline by month.
Responses and Average Rating by Month: This chart shows the number of responses coming in, and the average rating across those responses. Rolling average would also be a good way to look at NPS, for example on a three-month rolling basis.
Account-Level Filter: Note that the example above also includes a dropdown filter called "Account." By adding this filter to the dashboard, we can easily view trends for specific customers.
Product-Line and User-Level Feedback: At GoodData, we have additional dashboard tabs that list responses and open-ended feedback coming in by date, account, and user. This allows for quick browsing of feedback and deeper customer-level insights. We also break down NPS by key categories such as product line, use case, and more.
Make the most of your data
Whether you use NPS or other measures of customer health, you know the data needs to be current and accessible to be actionable. Up-to-date, engaging reporting can deliver critical insights that help you increase customer success and improve company performance.
Contact us to learn how you can use GoodData to track customer health metrics like NPS.
Why not try our 30-day free trial?
Fully managed, API-first analytics platform. Get instant access — no installation or credit card required.
Get startedNet Promoter, Net Promoter Score, and NPS are trademarks of Satmetrix Systems, Inc., Bain & Company, Inc., and Fred Reichheld
Written by GoodData Author |

