Manufacturing Dashboard Examples for Effective Optimization of Your Processes


Summary
This article explores a variety of manufacturing dashboards that help improve operational performance and support better decision making. It provides examples that focus on production efficiency, inventory management, quality control, financial tracking, and workplace safety. It also explains how using real-time data, clear visuals, and carefully chosen metrics enables manufacturers to identify bottlenecks, control costs, maintain quality, and ensure a safe working environment.
Most Common Types of Manufacturing Dashboards
Today’s manufacturing industry relies on dashboards to deliver actionable insights across various areas. There are three primary types of dashboards in manufacturing: production, supply chain, and quality control. From streamlining factory operations to better managing resources, these dashboards help manufacturers make the most of their data and analytics.
Building manufacturing dashboards requires an analytics solution that can integrate data from IoT devices, ERP systems, and Manufacturing execution system platforms (MES). These integration capabilities ensure a business has the insights it needs to improve efficiency and reduce costs.
With this in mind, let's look at some key examples of manufacturing dashboards, highlighting how they streamline processes and support strategic decision-making.
Production Dashboards
In manufacturing, production dashboards monitor productivity by tracking key performance indicators (KPIs) that provide real-time insights into efficiency and operational performance. Overall equipment effectiveness (OEE) helps measure production efficiency by evaluating availability, performance, and quality. The number of units produced per hour indicates output levels and helps identify bottlenecks. Downtime metrics, including the number and duration of stoppages, highlight disruptions and maintenance needs. The defective rate measures product quality by tracking the percentage of faulty units. Finally, machine utilization assesses how effectively equipment is being used, ensuring resources are optimized for maximum productivity. By consolidating these KPIs, production dashboards help manufacturers improve efficiency, reduce waste, and maintain the highest quality standards.
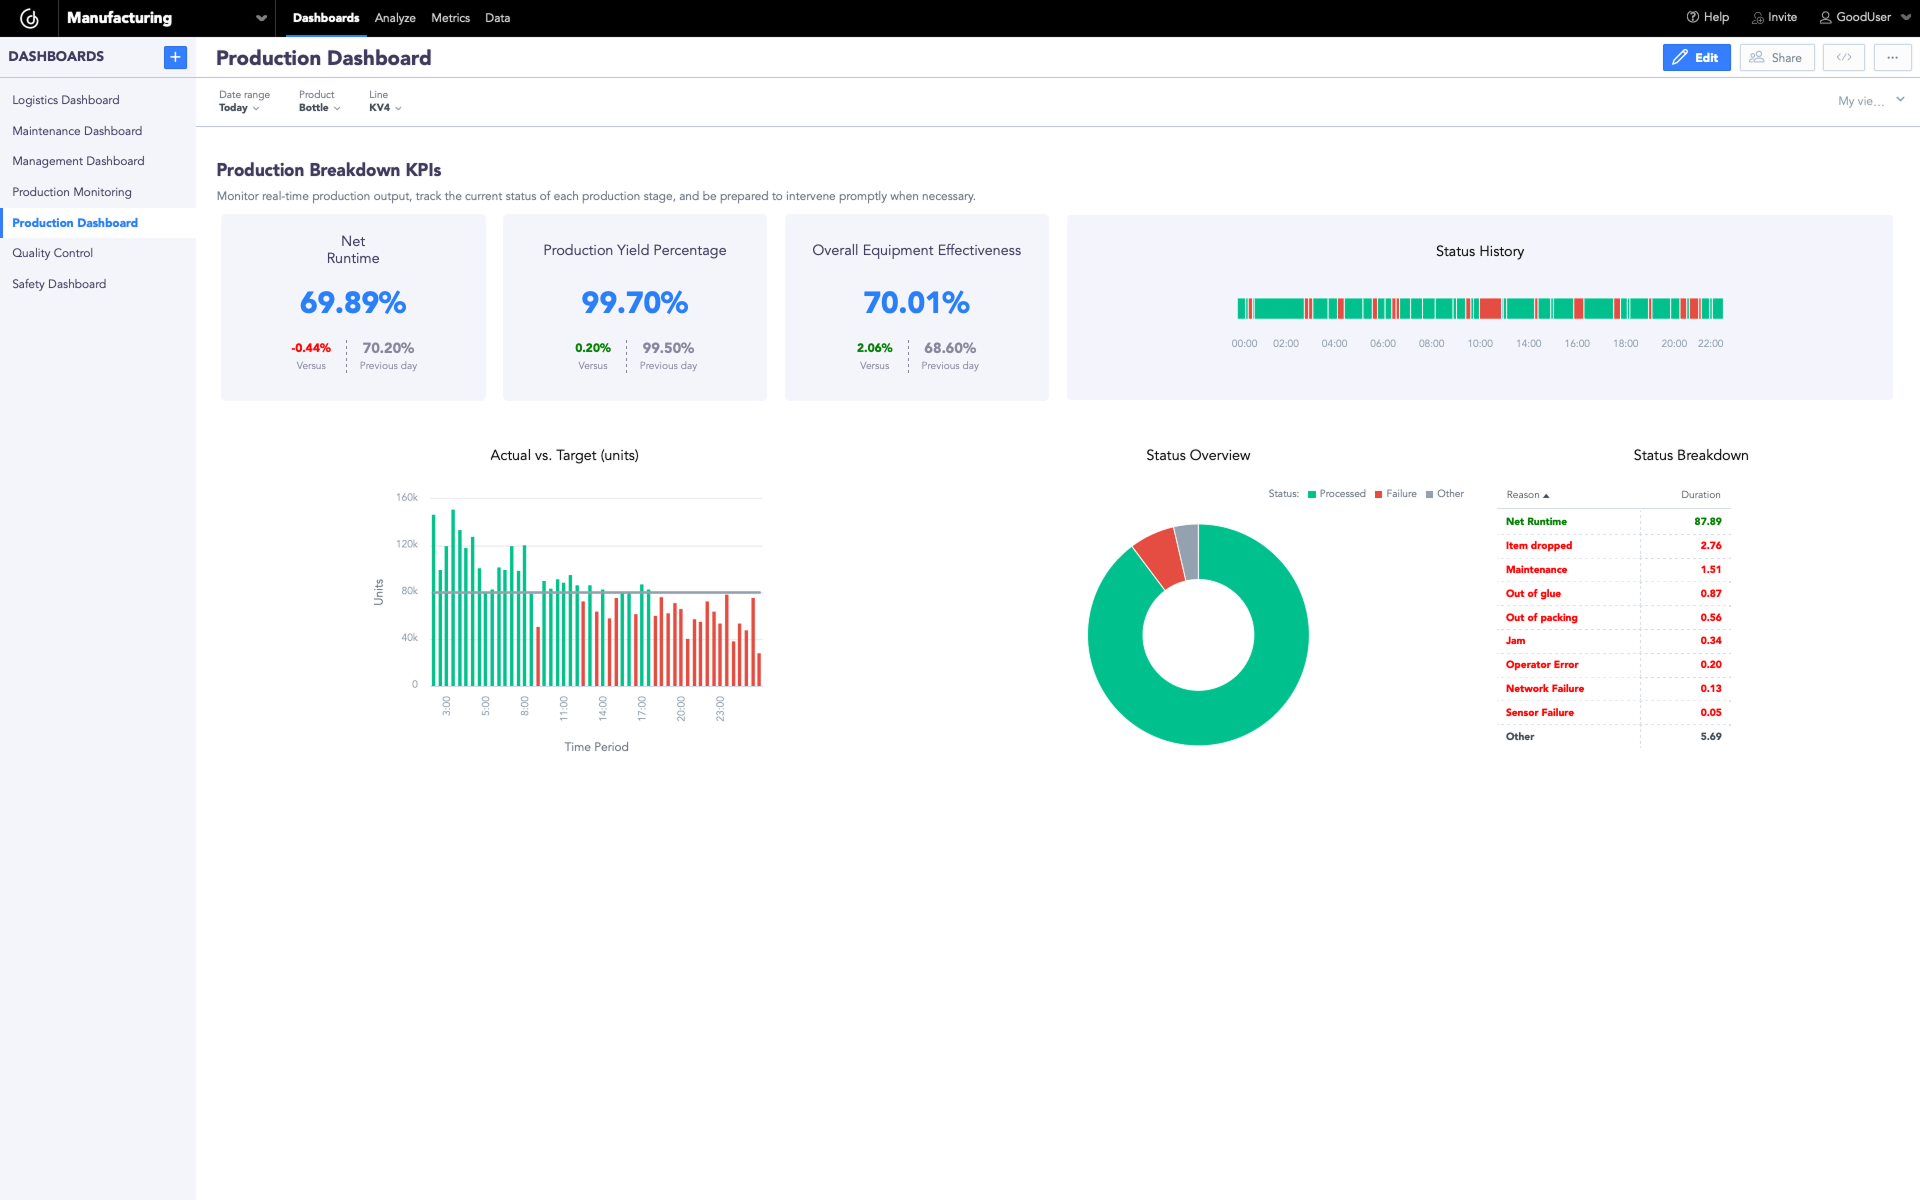
Production dashboard (Click image to enlarge)
Maintenance Dashboards
This dashboard uses KPIs to monitor and predict failures, helping to reduce downtime and optimize maintenance efforts. Mean time between failures (MTBF) measures the reliability of equipment by tracking the average time between breakdowns, while mean time to repair (MTTR) shows how quickly machinery is restored after a failure. Machine condition monitoring uses real-time sensor data to detect performance anomalies and predict potential issues before they lead to breakdowns. Planned vs. unplanned maintenance utilization helps manufacturers balance preventive maintenance with emergency repairs, minimizing costly disruptions. Finally, maintenance costs track expenses related to repairs, labor, and spare parts, helping keep the budget on track. By analyzing these KPIs, maintenance dashboards enable manufacturers to shift from reactive to predictive maintenance, extending equipment lifespan and improving overall productivity.
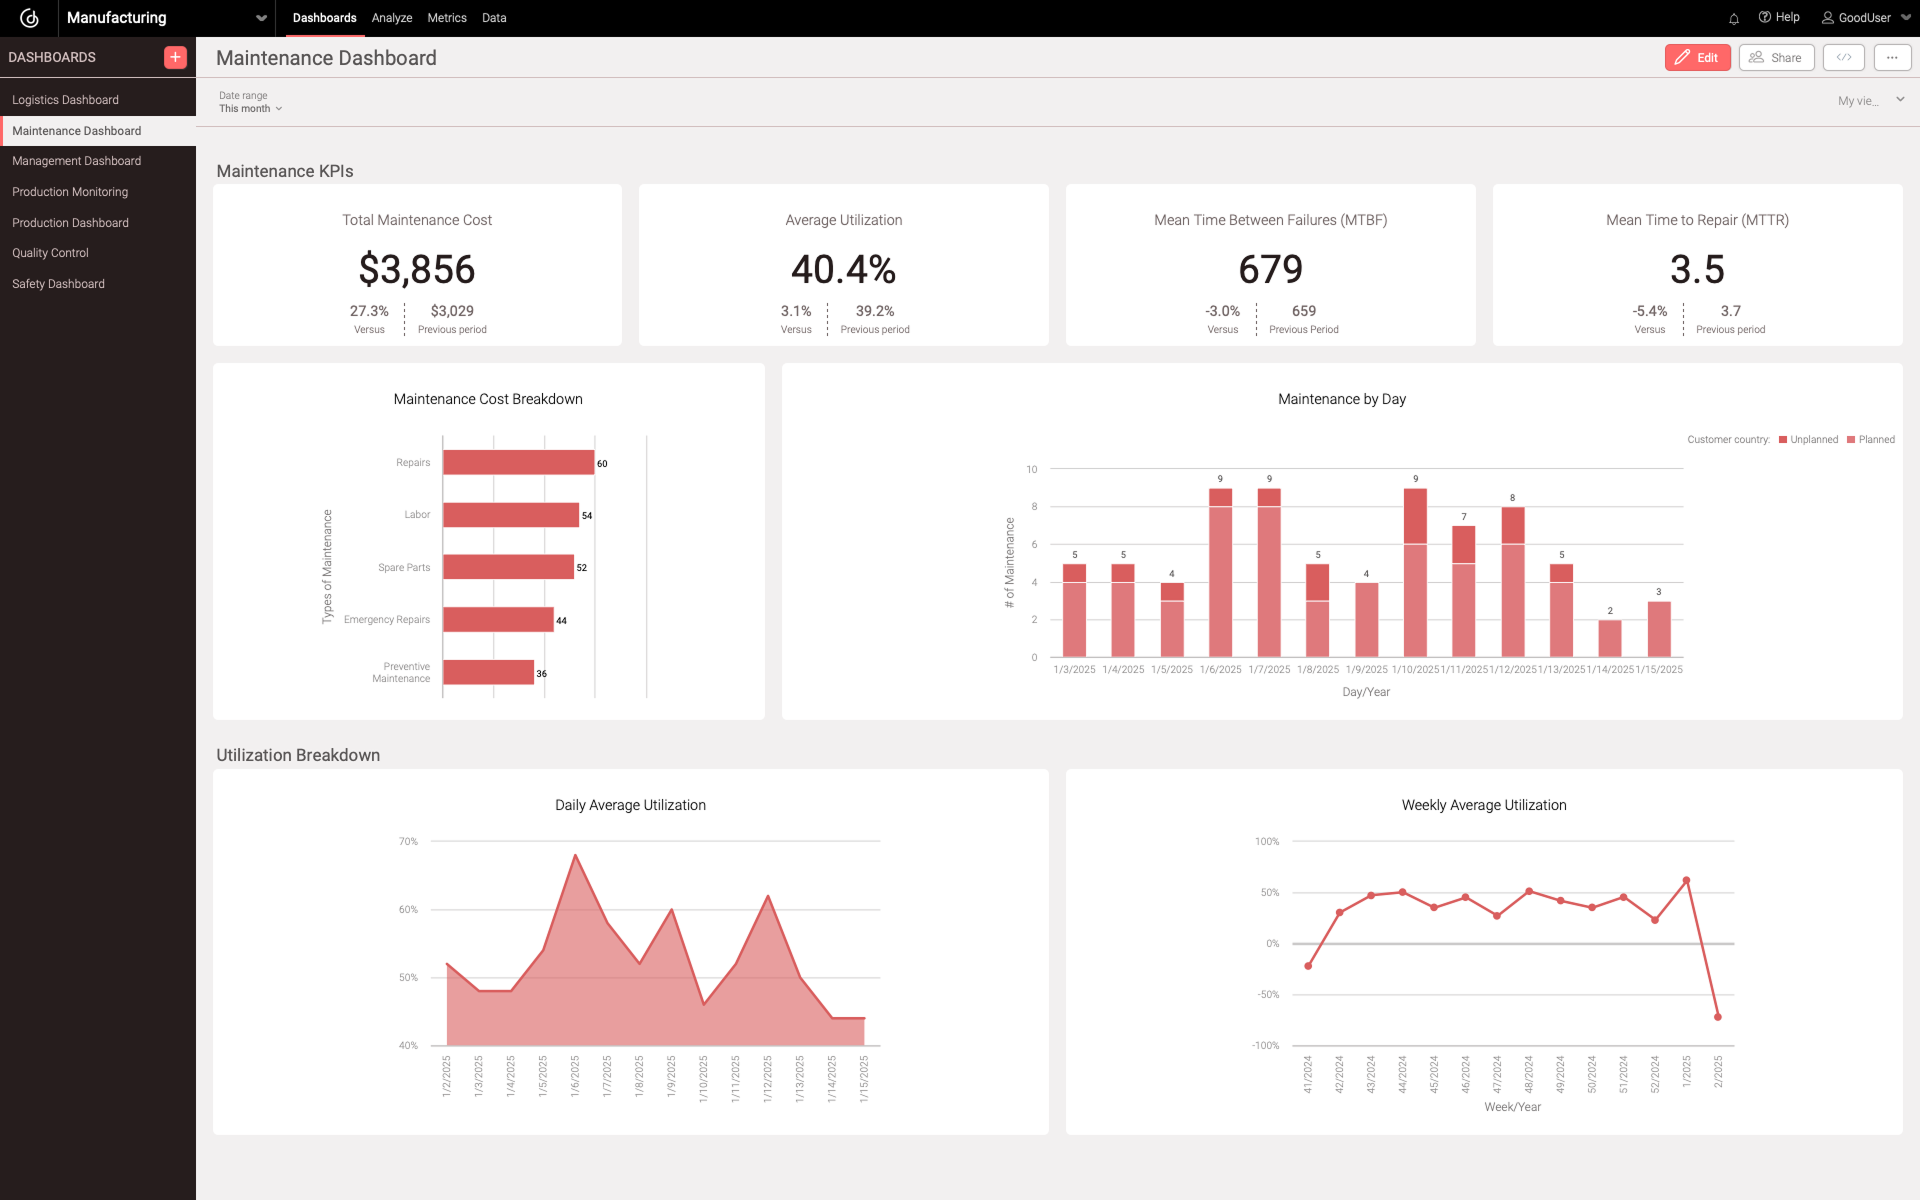
Maintenance dashboard (Click image to enlarge)
Quality Dashboards
Another common manufacturing dashboard is the quality dashboard, which tracks defects and helps with quality control and compliance. Defects per million opportunities (DPMO) helps measure overall defect rates, identifying trends in production quality. The customer complaint rate provides insights into product issues reported by end users, helping manufacturers address recurring problems. By comparing the number of compliant vs. non-compliant units, businesses can assess quality performance in real time. Analyzing the root causes of defects helps identify production issues early, making it easier to fix problems before they get worse. Lastly, the quality achievement rate (%) tracks the percentage of products meeting quality standards, ensuring compliance with regulations and customer expectations.
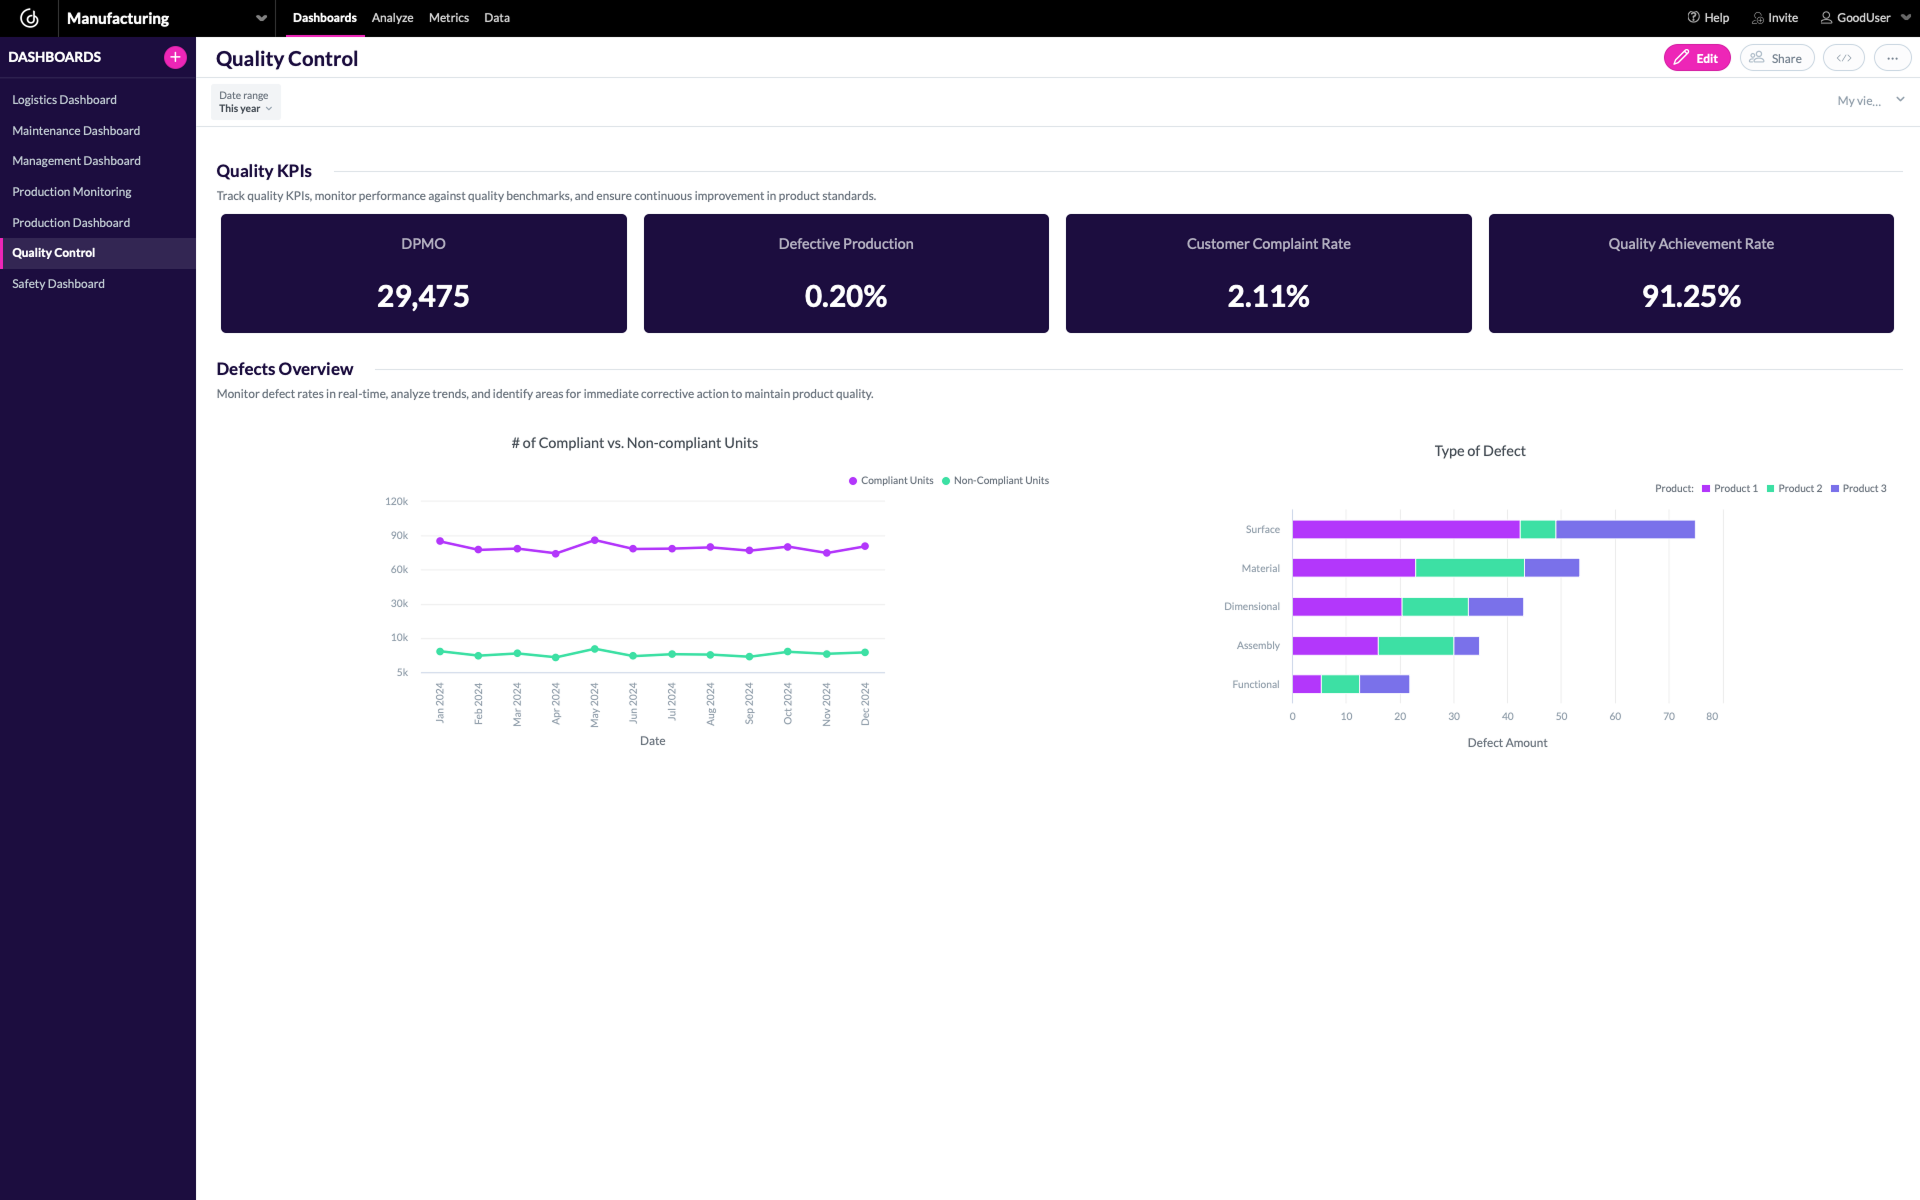
Quality control dashboard (Click image to enlarge)
Logistics Dashboards
Logistics dashboards help manufacturers keep an eye on inventory and the supply chain by tracking key metrics, ensuring everything runs smoothly and cost-effectively. Inventory levels (minimum, optimal, critical) help maintain a balanced stock, preventing overstocking or shortages. The inventory turnover rate measures how quickly stock is used and replenished, optimizing storage and cash flow. Supplier delivery punctuality tracks the reliability of suppliers in meeting deadlines, reducing disruptions in production. Transportation costs provide insights into shipping expenses, helping identify cost-saving opportunities. Finally, the unplanned stockout rate highlights unexpected shortages that can delay production and impact customer satisfaction. By monitoring these KPIs, logistics dashboards help manufacturers streamline supply chain operations and reduce waste.
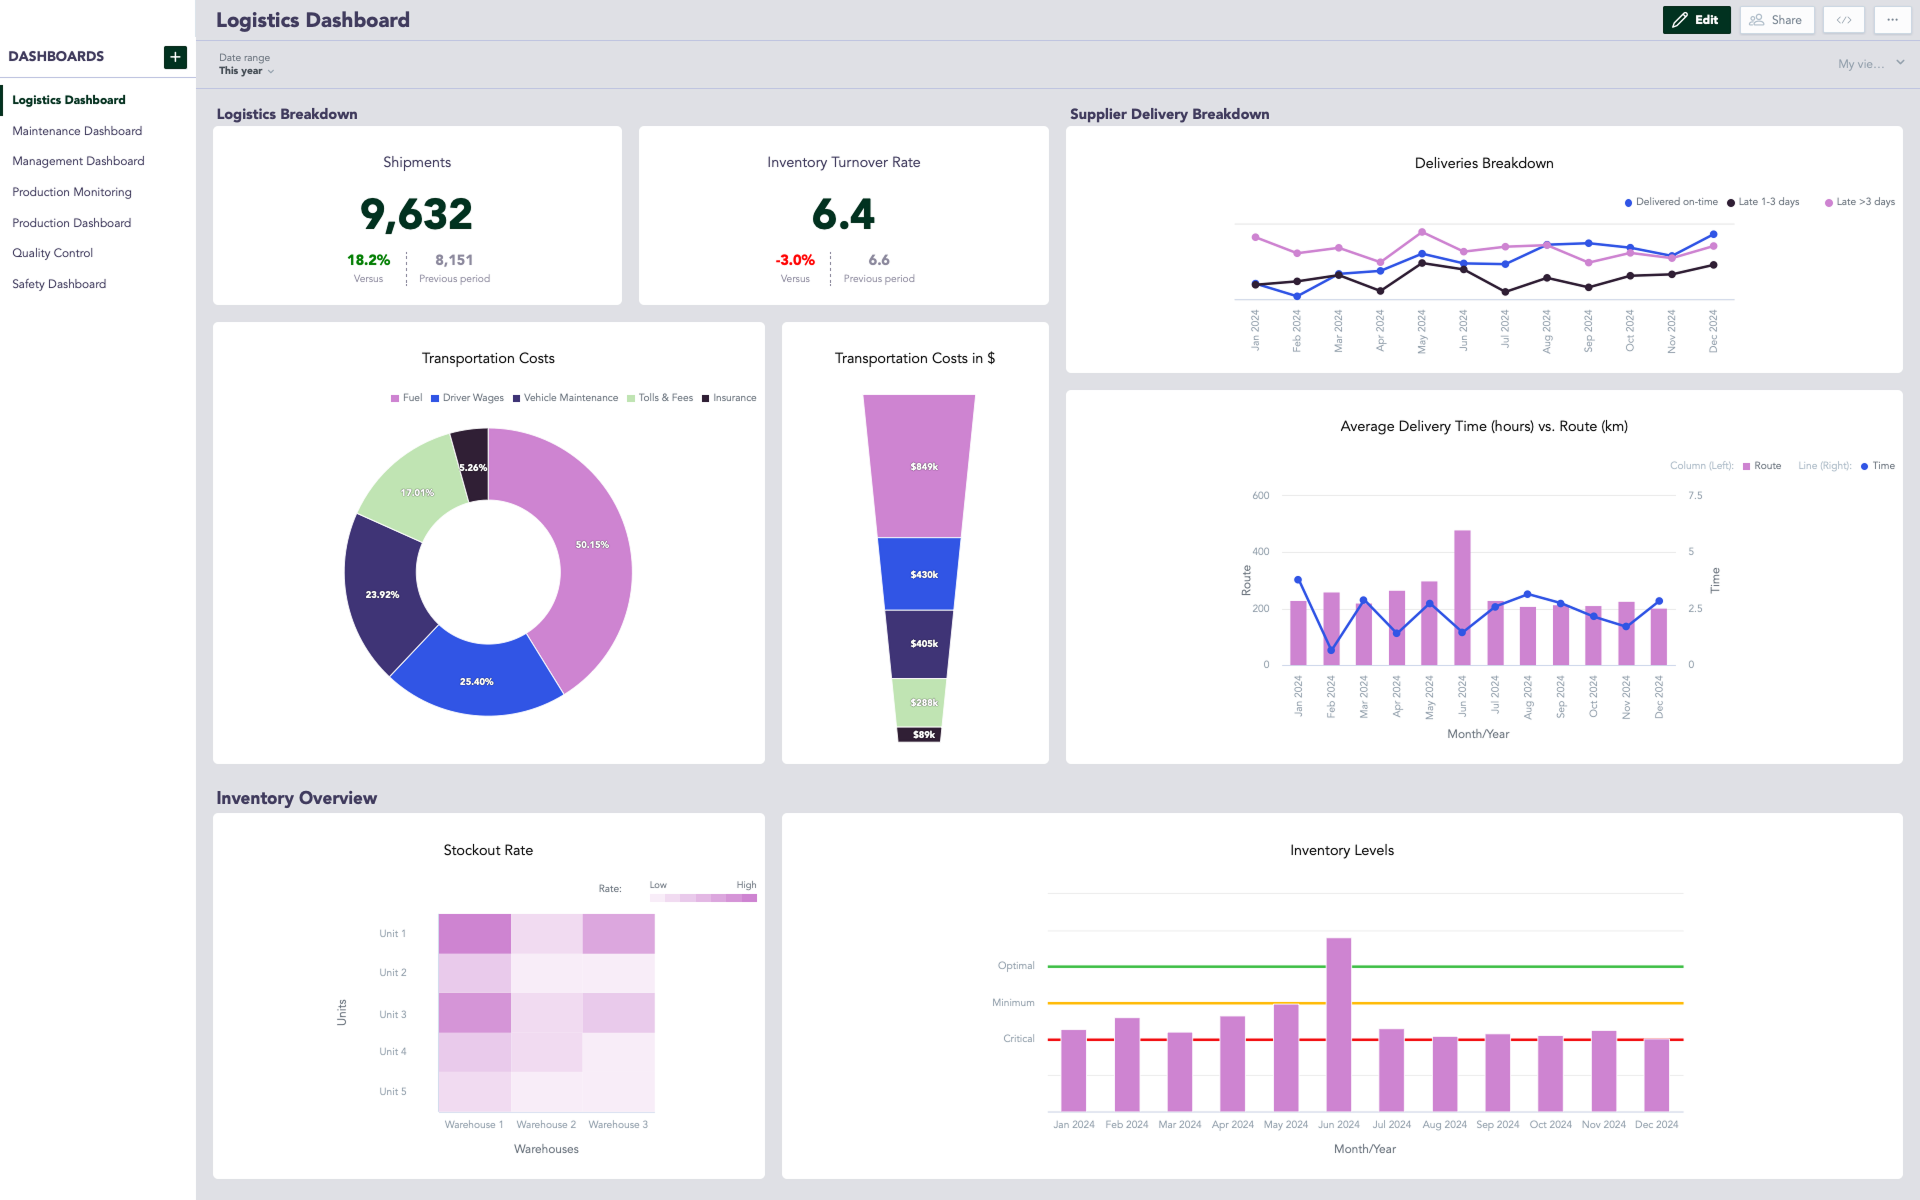
Logistics dashboard (Click the image to enlarge)
Safety Dashboards
Safety dashboards in manufacturing help keep the workplace safe by tracking key metrics to prevent accidents and ensure compliance with regulations. The number of accidents and injuries provides real-time insights into workplace incidents, helping identify trends and areas for improvement. Compliance with safety standards ensures adherence to industry regulations and internal policies, reducing legal and operational risks. Costs related to injuries measure the financial impact of workplace accidents, including medical expenses and lost productivity. Employee safety training programs track participation and effectiveness, ensuring workers are equipped with the knowledge to operate safely. Lastly, an overview of workplace risk areas highlights hazardous zones, enabling proactive measures to mitigate risks. Overall, the safety dashboard helps manufacturers create a safer work environment, reduce incidents, and promote a strong safety culture.
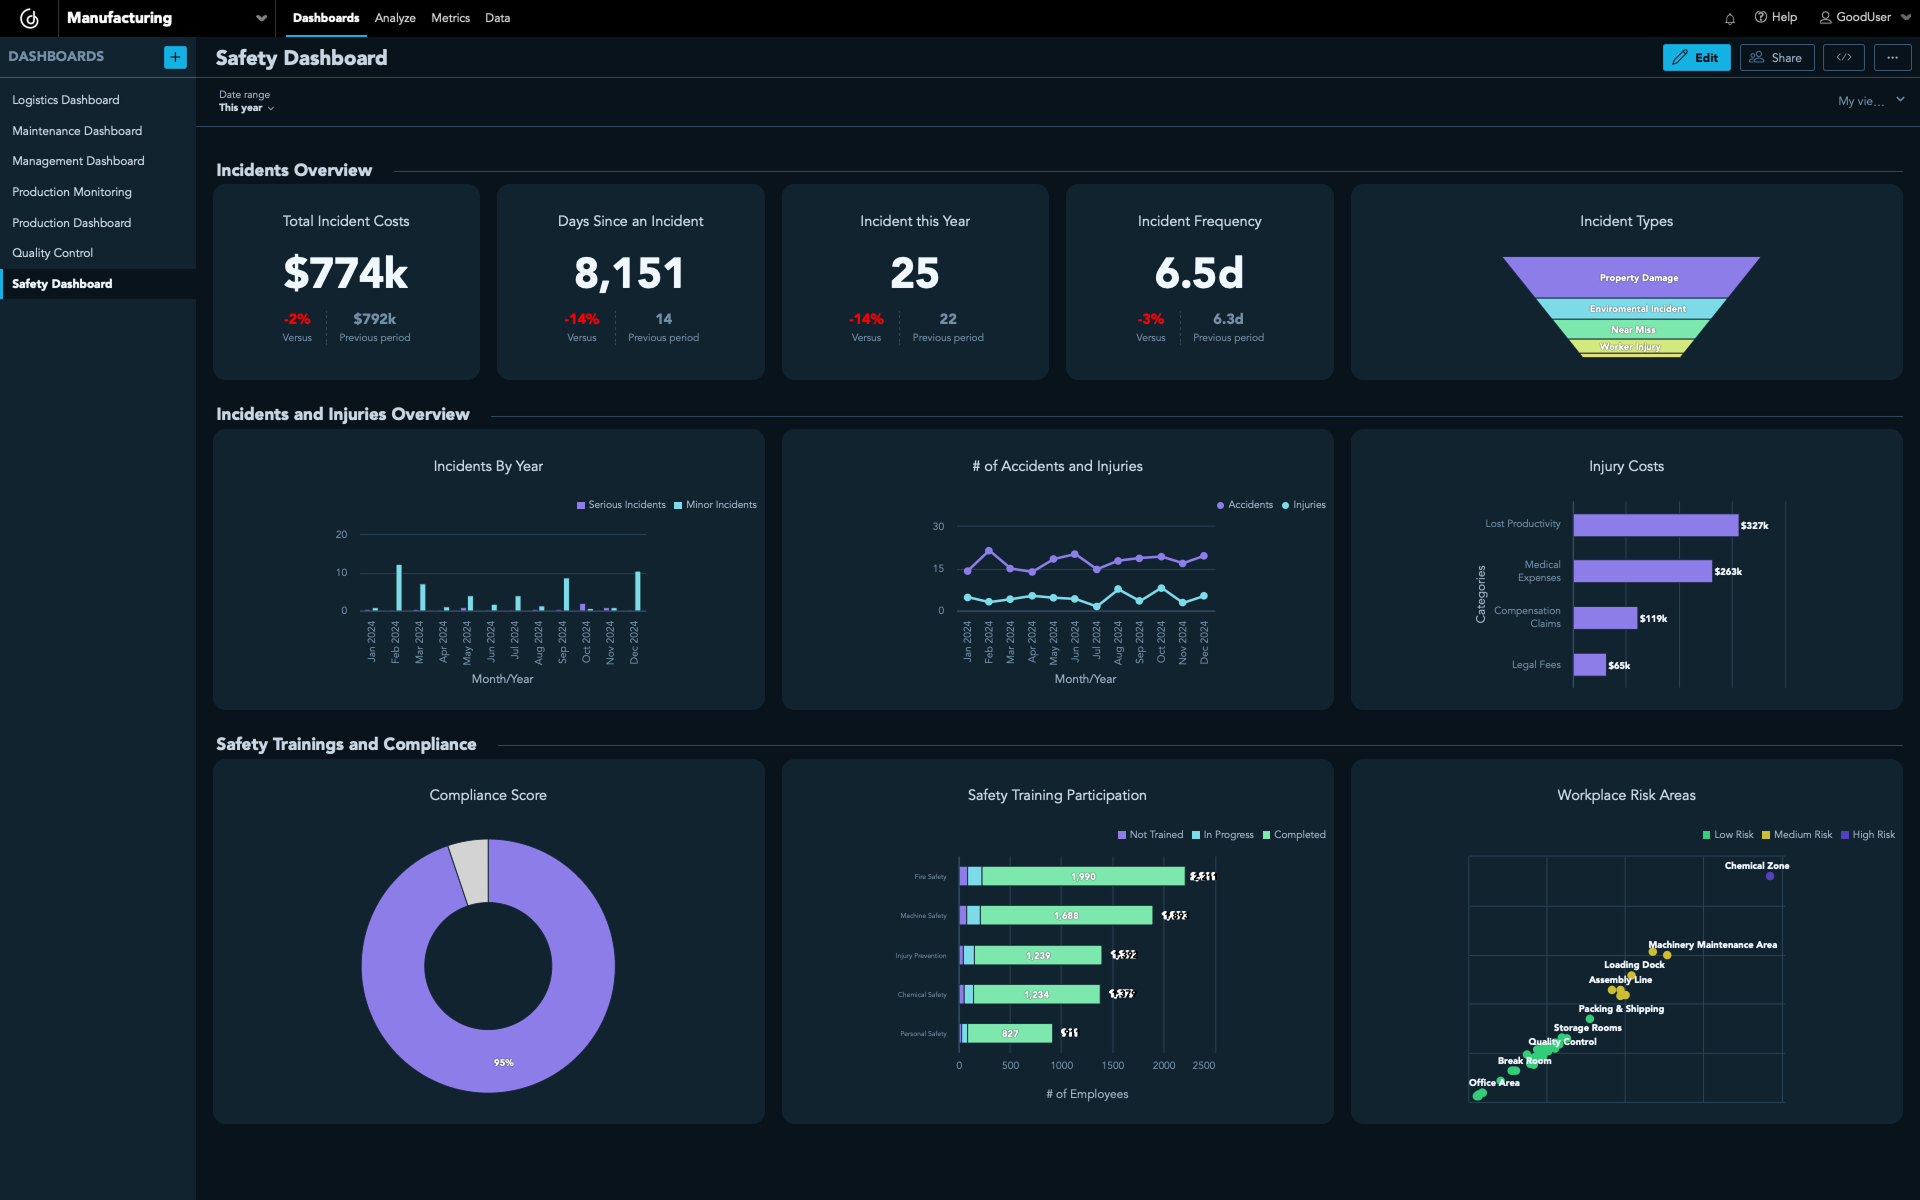
Safety dashboard (Click the image to enlarge)
Management Dashboards
Management dashboards in manufacturing track financial performance and key metrics, providing insights into costs, profits, and project progress. Total cost of ownership (TCO) for production helps assess long-term operational costs, including equipment, maintenance, and energy expenses. ROI of manufacturing assets measures the profitability of investments in machinery and infrastructure, ensuring optimal resource allocation. Revenue vs. cost per production unit provides a clear view of profit margins by comparing income generated with production expenses. Budget utilization percentage tracks how effectively financial resources are allocated, preventing overspending or underuse. Finally, the status of key projects ensures alignment with strategic goals by monitoring timelines, milestones, and overall progress.
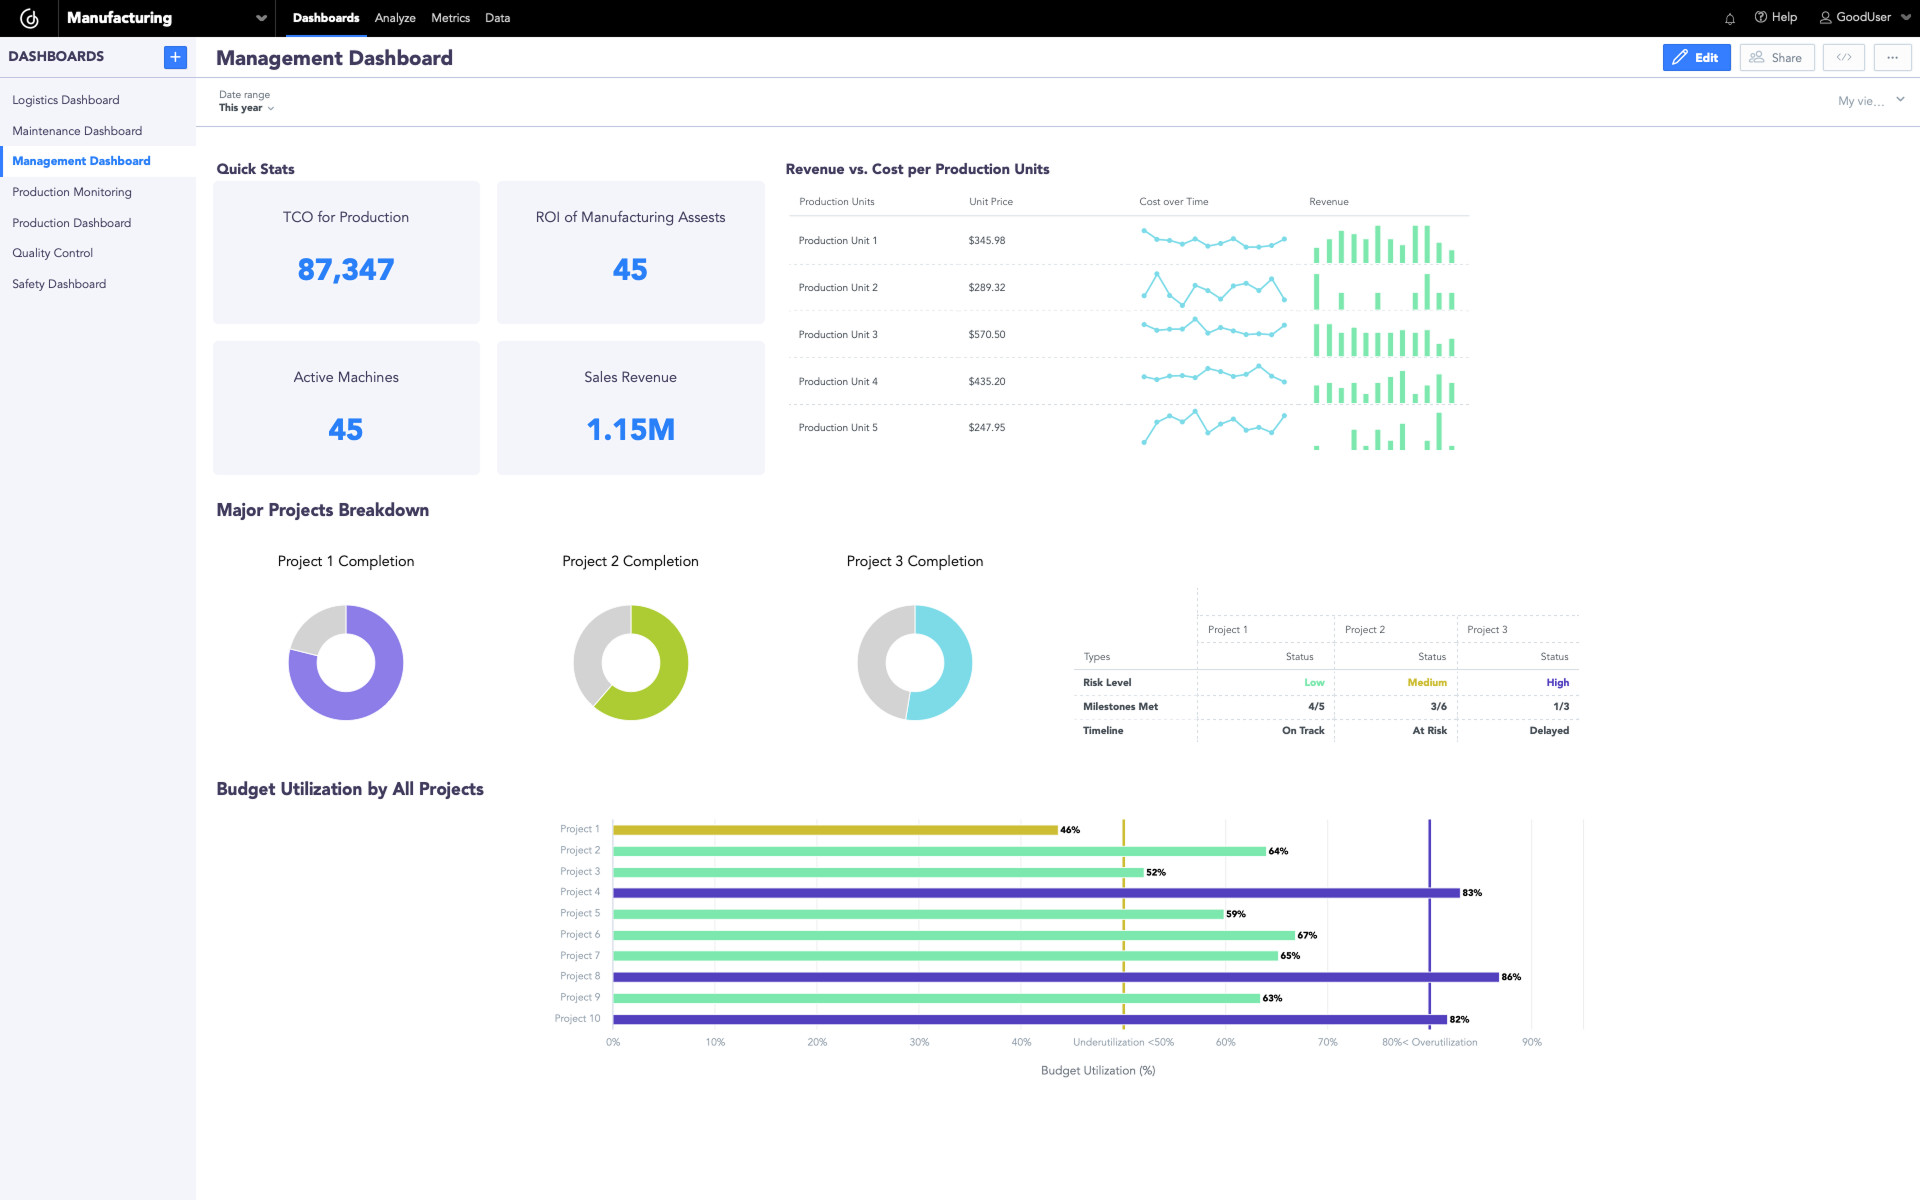
Management dashboard (Click the image to enlarge)
Comprehensive Manufacturing Operations Dashboard
Finally, a comprehensive manufacturing operations dashboard gives a clear view of key metrics across all major areas — production, quality, maintenance, logistics, and management. The goal is to keep everything running smoothly and efficiently. By integrating all data and KPIs into a single dashboard, manufacturers can get a holistic and unified view of their entire operation, allowing leadership teams to identify trends, detect inefficiencies, and make data-driven decisions that increase productivity and profitability.
Create Your Own Manufacturing Dashboards With GoodData
GoodData’s user-friendly analytics platform makes it easy to create manufacturing dashboards like the ones in this article. But while dashboards and drag-and-drop tools are key, they’re just part of what you need for a successful analytics strategy. A modern BI tool should go beyond simple visualizations and include advanced features like data modeling, scalability, automation, and seamless integration with your existing tech stack. With that in mind, be sure to check out the 11 must-have features for a modern BI tool that will take your analytics strategy to the next level.
Alternatively, take a look at our customer stories to see how businesses are using GoodData to create scalable, high-performance analytics solutions that are customized to their needs. Or, schedule a demo to see how our platform can help you drive operational excellence with a complete, future-ready BI approach.
FAQs About Manufacturing Dashboards
By visualizing real time data on equipment performance, bottlenecks, and workflow, a manufacturing dashboard helps teams identify delays, adjust schedules, and keep production on track.
Tracking stock levels, turnover rates, and reorder points within a manufacturing dashboard ensures materials are available when needed without overstocking or creating excess waste.
A quality-focused manufacturing dashboard monitors defect rates, first pass yield, and customer returns, making it easier to address issues quickly and maintain high product standards.
A safety-focused manufacturing dashboard tracks incidents, training completion, and hazard reports, helping management create a safer work environment and meet compliance standards.
Yes. Executives can view high level summaries, floor managers can track real time production status, and maintenance teams can monitor equipment conditions and downtime.
An effective manufacturing dashboard combines clear visualizations, automated data updates, and role-specific views so users can act quickly on accurate and relevant information.


