Improving Executive Reporting By Using Snapshots


A snapshot is the state of a system at a particular point in time. In this article, we will demonstrate how snapshotting certain attributes can improve your executive reporting with new and interesting insights, and thus effectively increase your business intelligence (BI) tool’s usability.
Why Do You Even Need Snapshotting?
When constructing a data product — whether for internal or external customers — one should always keep in mind that customers will want a certain level of filtering capabilities.
Most commonly, target customers will want to filter preset dashboards by Date. For most use cases, we are going to know when an activity started and when it ended, and therefore, we will be using those attributes for our filtering.
Let's consider the Sales Opportunity dataset as an example.
Imagine a dashboard being filtered by when the Sales Opportunity was created or when it was closed. Both of those dates are really useful because they tell us the story of how successful we are both from a marketing perspective (is there progress on previously opened Sales Opportunities by month?) and from a sales perspective (did we manage to win more Opportunities than in the previous month?).
However, there are other questions that those dates alone cannot answer. For example:
- How many Opportunities were active (not closed, regardless of when they were created) in the previous week?
- What is the current Won rate, and how is it changing over time?
- How are our Opportunities progressing between stages? Are we moving enough of them toward the Won stage?
For those cases and many others, we can use something called snapshotting.
What Is Snapshotting?
As mentioned, the start date and end date are present for most of our reporting needs. How snapshotting enhances our analytics is quite simple. By looking at all the dates within the selected period, snapshotting provides us with the exact dates of when the Opportunity was valid or active.
The example of Soft Drink Company’s life cycle below should paint a clearer picture.
1. Generic Opportunity Table
| Opportunity Name | Created Date | Closed Date | Current Opportunity Stage |
|---|---|---|---|
| Soft Drink Company | 1/1/2022 | 1/4/2022 | 4 - Getting Finalized |
2. Table Using Snapshotting
| Opportunity Name | Opportunity Validity Date | Historical Opportunity Stage | Stage Priority |
|---|---|---|---|
| Soft Drink Company | 1/1/2022 | 0 - Created | 0 |
| Soft Drink Company | 1/2/2022 | 1 - Learn | 1 |
| Soft Drink Company | 1/3/2022 | 2 - Strategy | 2 |
| Soft Drink Company | 1/4/2022 | 4 - Getting Finalized | 4 |
As you can see, the Opportunity Validity Date column now contains all the dates when the Soft Drink Company Opportunity was active (the dates between the Created Date and the Closed Date). Another piece of key information provided by table 2 is the Historical Opportunity Stage. Utilizing this column helps to clarify the corresponding stage of its life cycle.
Keep in mind that there are several things you will need in order to create a similar table.
Experience GoodData in Action
Discover how our platform brings data, analytics, and AI together — through interactive product walkthroughs.
Explore product toursPrerequisites to Building a Table Using Snapshotting
Having a generic calendar table in your database: When using a Snowflake database, follow the Snowflake guide to create such a table. Or, to do the same on top of your Vertica database, follow the Vertica guide.
Once the generic calendar is ready, the following join should do the trick:
JOIN generic_calendar c on c.date between CreatedDate AND ClosedDate
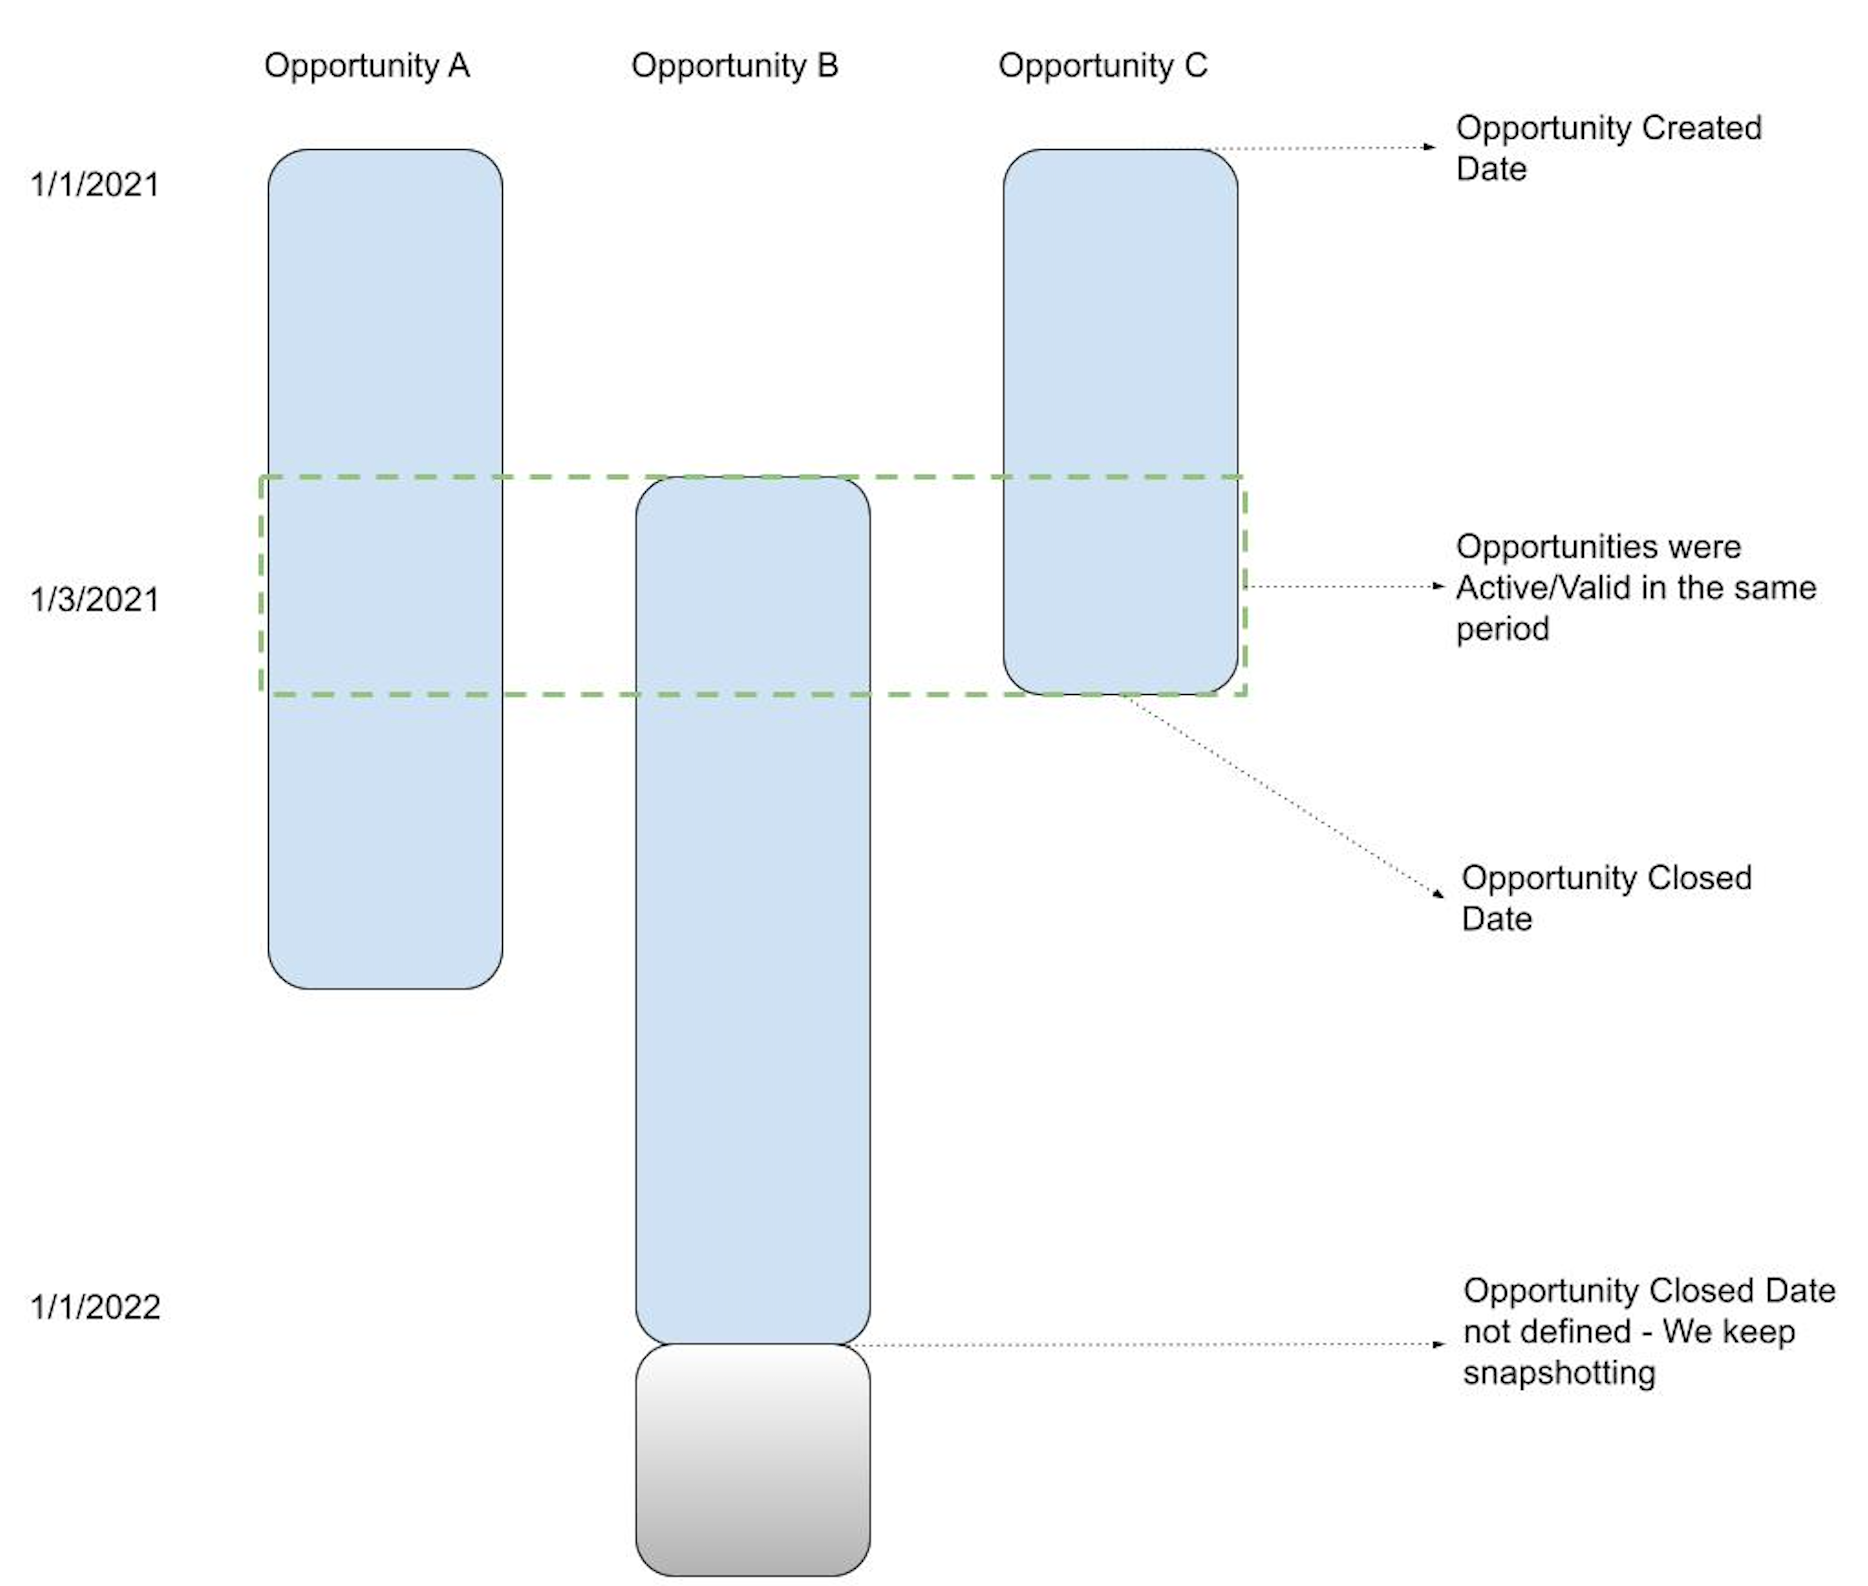
Note: In cases where Closed Date is empty, it may make business sense to replace Closed Date with Current Date or with some hardcoded distant date in the future (e.g., 1/1/2050). Adjusting the end date will make sure that Opportunities that were already Closed are not going to be moving further in our reports, while also enabling us to see the snapshots of Opportunities that remain open and do not have the expected Closed Date defined. See the image below for further clarification.

Historical Opportunity data: Take Salesforce as an example. The information we need for the Generic Opportunity Table is going to be available in the generic Opportunity entity. However, this entity does not track changes to the Opportunity by default. To populate the Historical Opportunity Stage column, we will need an Opportunity History entity in our database, as well. Again, this is related to Salesforce usage; feel free to adjust based on your own CRM toolstack.
Stage Priority: This may not seem important at the moment, but it will make life much easier when constructing reports in our data project. Let’s dive straight into troubleshooting by considering the following scenario:
We are asked to show all Active Opportunities and their respective stages for the previous week. It is quite likely that some Opportunities fell into multiple stages in the previous week (i.e., moving between stages). Looking at our example, we notice that during the same week, the Opportunity was in Stage 0 and Stage 1. As we don't want any duplicates in our report and we know that the Opportunities have only moved up a stage, we can decide only to track the latest stage the Opportunity was in the given week. Having the Stage Priority Column helps us do that.
However, don't worry about it now: We will utilize MAQL — GoodData's analytical query language — later to do just that.
Enhance Your Executive Reporting With GoodData
With the Snapshotting Table ready in the database, what remains is to publish this table to the BI tool of your choice and the creation of the desired reports and dashboards.
We will be finalizing those tasks using GoodData. To start using GoodData, register for our free trial. Or, be sure to explore demo options here.
First of all, loading data into your project is going to be dependent on the construction of a logical data model. (To read more about the data model, refer to our data modeling guide.) For our use case example, it would be sufficient to use a simple one like this:

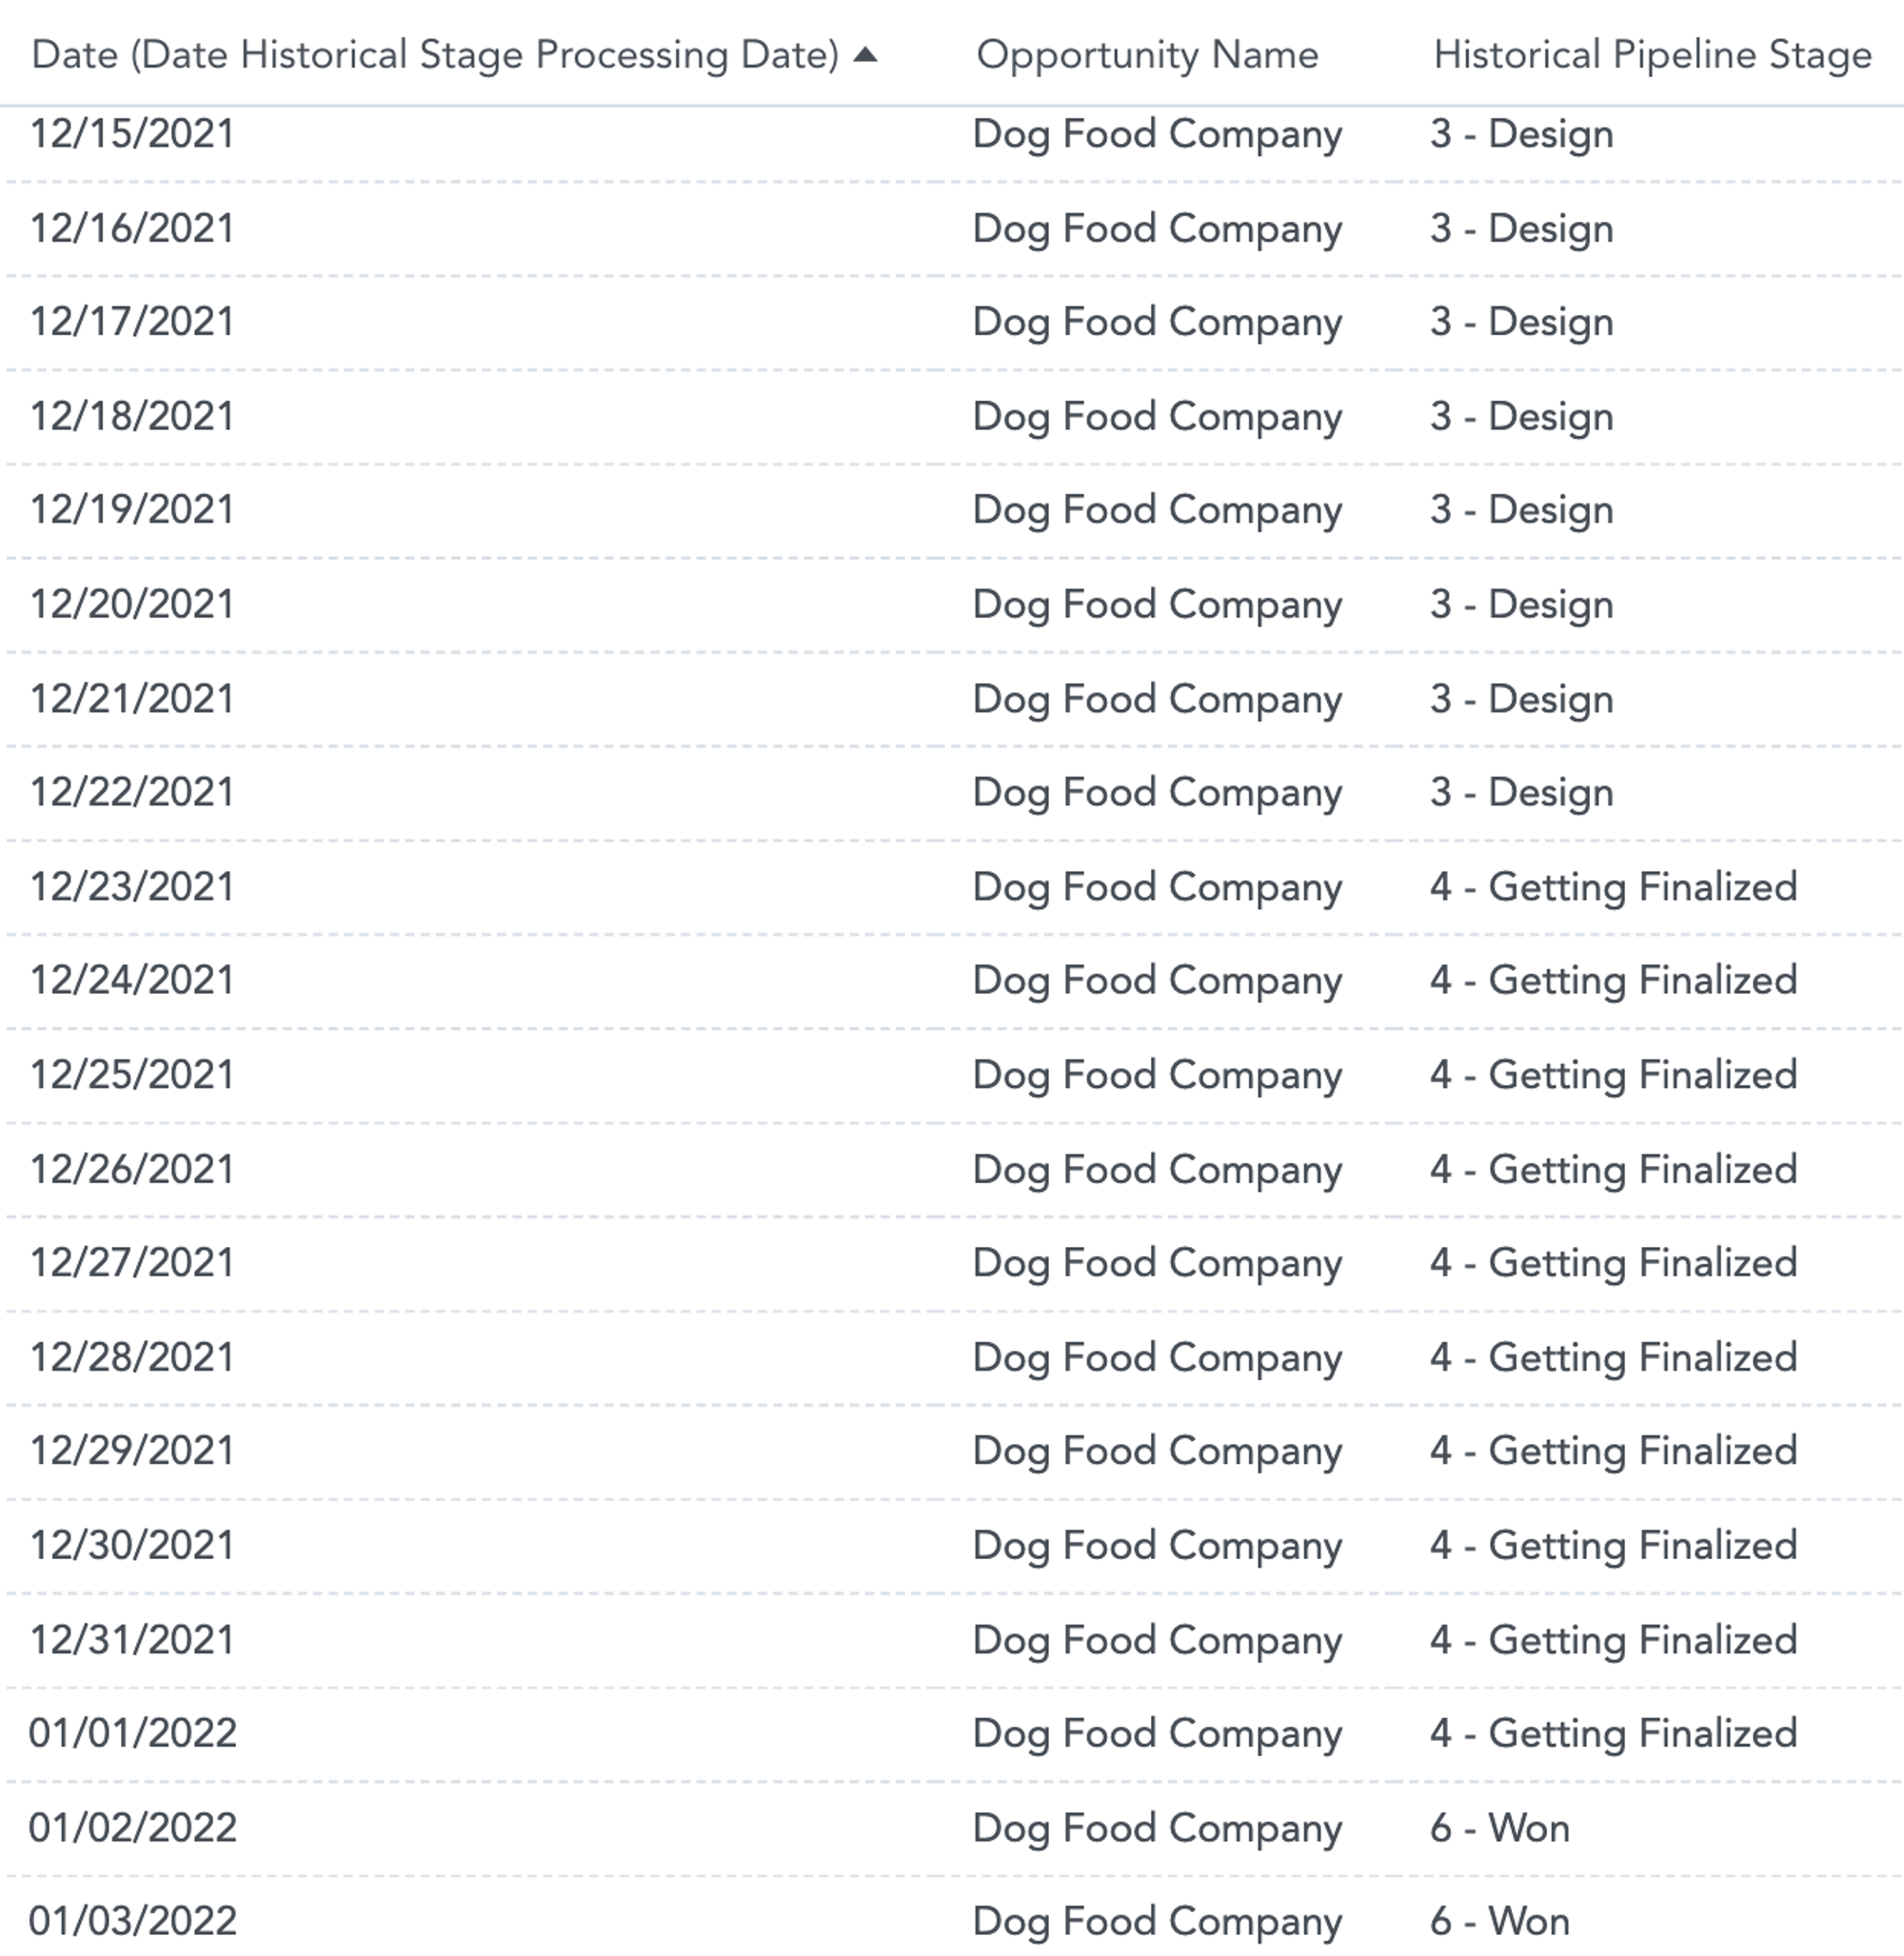
After loading the data based on the created data model, we can now test whether the desired data structure was actually created. As is visible from the example below, we can easily see all the dates in which the Opportunity was active, and we can see the corresponding stage of each date.
In the next section, we will demonstrate how this information could be utilized to improve executive reporting and the existing BI solution. The below table is created using GoodData's Analytical Designer. For more information, check out our Analytical Designer documentation.

Using Snapshotting in Your Reports
Once the model is published and we understand the structure of our data, we will utilize MAQL by creating a metric called Pipeline Opportunities, which could look something like this:
SELECT COUNT({label/label.opportunity.opportunityid},
{label/label.opportunitypipeline.historicalstage})
    WHERE (SELECT MAX({fact/fact.opportunitypipeline.stagepriority})
    BY {label/label.opportunitypipeline.historicalstage}) =
    (SELECT MAX({fact/fact.opportunitypipeline.stagepriority})
    BY ALL {label/label.opportunity.opportunityid}, {label/label.opportunitypipeline.historicalstage})
What we are effectively doing is selecting the Maximum Stage Priority value for each Opportunity within the Opportunity Pipeline table. As mentioned earlier, this will help us when trying to select a certain period that would potentially duplicate the Opportunity count (because multiple Stage changes happened in the selected period).
Be aware that this is a particular use case and MAQL can help you with any other business logic you may have instead. You may want to disregard the Stage Priority attribute completely and only select the stage at the latest date of each week; all of that would be possible in MAQL. (To learn more about MAQL, be sure to visit MAQL documentation.)
Using the created metric on top of our adjusted data model, we can access reports such as the one below:

Instead of simply stating how many Opportunities we created or closed in a certain period, we now can see whether the Opportunity Pipeline is increasing or decreasing. We are also capable of saying whether we are pushing the Opportunities toward the later stages of the negotiation process.
Let’s go back to the questions that previously could not be answered:
- How many Opportunities were active (not closed, regardless of when they were created) in the previous week?
We can now easily answer that. - What is the current Won rate, and how is it changing over time?
We are able to look at how many opportunities we won in the previous quarter and then divide this number by what we had in our Pipeline in the same period. This is now achievable. - How are our Opportunities progressing between stages? Are we moving enough of them toward the Won stage?
We can provide the leadership team or our customers with an accurate development of the Pipeline situation.
In summary, while snapshotting may seem like a big task, it is definitely worth exploring to enhance your executive reporting. Presenting week-over-week changes of certain business aspects will help your customers make the correct decisions while also making your own business or analytical solution thrive.
Experience GoodData in Action
Discover how our platform brings data, analytics, and AI together — through interactive product walkthroughs.
Explore product toursHeader photo by Christina @ wocintechchat.com on Unsplash


