How To Build Sales Analytics
Written by Patrik Braborec |

Table of Contents
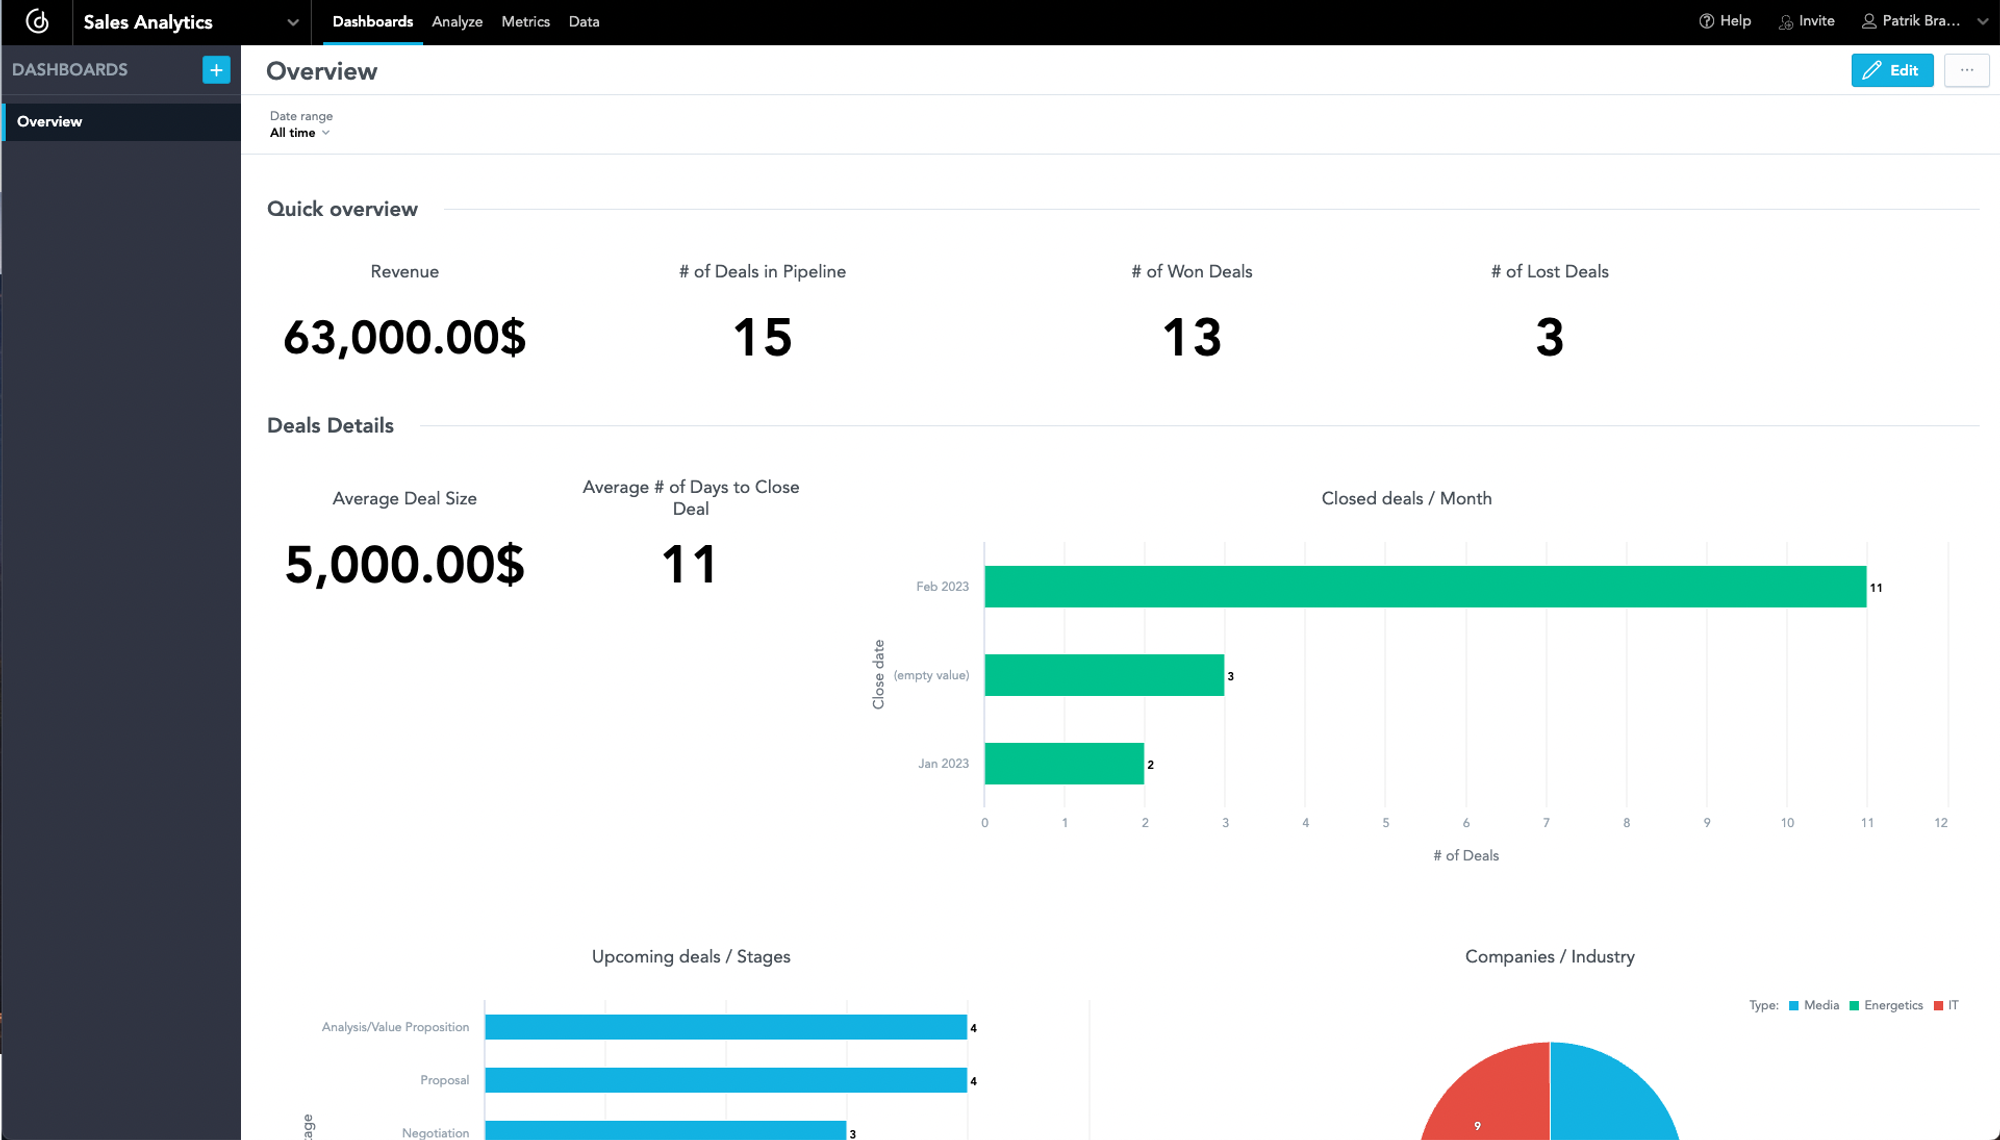
A good CRM (Customer Relationship Management) software helps businesses keep deals up to date, tracks customer interaction, and manages customer accounts. Based on these facts, it is also important to be able to analyze data supplied by the CRM software to improve numbers. You can only improve numbers by knowing what you are doing right and what you are doing wrong — that’s why analytics should be part of your sales activities. In this article and demo, we will focus primarily on the technical aspect of such analytics, and the result will be as the following image shows — a single dashboard with all of your sales analytics centralized in one place!

Example of Sales Dashboard
Create CRM (Customer Relationship Management)
We have to start with the basics. In order to create analytics, we need data! For this purpose, let’s use Airtable. Airtable will allow us to set up tables to our (simple) specifications and has great support for developers (APIs and SDKs), so you can extract data easily!
Airtable is not the first software you usually think of as a CRM, but in this case, let’s go for simplicity. I describe my idea of using different data providers (in this case, a CRM software like HubSpot, Outreach or Salesforce) in a later chapter — Few More Words About Architecture. At the end of the day, the important thing here is the analytics that we will discuss in the following chapters — CRM is “only” the source of data.
The CRM in Airtable has three tables: Deals, Companies, and Contacts. These tables gather information about your customers in one place:

Example of CRM in Airtable
The Airtable gives you enough flexibility to add another column or even another table. It is really up to you how you will set it up. The goal of this article is primary analytics and not the design of CRM — therefore, let’s jump into the next chapter Architecture of Sales Analytics.
Tip: you can check the whole CRM in Airtable.
Why not try our 30-day free trial?
Fully managed, API-first analytics platform. Get instant access — no installation or credit card required.
Get startedThe Architecture of Sales Analytics
The whole architecture relies on four technologies: Python, PostgreSQL, dbt, and GoodData.
Let’s skip the introduction to Python and PostgreSQL because these technologies are well-known in the data engineering community, and there is no need to introduce them again. One interesting point is that I used bit.io which is free-hosted PostgreSQL, and it works really well!
The technologies dbt and GoodData will help us first transform data (dbt) to the shape we want and build analytics (GoodData). By analytics, I mean metrics, visualizations, and dashboards. The reason why I chose dbt is that it is widely used for this type of work (transformation of data) and has a huge community.
GoodData will help not only with analytics (metrics, visualizations, and dashboards) but also, thanks to its GoodData Python SDK, it gives you the option to manage everything with code (versioning, testing, etc.). That’s what I want! I want to write the code, that manages the whole analytics, only once and then let the automation magic do its thing without my constant intervention. How does it look and work? It is the one data pipeline!

Architecture of Sales Data Pipeline
The image describes how the pipeline works — CRM data lives in Airtable, from where you can easily extract the data through Airtable API or pyairtable (python wrapper around Airtable API). What to do with the extracted data? Ideally, move to the next phase and load to the database — that’s where PostgreSQL shines. Unfortunately, extracted and stored data is not in the structure we want for analytics. Fortunately, dbt will help us with that! The last step of the whole data pipeline is analytics which represents GoodData.
The Sales Data Pipeline
The code is hosted on GitHub. Therefore it comes in handy that GitHub has GitHub Actions where I can run every step of the pipeline, from extracting data to analytics. I can trigger the data pipeline by a push to a repository. Also, I set up a scheduler that runs the pipeline every night at 2 AM!

Sales Data Pipeline in GitHub Actions
If you want to dig deeper, you can check the whole repository good-crm-analytics. For the sake of simplicity, I’ll just show three key things from the data pipeline: GitHub Action Workflow, dbt model, and analytics code.
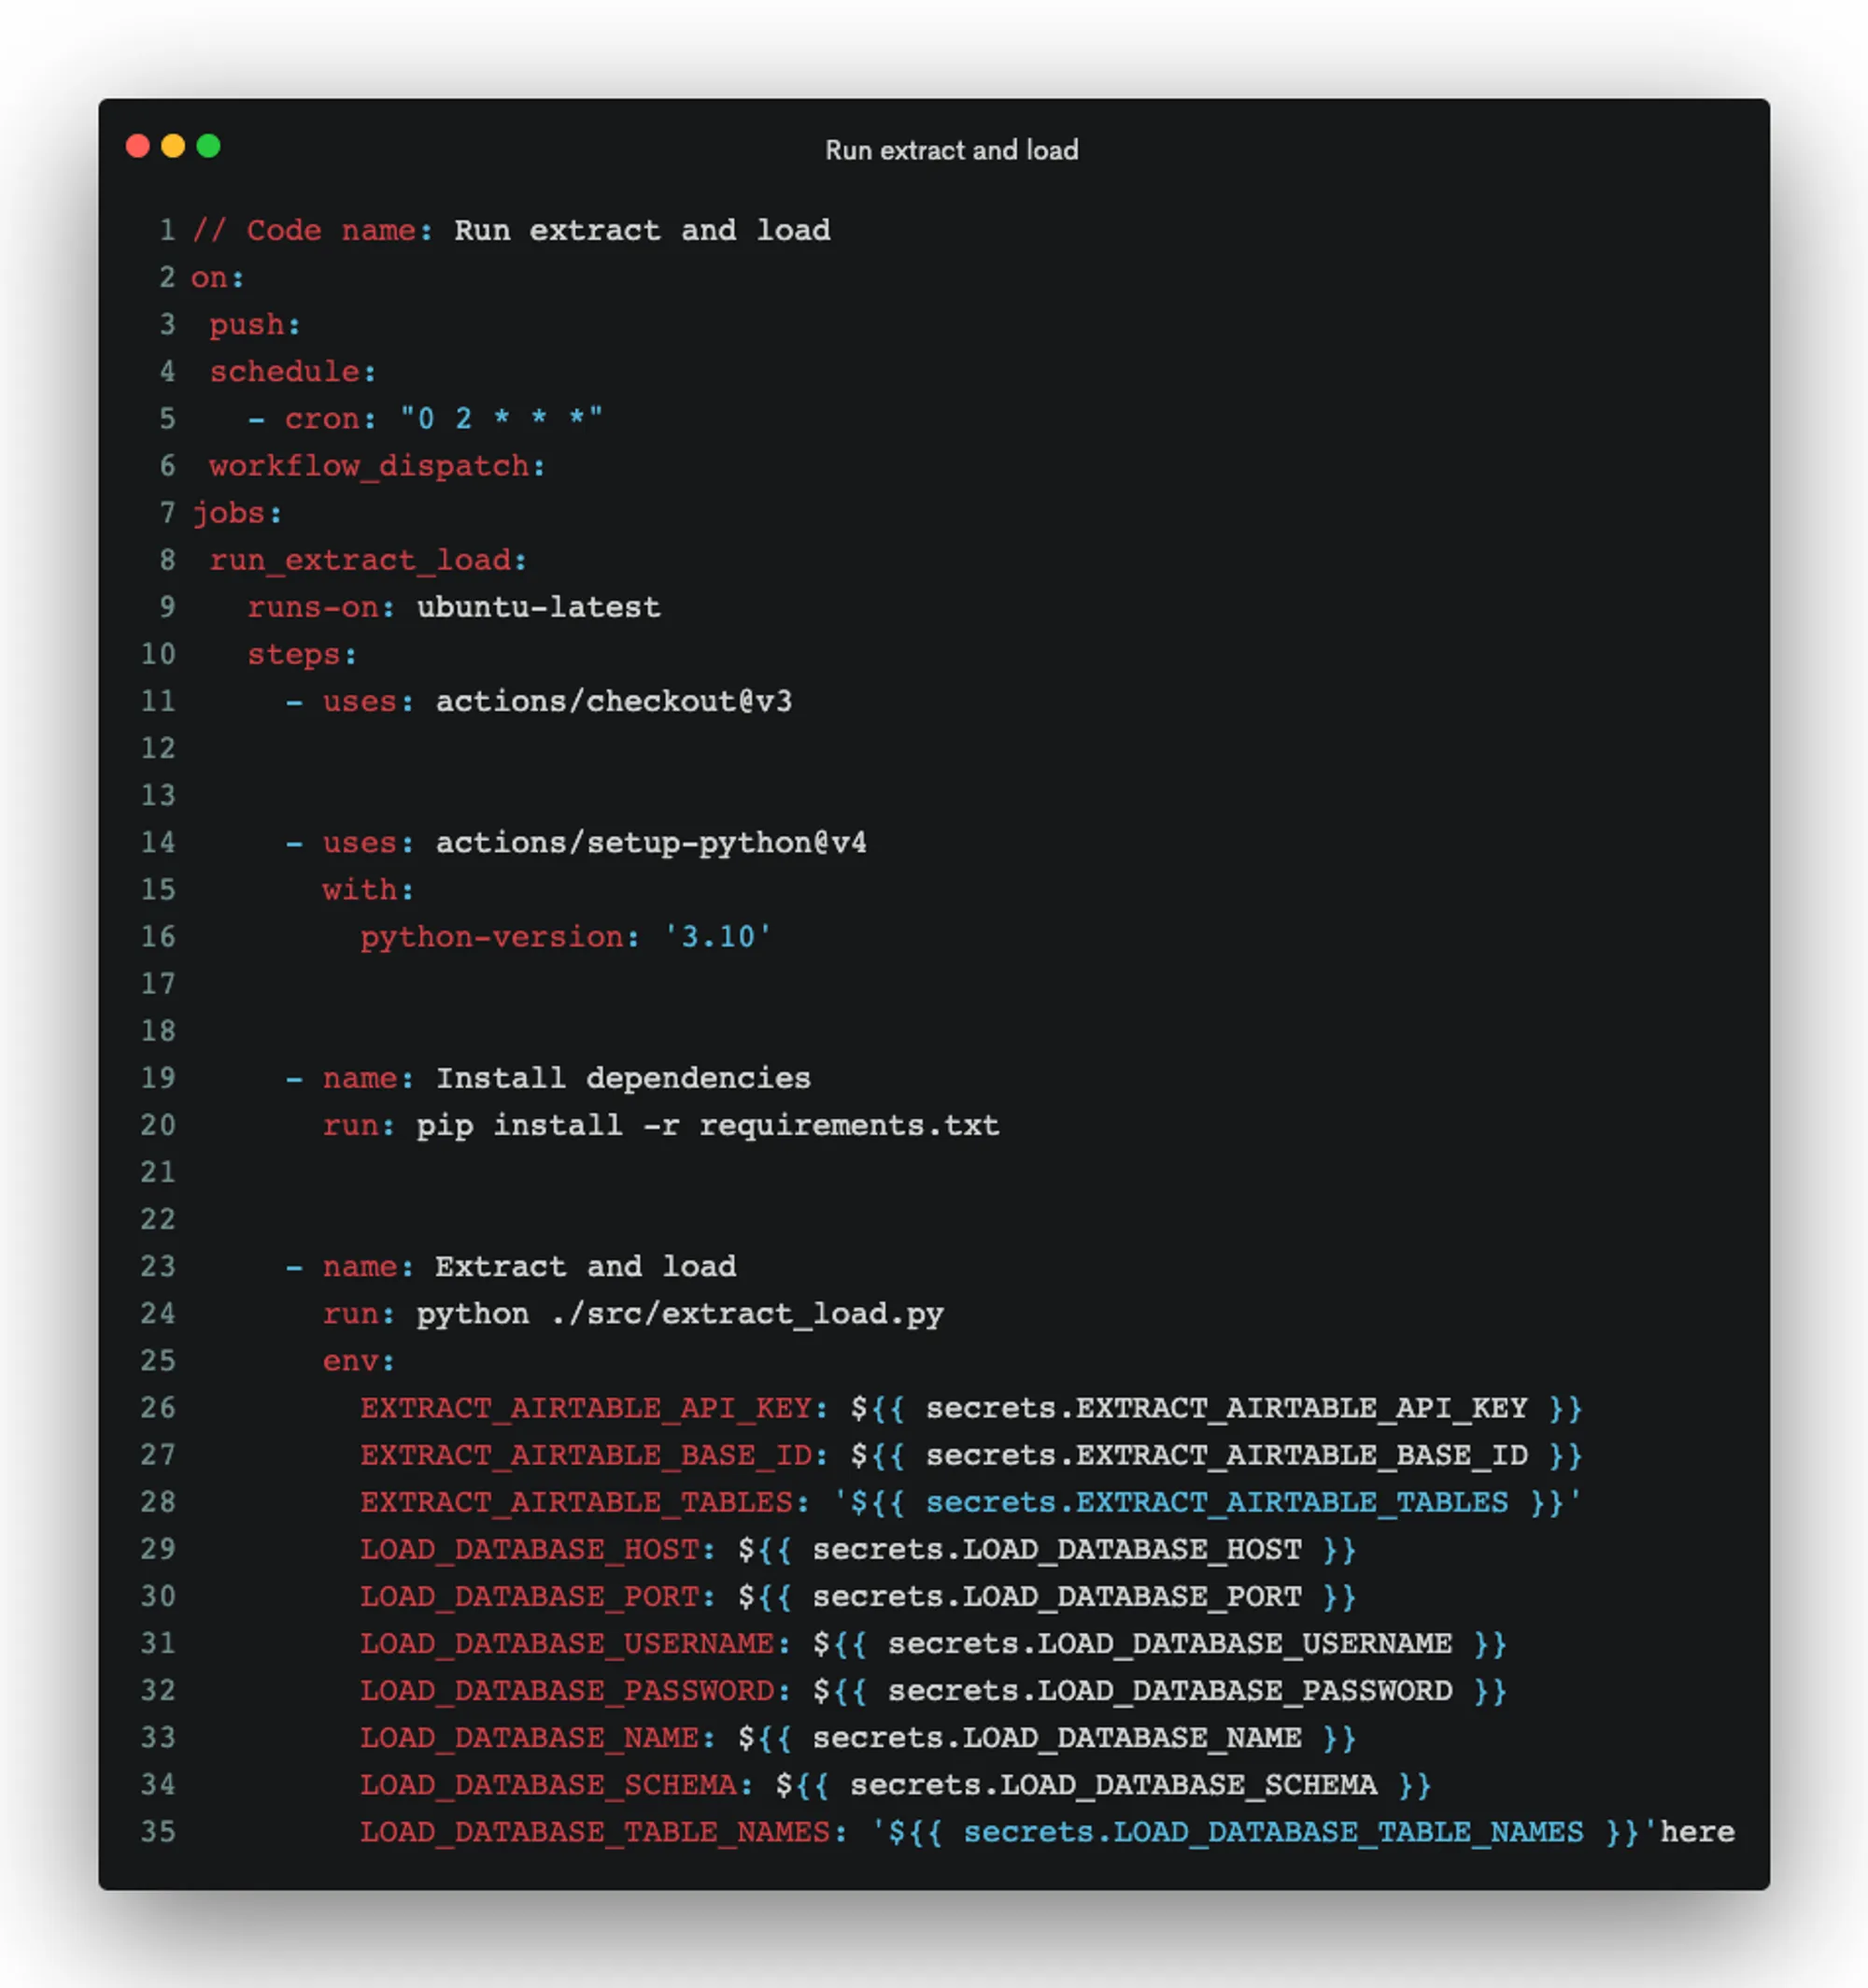
GitHub Action Workflow
This is the first GitHub Action that runs and triggers two other GitHub Actions (Run dbt and Run analytics). Briefly looking at the code, you can see that it sets up the environment and runs a python script where the extract and load job is done. One interesting thing is the cron job that triggers this GitHub Action at mentioned 2 AM. Data is loaded to PostgreSQL schema input_stage in JSON format.

Example of GitHub Action
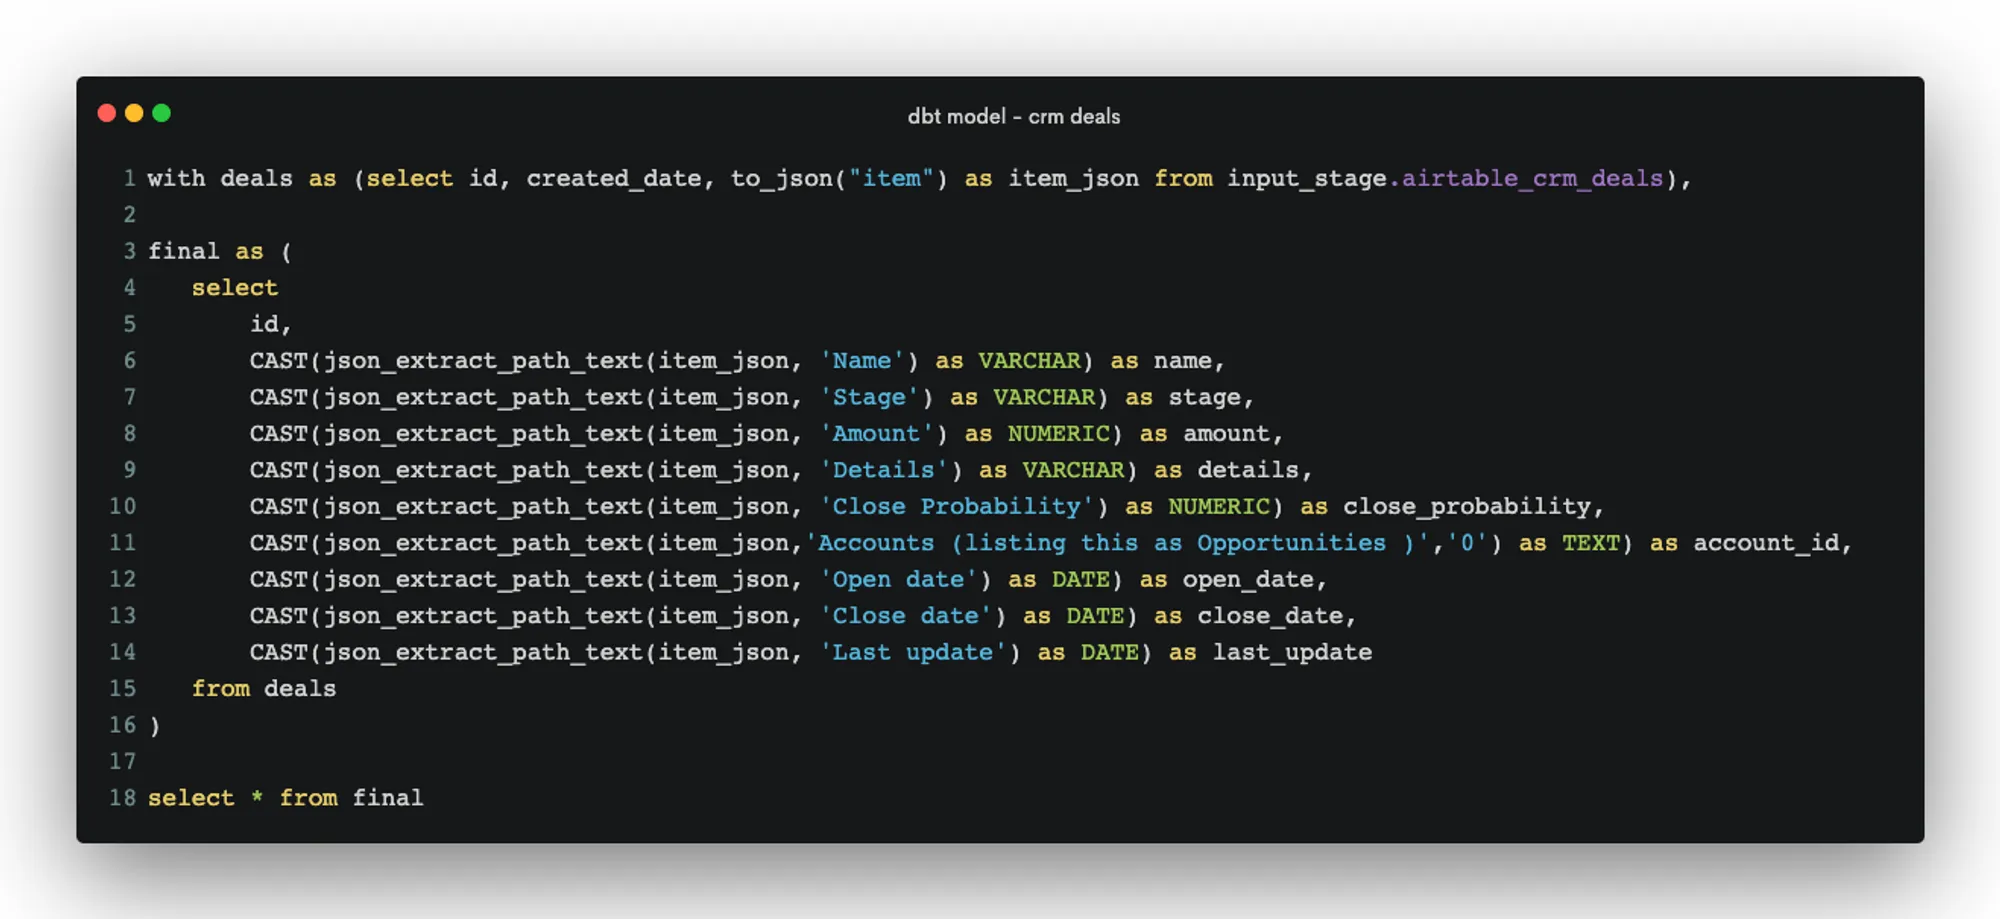
Dbt Model
The following model (SQL script) extracts data from JSON. You can see at the top of the SQL script that data is queried from input_stage (data was loaded there, as mentioned above). After transformation, which is mainly done using the json_extract_path_text function, data is loaded into output_stage. In the script, you can see only select * from the final query — load into output_stage is the job of dbt. For more information, check the configuration file.

Example of dbt Model
Analytics Code
The last step of these code examples showcases analytics as a code approach. As I mentioned earlier, the data pipeline runs every night at 2 AM. Everyone wants to see fresh numbers in the morning! According to the documentation, GoodData creates data caches to store queried data and optimize performance. It is great! You do not want to wait for ages to see reports, but on the other hand, you want to see fresh numbers. GoodData provides the mentioned GoodData Python SDK and which means you can run the invalidation of the cache as part of your pipeline, and you do not need to go to UI and invalidate the cache manually. Invalidating the cache prompts GoodData to query fresh data. This is quite a simple use case, but you can, for example, test all your reports, or version the whole analytics! For more information, you can check the article How To Build a Modern Data Pipeline.

Example of Analytics Code
A Few More Words About Architecture
Before I demonstrate how the data pipeline runs, I want to add a few words about the architecture described above. I read a great article, The Rise of Data Contracts, where the authors describe the idea of so-called data contracts. Long story short, data contracts are agreements, similar to APIs, between software engineers who possess services and data consumers who understand business operations. These agreements result in the creation of well-designed, reliable, trustworthy data.
I have been thinking about data contracts and concluded that it would be great to implement this principle in data pipelines. Can we define an industry-wide data contract for CRM data?

Improved Architecture of Sales Data Pipeline
If so, we could build strong and well-tested data pipelines, from load to analytics, where the data contract would define the input (data from the extract phase). We could also define other data contracts for other industries and end up in a world where we do not need to build new data pipelines repeatedly for every use case but rather use existing data pipelines. Of course, this has a lot of issues that would need to be solved, like the heterogeneous space of data producers (in this case, CRM software). It would probably mean that some elementary software could shape all data from data producers to data contract shape. Is it worthy or even possible? What do you think? Let’s discuss it in the comment section!
Showcase
Let’s say it is Monday, and you have a company-wide meeting coming up later today where you will discuss numbers on the sales dashboard:

Example of Sales Dashboard
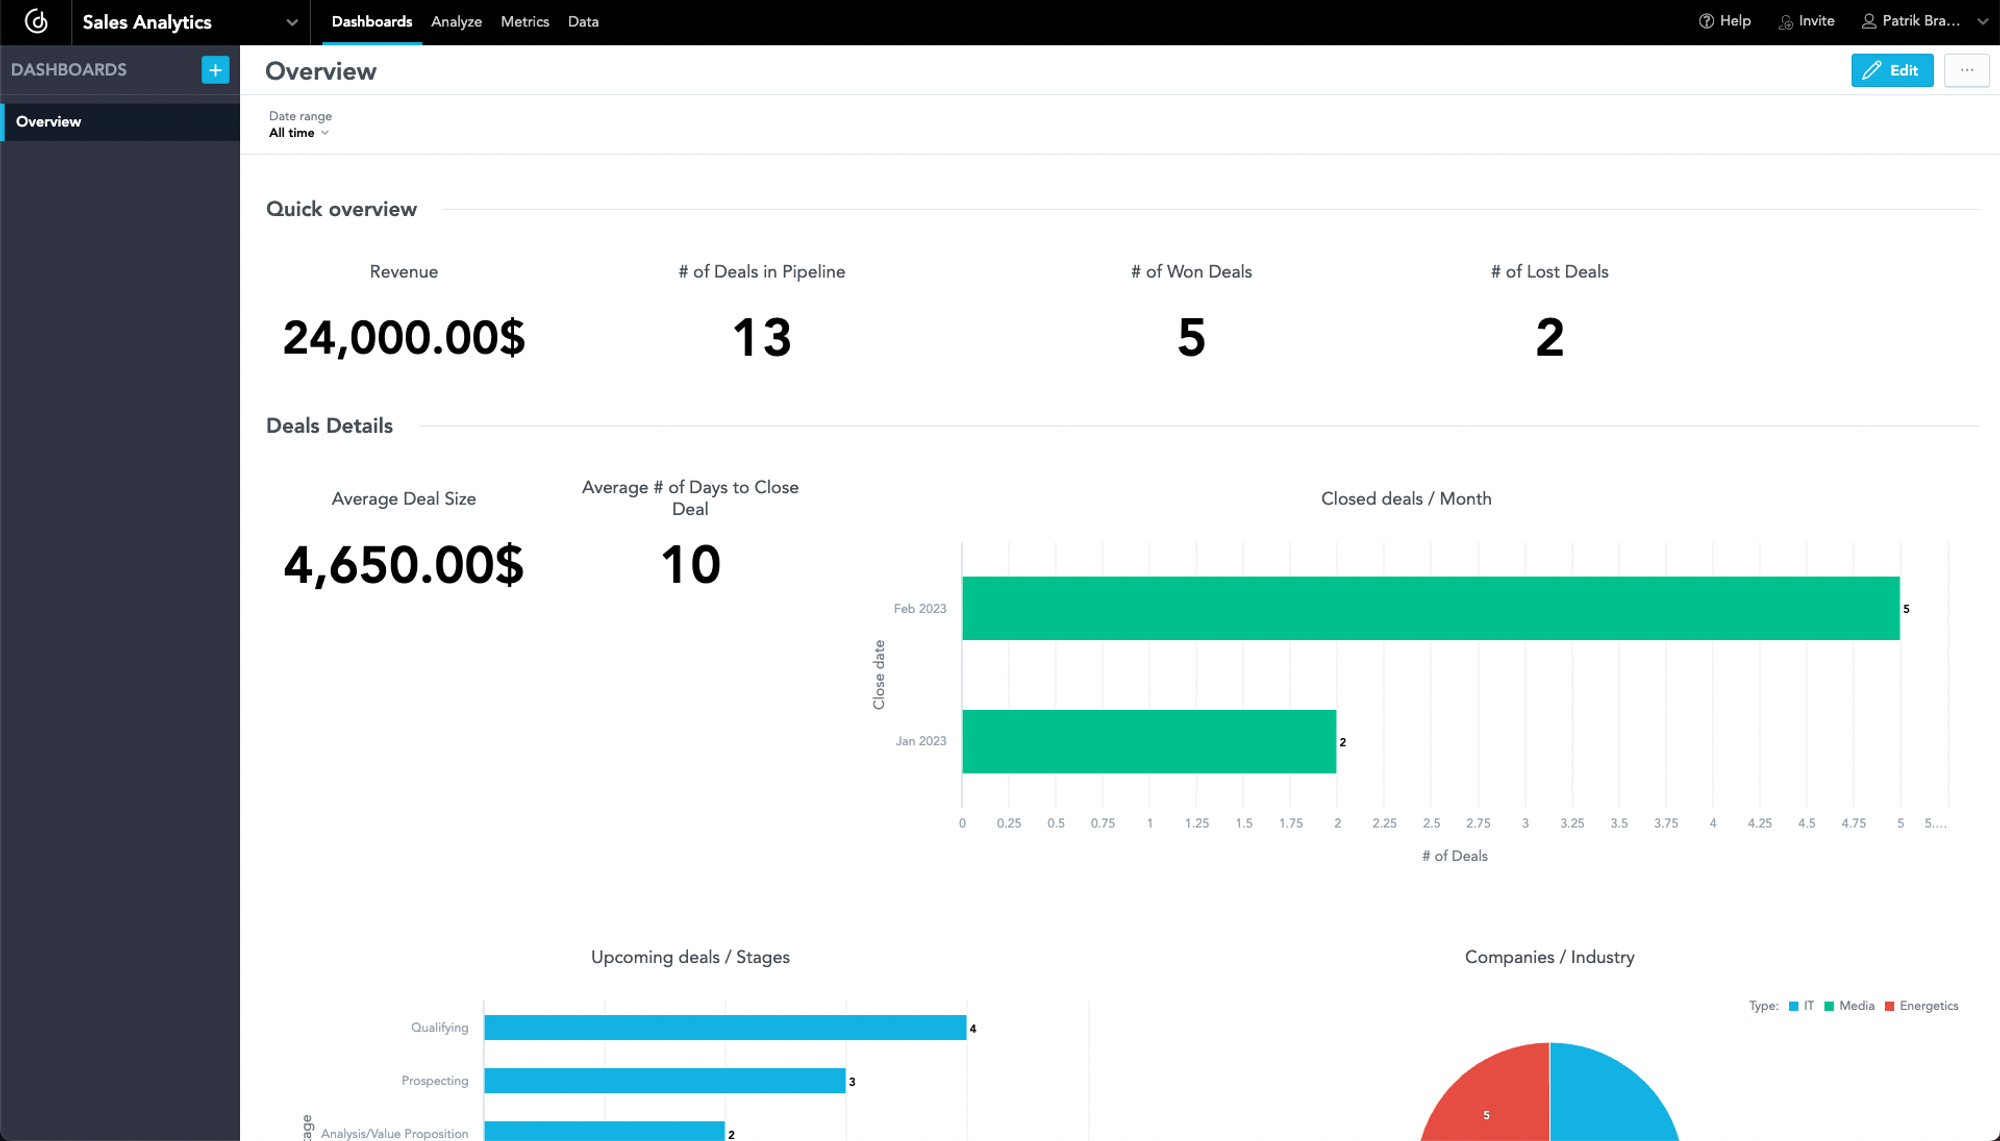
The numbers are not great. Only five deals have been won, and your company generated only $24,000 in revenue! This is too low. The sales team promised that they will do their best to improve it by next week's meeting. A few days passed, but you could not wait till the next Monday. You want to see the fresh numbers! It is totally fine because, as mentioned above, the data pipeline runs every night at 2 AM. If the pipeline is green, as the following image shows:

Run of GitHub Actions
The sales analytics will be up-to-date with freshly updated numbers from CRM:

Example of Sales Dashboard
Wow, the sales team almost tripled the revenue and successfully closed eight deals! Great news! Everybody will be happy with this beautiful sales dashboard now!
Try It Yourself
Do you want to try it on your own? You can register for GoodData Trial and follow the steps in the repository README.md.
Thank you for reading the article! I hope you find it useful. Let me know if you want to hear more about data contracts in the data pipeline or about any other topics!
Why not try our 30-day free trial?
Fully managed, API-first analytics platform. Get instant access — no installation or credit card required.
Get startedWritten by Patrik Braborec |

