GoodData and dbt Metrics


We need to talk about metrics! Why? Because they are one of the most crucial things in the data analytics world. Actually, without metrics data analytics would not be very useful at all. Metrics give everyone context, help companies grow, and address issues. We all need them to make better decisions. On the other hand, despite the huge benefits, it is not easy to work with them. You have to store the definition, and it can be SQL, calculation in a spreadsheet, or (for example) Python code. Metrics can be complex and their definition (for example, % Revenue from Top 10% Customers) is not an easy task. These are the two biggest issues — consistency and complexity. Here come tools and approaches like dbt metrics that claim:
by moving metric definitions out of the BI layer and into the modeling layer, data teams can feel confident that different business units are working from the same metric definitions, regardless of their tool of choice.
The question is: Is this really the right approach?
Metrics in dbt
The reason for introducing metrics in dbt is obvious — consistency. Every company needs to have consistent numbers about things like revenue, churn, customers, etc. The dbt approach is to move metrics definition from BI tools to the so-called modeling layer.

What does it mean? You have heard the term ELT before — extract, load, transform. Thanks to cloud data warehouses ELT started to become more and more popular than the former ETL — extract, transform, load. What is the difference?
Well, before the rise of cloud data warehouses, it was not easy to store all your data in a database. Before you could store your data (i.e. loading your data into the database) you needed to do some transformation in a separate process and only after the data was transformed, you could then load it into a database. Nowadays, the ELT approach allows us to run data transformation within a data warehouse, which opens up the possibility of tools like dbt and that introduces the so-called modeling layer. You model your data to the shape your clients (BI tools, Notebooks, etc.) need. Moving metric definition from clients to the modeling layer makes perfect sense, right? Well, yes, but not really…
Metrics in the modeling layer make perfect sense for simple use cases, like aggregating the total number of customers. On the other hand, if you want to calculate more complex metrics and look at them from different points of view, you need to be able to see metrics in different contexts. From the dbt documentation:
A metric is a timeseries aggregation over a table that supports zero or more dimensions.
You need a more sophisticated tool that allows you to work with multiple tables and that allows you to create a metric over a table where you do not have a date attribute.
Experience GoodData in Action
Discover how our platform brings data, analytics, and AI together — through interactive product walkthroughs.
Explore product toursMetrics on Steroids — GoodData Metrics (MAQL)
Let me ask you a few questions — have stakeholders ever wanted to know company revenue? Have stakeholders ever wanted to know company revenue in region A? Have stakeholders ever wanted to know company revenue in region A from product B? What do these questions have in common? Asking the same question in a different context. The final output of a metric is a number, but the number changes depending on the context in which it is used. GoodData, thanks to its proprietary language MAQL (Multidimensional Analytical Query Language), brings a way to define metrics that are context-aware. GoodData lets you define one metric that can be reused in multiple contexts (viewed by regions, products, etc.). In other words, GoodData allows you to define metrics that are complex and solves complexity.
Headless BI — The Only Source of Truth
The call for a single source of truth is obvious. It is the reason why dbt came up with the metric layer. The same reason applies to headless BI as the only source of truth and that means a perfect match between dbt and GoodData! You can define simple metrics in dbt (during transformation/modeling) and derive them in headless BI (GoodData). Furthermore, you can define more complex and context-aware metrics in headless BI.

You will achieve consistency and solve complexity. On top of that you can consume everything through API and SDKs in BI tools, Web applications, Notebooks, etc. Last but not least, headless BI will provide you caching and authorization. Sounds good, right?
Demonstration — GoodData vs dbt
As a demonstration let’s show how the metric % Revenue from Top 10% Customers will look in GoodData versus how it will look in dbt.
Metrics in dbt
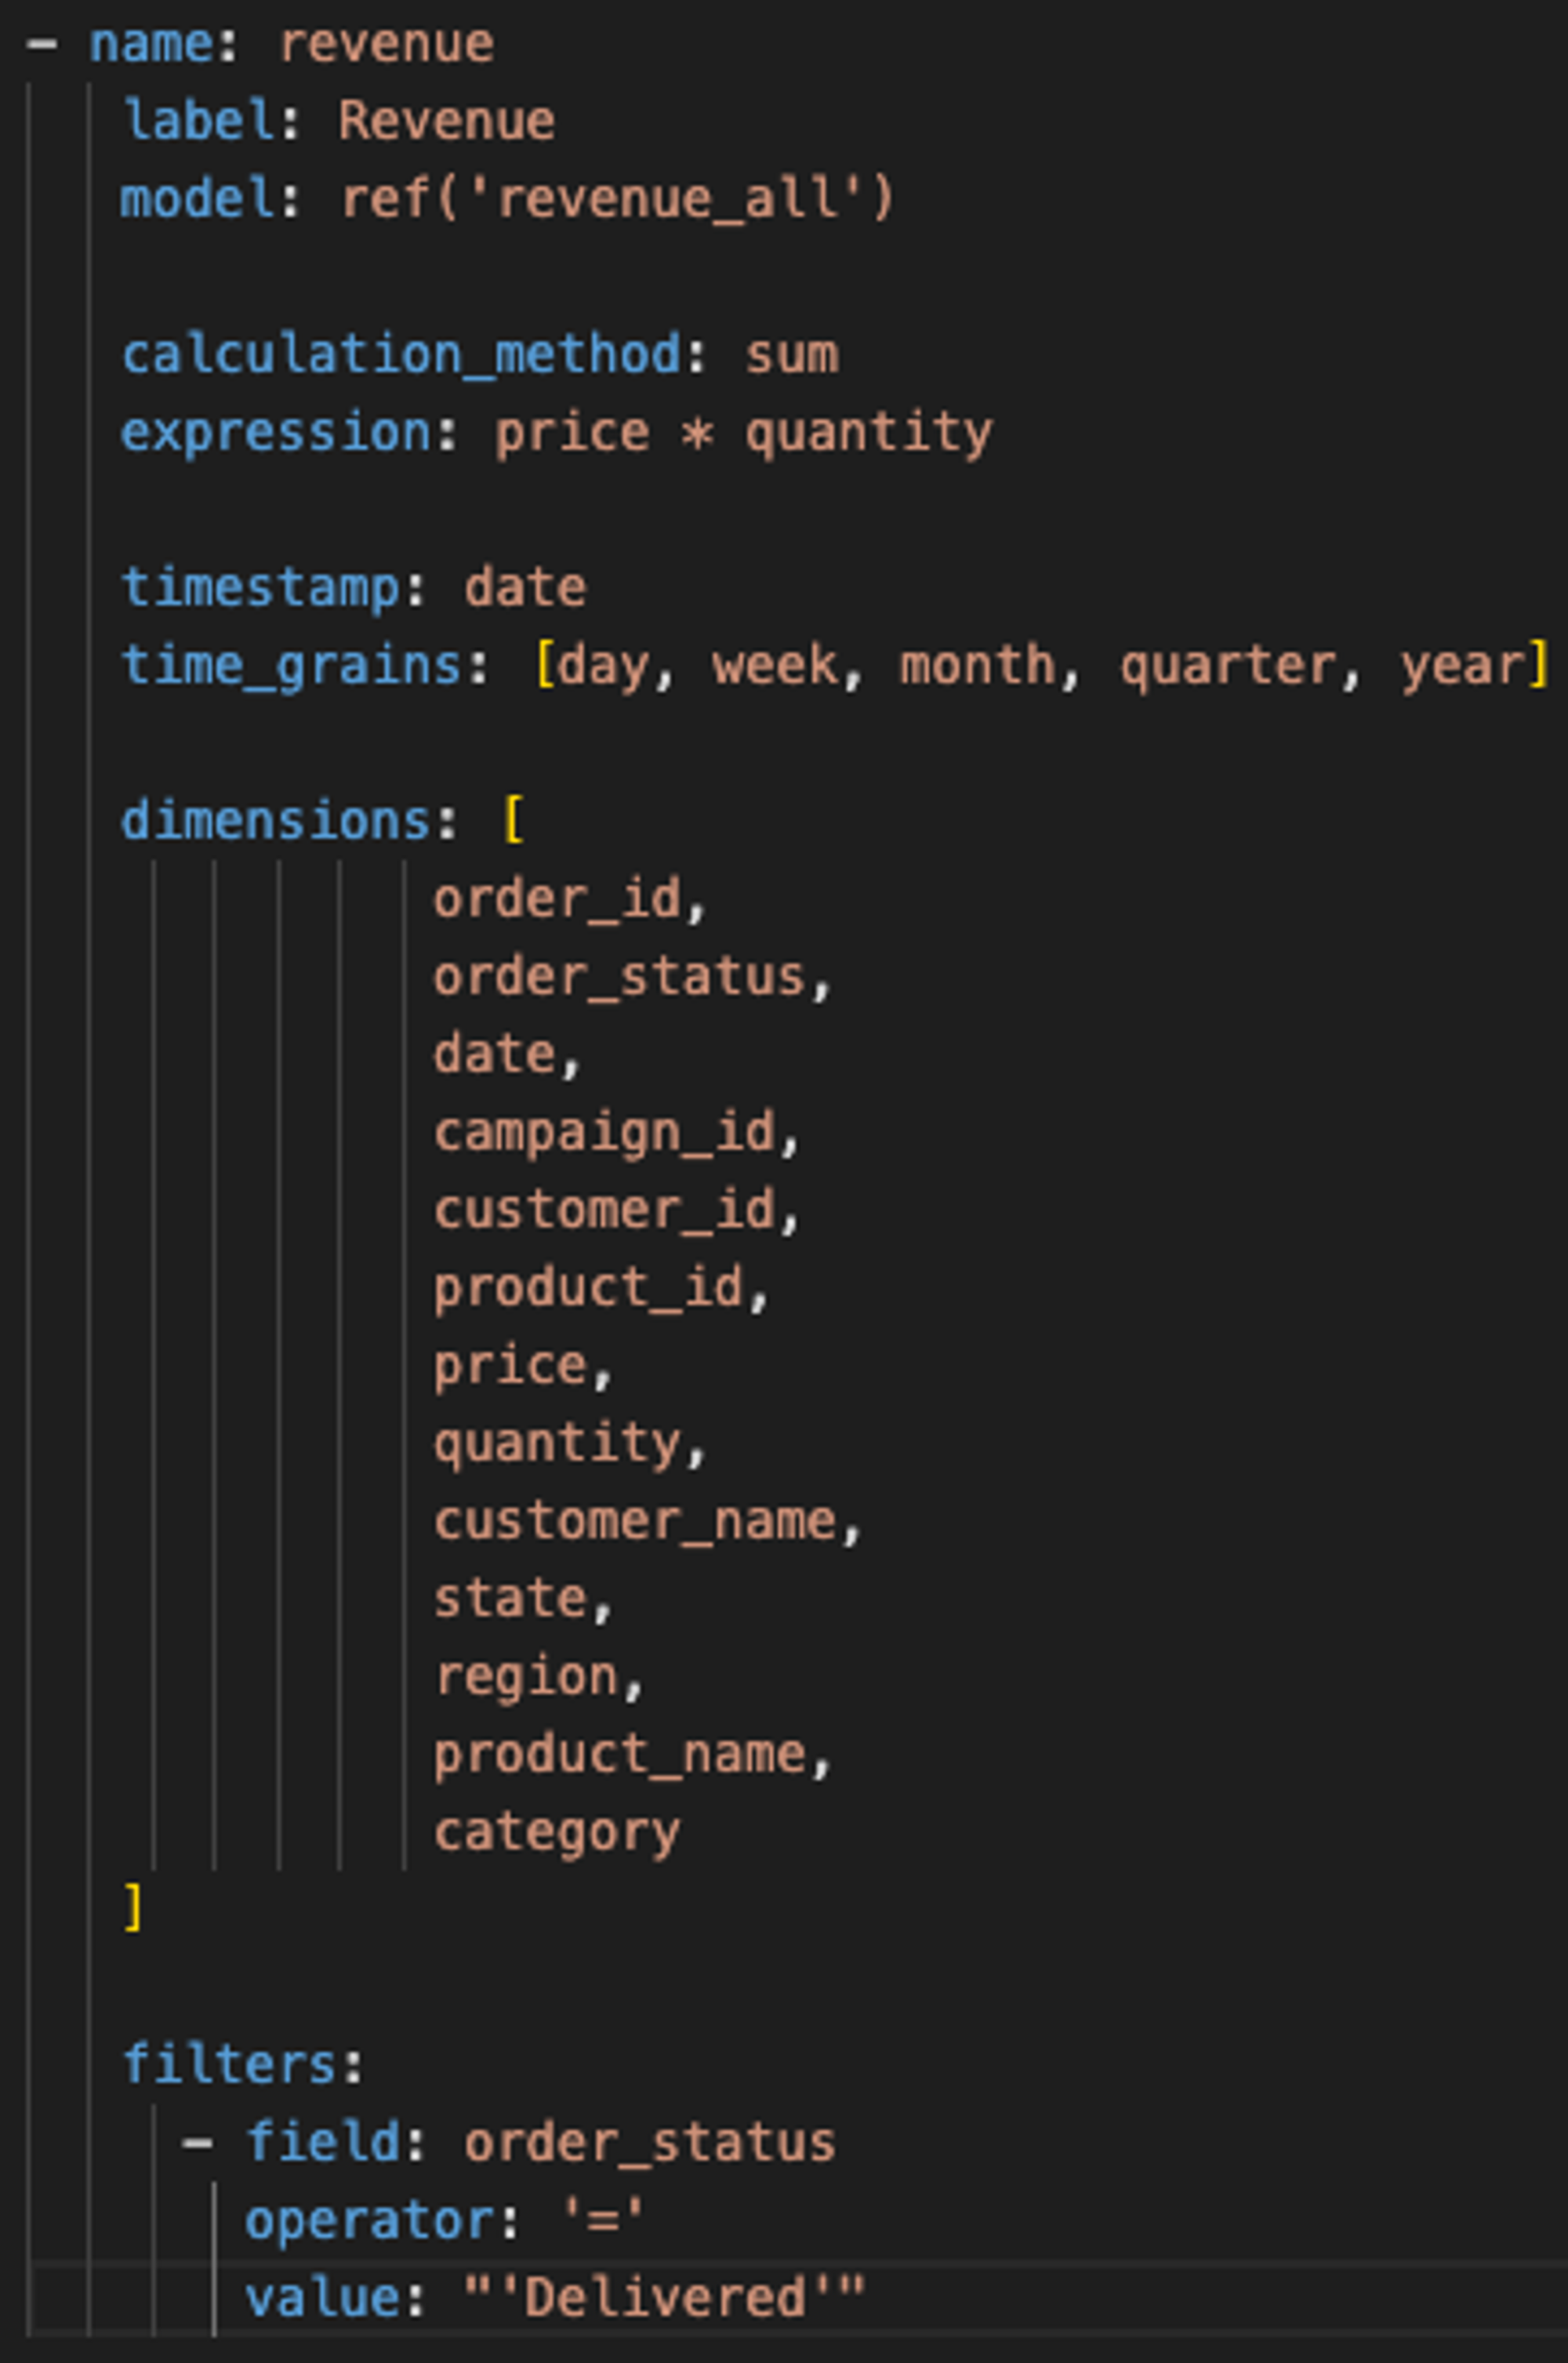
Let’s start with a simple definition of revenue:

It can be defined in a schema.yml file in a declarative way. It is quite simple, you just have to define time grains and dimensions, setting the maximal scope of reusability.
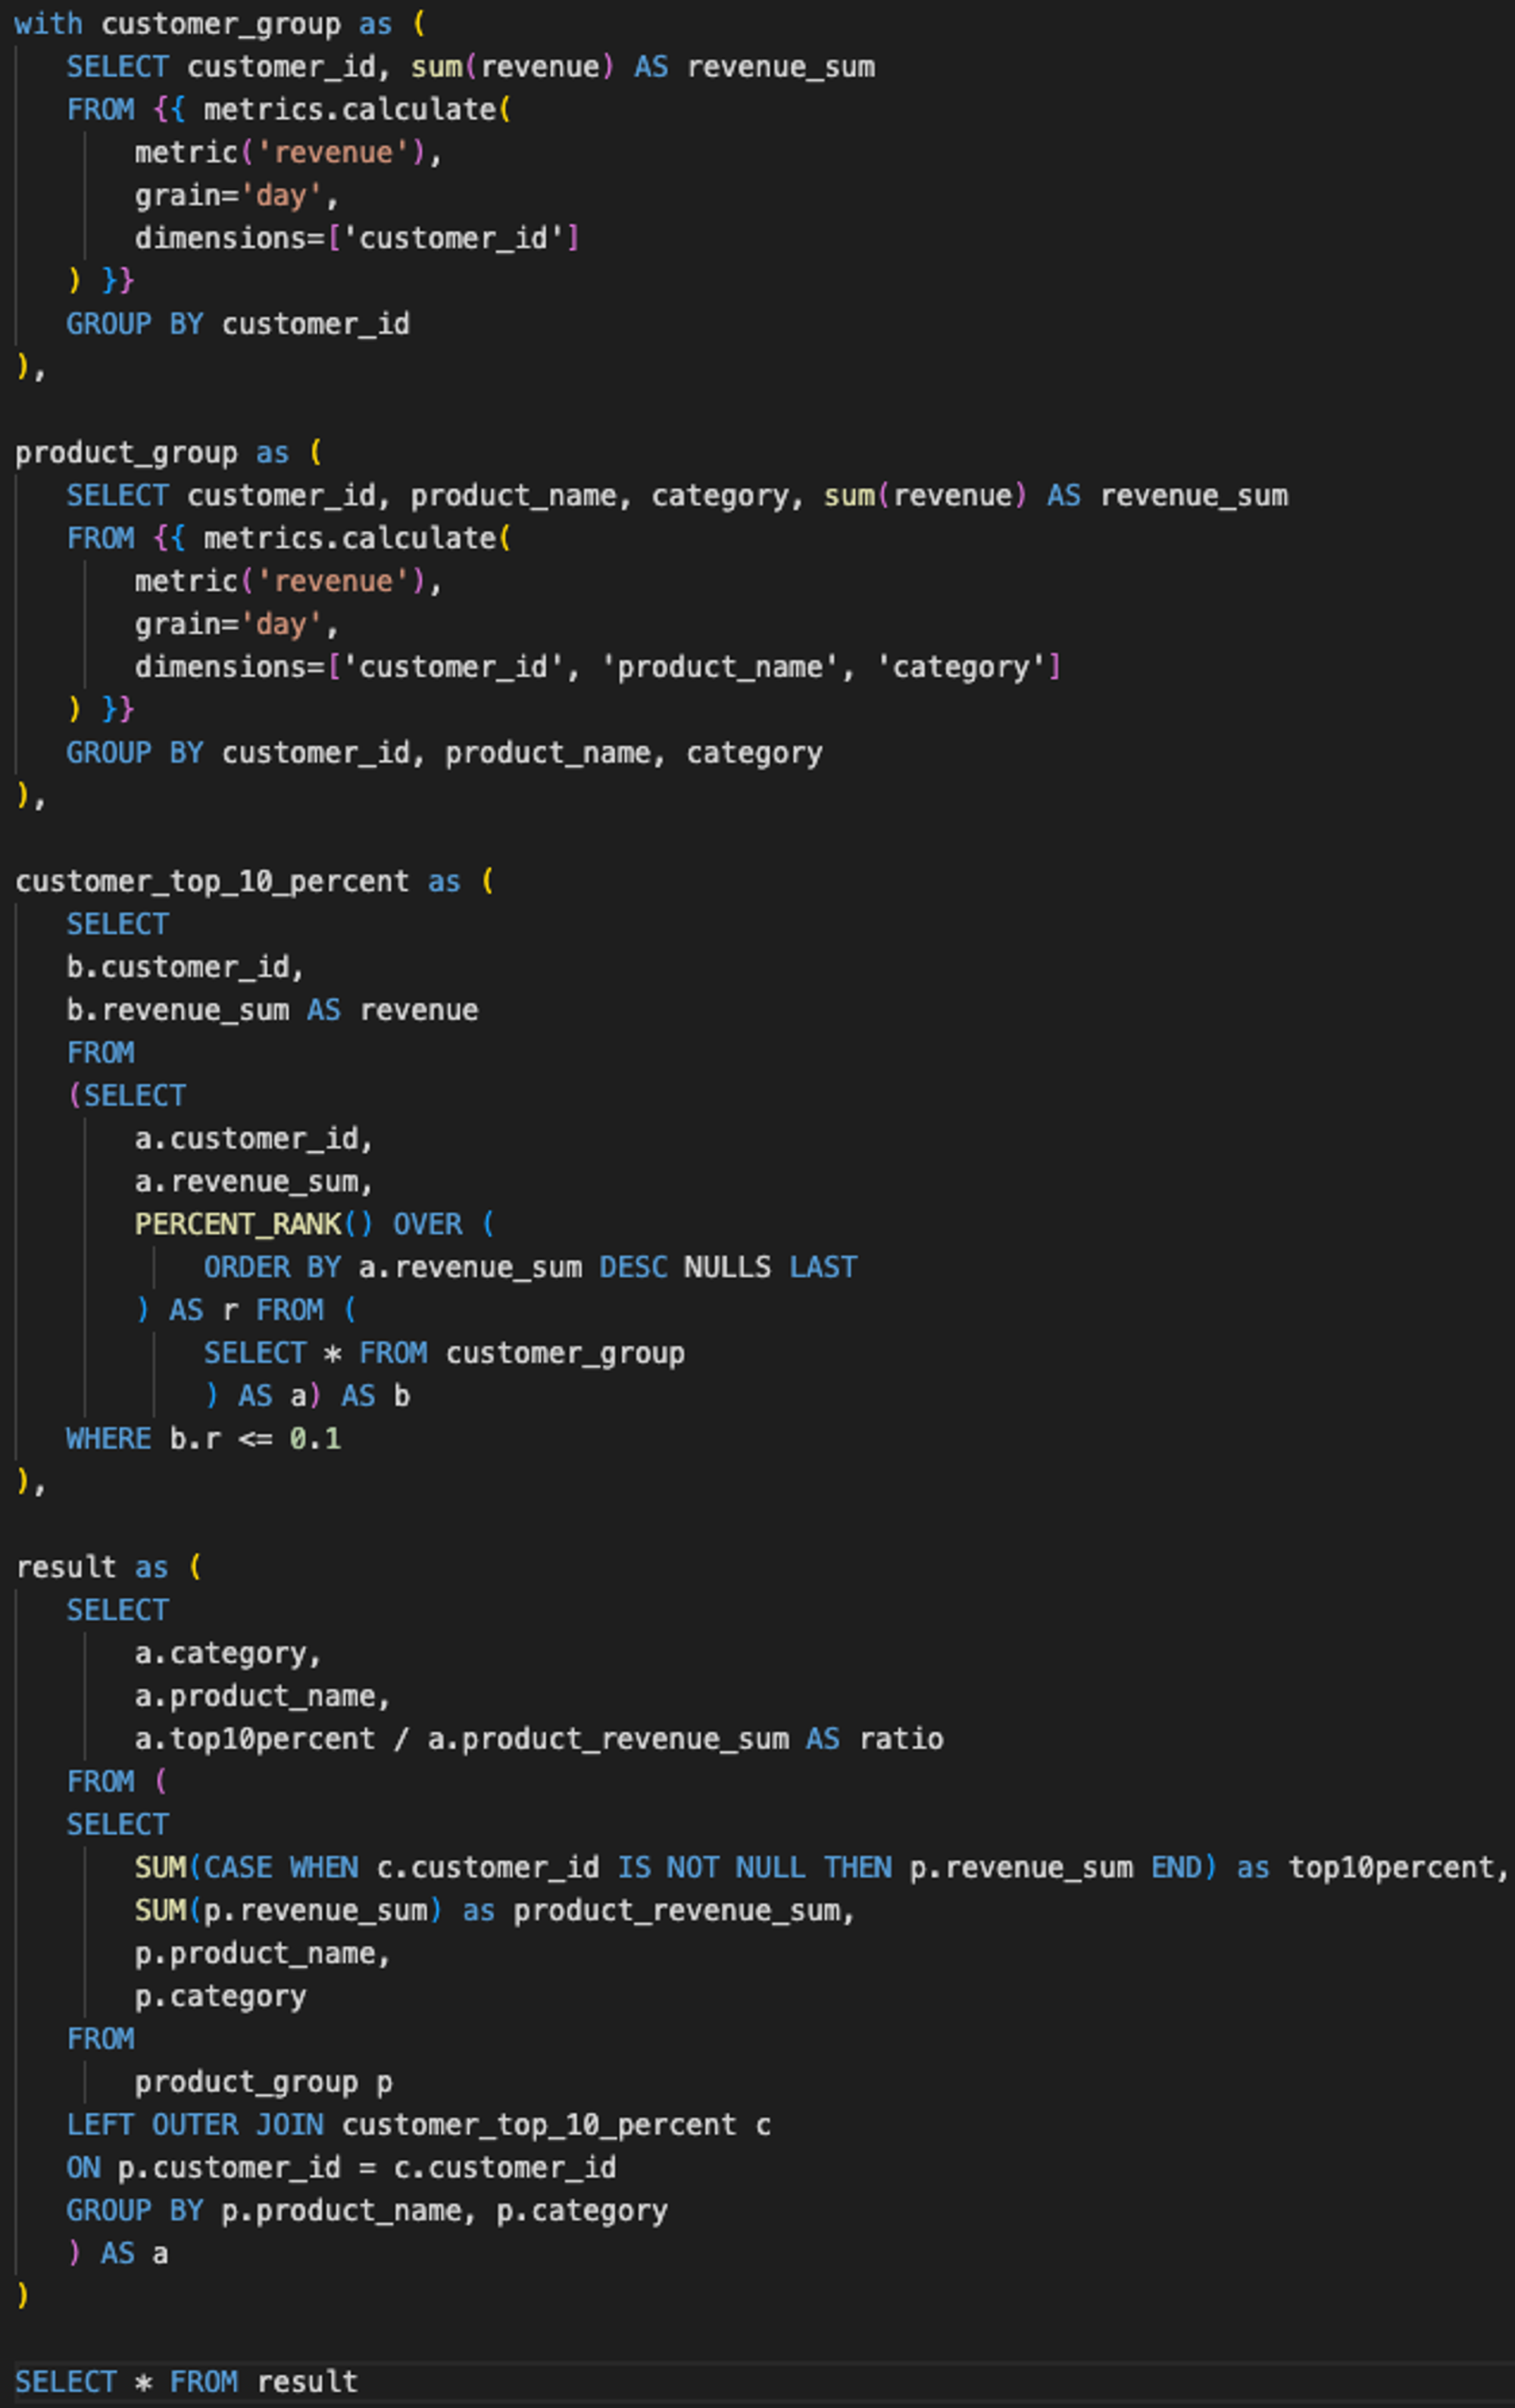
Let’s try a more complex example and calculate the aforementioned % Revenue from Top 10% Customers:

For more complex metrics in dbt you have to write a large and complicated SQL statement. You can use metrics.calculate() function to utilize the simple metrics defined in the schema.yml file.
Metrics in GoodData (MAQL)
Let’s start with a simple definition of revenue:

To calculate the metric % Revenue from Top 10%, let’s create one support metric Revenue Top 10:

The final definition of % Revenue from Top 10%:

You can compare both examples. As discussed, dbt metrics are completely fine for simple use cases but for more complex use cases the prudent choice is to use a more sophisticated tool like GoodData. Additionally, all GoodData metrics are defined without context — this means that if you want to use a metric with different attributes (for example, sliced by region) you can do so easily. If you would like to slice a dbt metric with different attributes, you would need to write another long SQL file. In my honest opinion, GoodData is just better for advanced use cases and can save you a lot of time.
Final Words
For those who want to really dive deep, we have created a demo with dbt and GoodData. Also, for a smooth experience, I invite you to try the GoodData trial where you can try to define all metrics either on demo data or on your own data.
Thank you for sticking with me through this article and do not forget to follow us for more demos and articles! See you!
Experience GoodData in Action
Discover how our platform brings data, analytics, and AI together — through interactive product walkthroughs.
Explore product tours

