Frontend Integration Series: Next.js


Frontend Integration Series: Next.js
Integrating GoodData into Next.js is easier than it seems, even without native support. Let’s dive in and go over the four-step process:
- Installing Dependencies
- Setting up Environment Variables
- Setting up the Code Base
- Managing CORS
Note: For those interested in a deeper dive into these integrations, I recommend checking out Patrik Braborec’s quick overview.
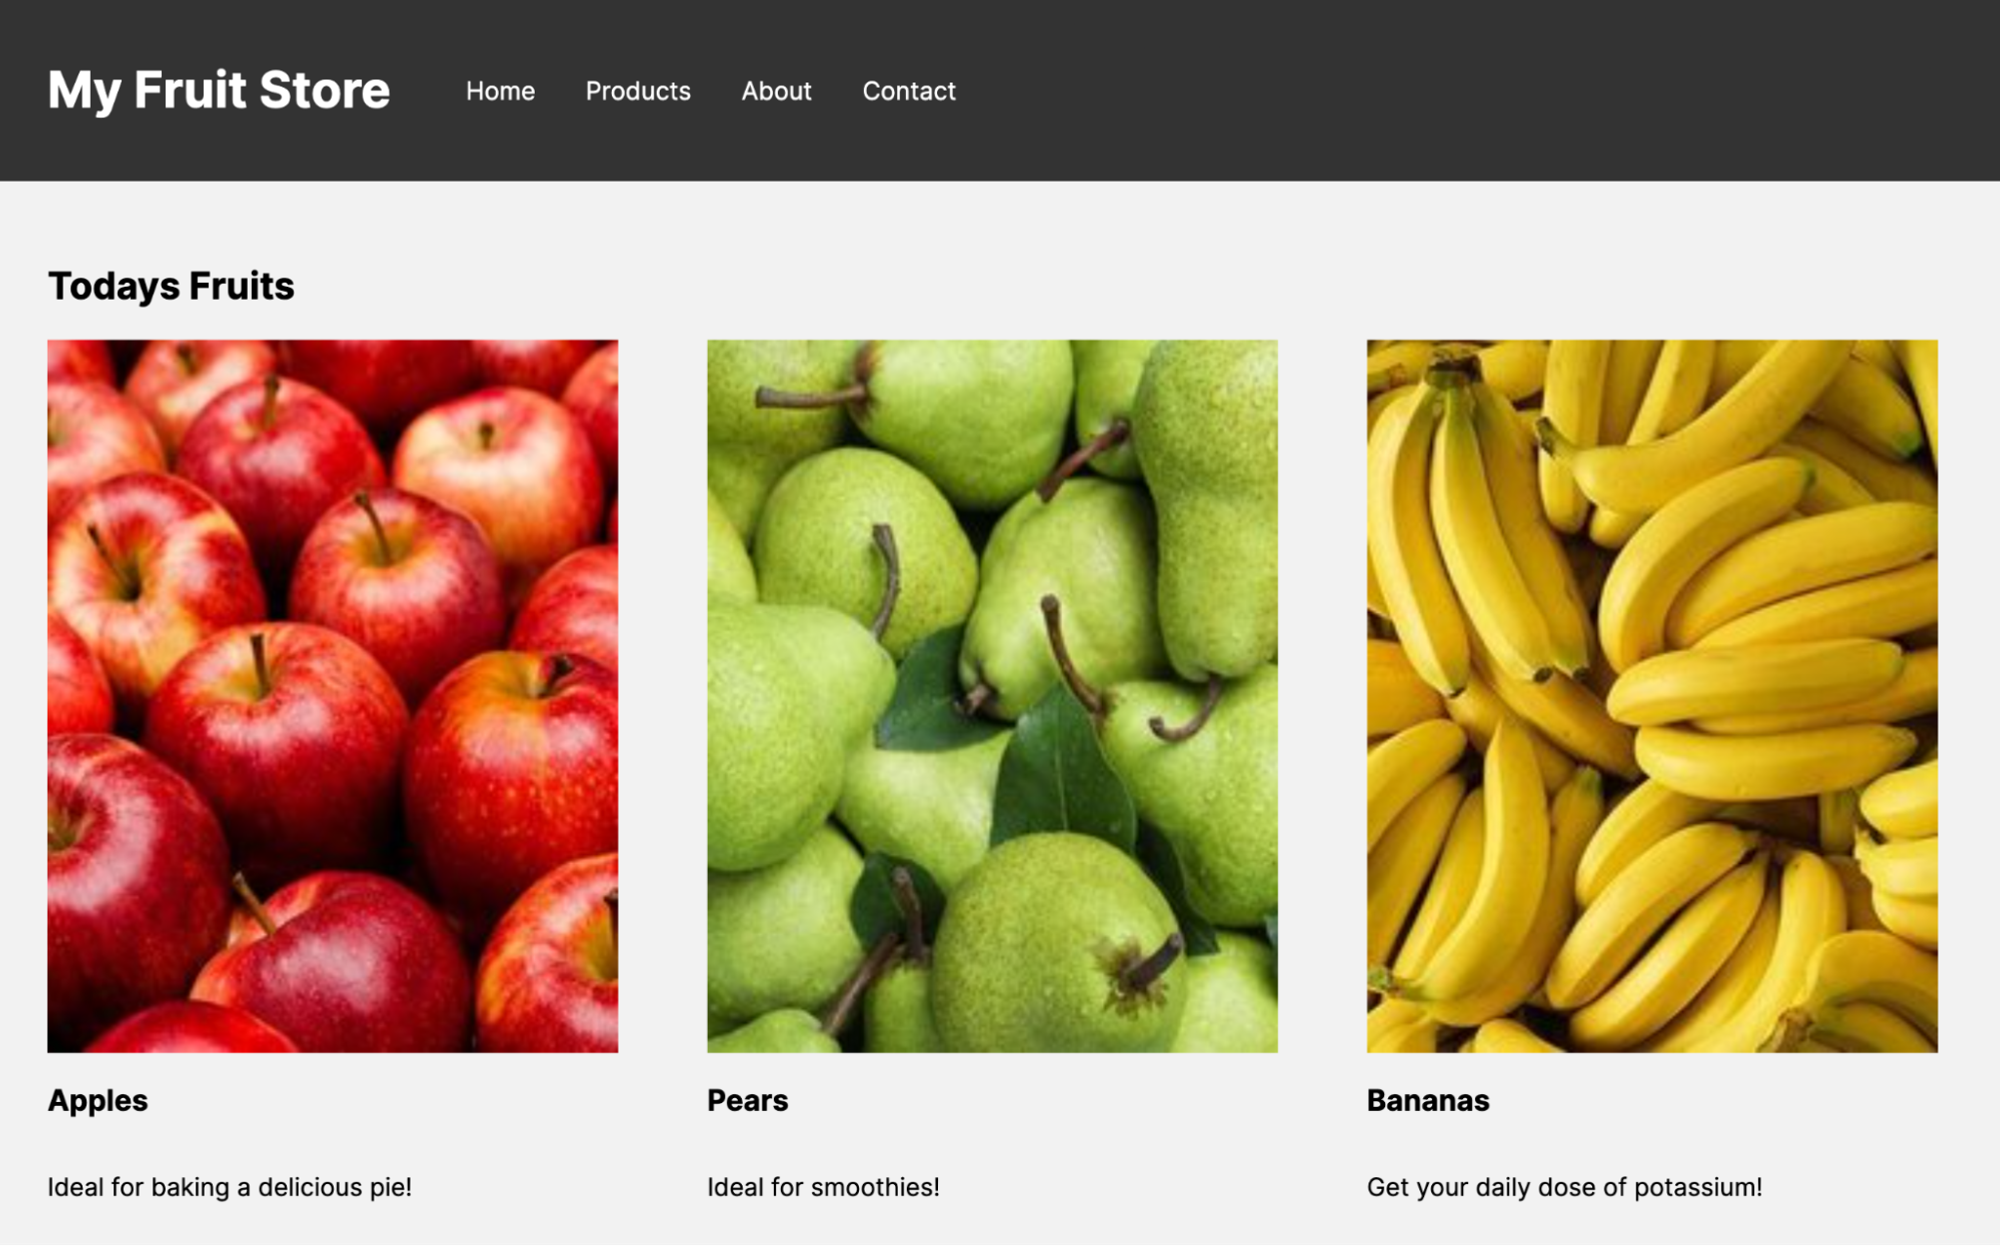
At the end of this tutorial, you will be able to integrate GoodData Visualizations into your Next.js application. For the purposes of this demo, let’s assume that you have a fruit store like this:

This is part of an ongoing series about different front-end frameworks and their integration into GoodData, last one was about SvelteKit.
Step 1: Install Dependencies
First things first, you would need to add a few things to your dependencies.
npm install --save react@^18.2.0 react-dom@^18.2.0 @gooddata/sdk-ui-all @gooddata/sdk-backend-tiger
Details about the GoodData.UI SDK is not in the scope of this article, but if you would like to learn more about it, here is the GoodData.UI architecture overview.
And just for completeness here are TypeScript dependencies:
npm install --save-dev @types/react@^18.2.0 @types/react-dom@^18.2.0
Now that is out of the way, let's look at the code!
Step 2: Set environment variables
Make sure you have your .env and .env.local files with correct values. After you clone the repository, you will see a .env.local.template file in the /clients/nextjs folder. You need to remove “template” from the filename in order to set up everything correctly.
For .env, you will need to define three variables:
# GoodData host
NEXT_PUBLIC_GD_HOSTNAME=""

# GoodData workspace id
NEXT_PUBLIC_GD_WORKSPACE_ID=""

# GoodData insight id
NEXT_PUBLIC_GD_INSIGHT_ID=""
If you open a GoodData dashboard, you can find the HOSTNAME and WORKSPACE_ID in the URL:
https://<HOSTNAME>/dashboards/#/workspace/<WORKSPACE_ID>/dashboard/<DASHBOARD_ID>
For INSIGHT_ID you will have to navigate to the Analyze tab and then navigate to one of the visualizations. There you would find INSIGHT_ID like this:
https://<HOSTNAME>/dashboards/#/workspace/<WORKSPACE_ID>/<INSIGHT_ID>/edit
For .env.local, you will need only one variable:
# GoodData API token
NEXT_PUBLIC_GD_API_TOKEN=""
Check Create an API token documentation for more information.
In case you would like to use this in your production, we highly recommend to use OAuth, as you could potentially leak your API_TOKEN.
Step 3: Set up the Code
To quickly embed GoodData Visualizations, you would need to create a backend in the form of tigerFactory() in your chart component:
const backend = tigerFactory()
  .onHostname( process.env.NEXT_PUBLIC_GD_HOSTNAME )
  .withAuthentication(
    new TigerTokenAuthProvider( process.env.NEXT_PUBLIC_GD_API_TOKEN )
);
Then just simply export it with the GoodDataChart component:
export default function GoodDataChart() {
  return (
    <BackendProvider backend={backend}>
        <div className="gooddata-chart">
          <WorkspaceProvider workspace= { process.env.NEXT_PUBLIC_GD_WORKSPACE_ID } >
                <InsightView insight= { process.env.NEXT_PUBLIC_GD_INSIGHT_ID } />
          </WorkspaceProvider>
        </div>
    </BackendProvider>
  );
}
Now you can simply have create
Here is a very simple template:
<h1>Next.js  with GoodData</h1>
<GoodDataChart/>
Now you can just add styling and you are set! Just for simplicity, let's just go with a minimal one:
#gooddata-chart {
 width: 100%;
 height: 400px;
}
Here is a GitHub repo you can easily start with!
Step 4: Manage CORS
And that is all for code! Quite simple, isn't it? ;)
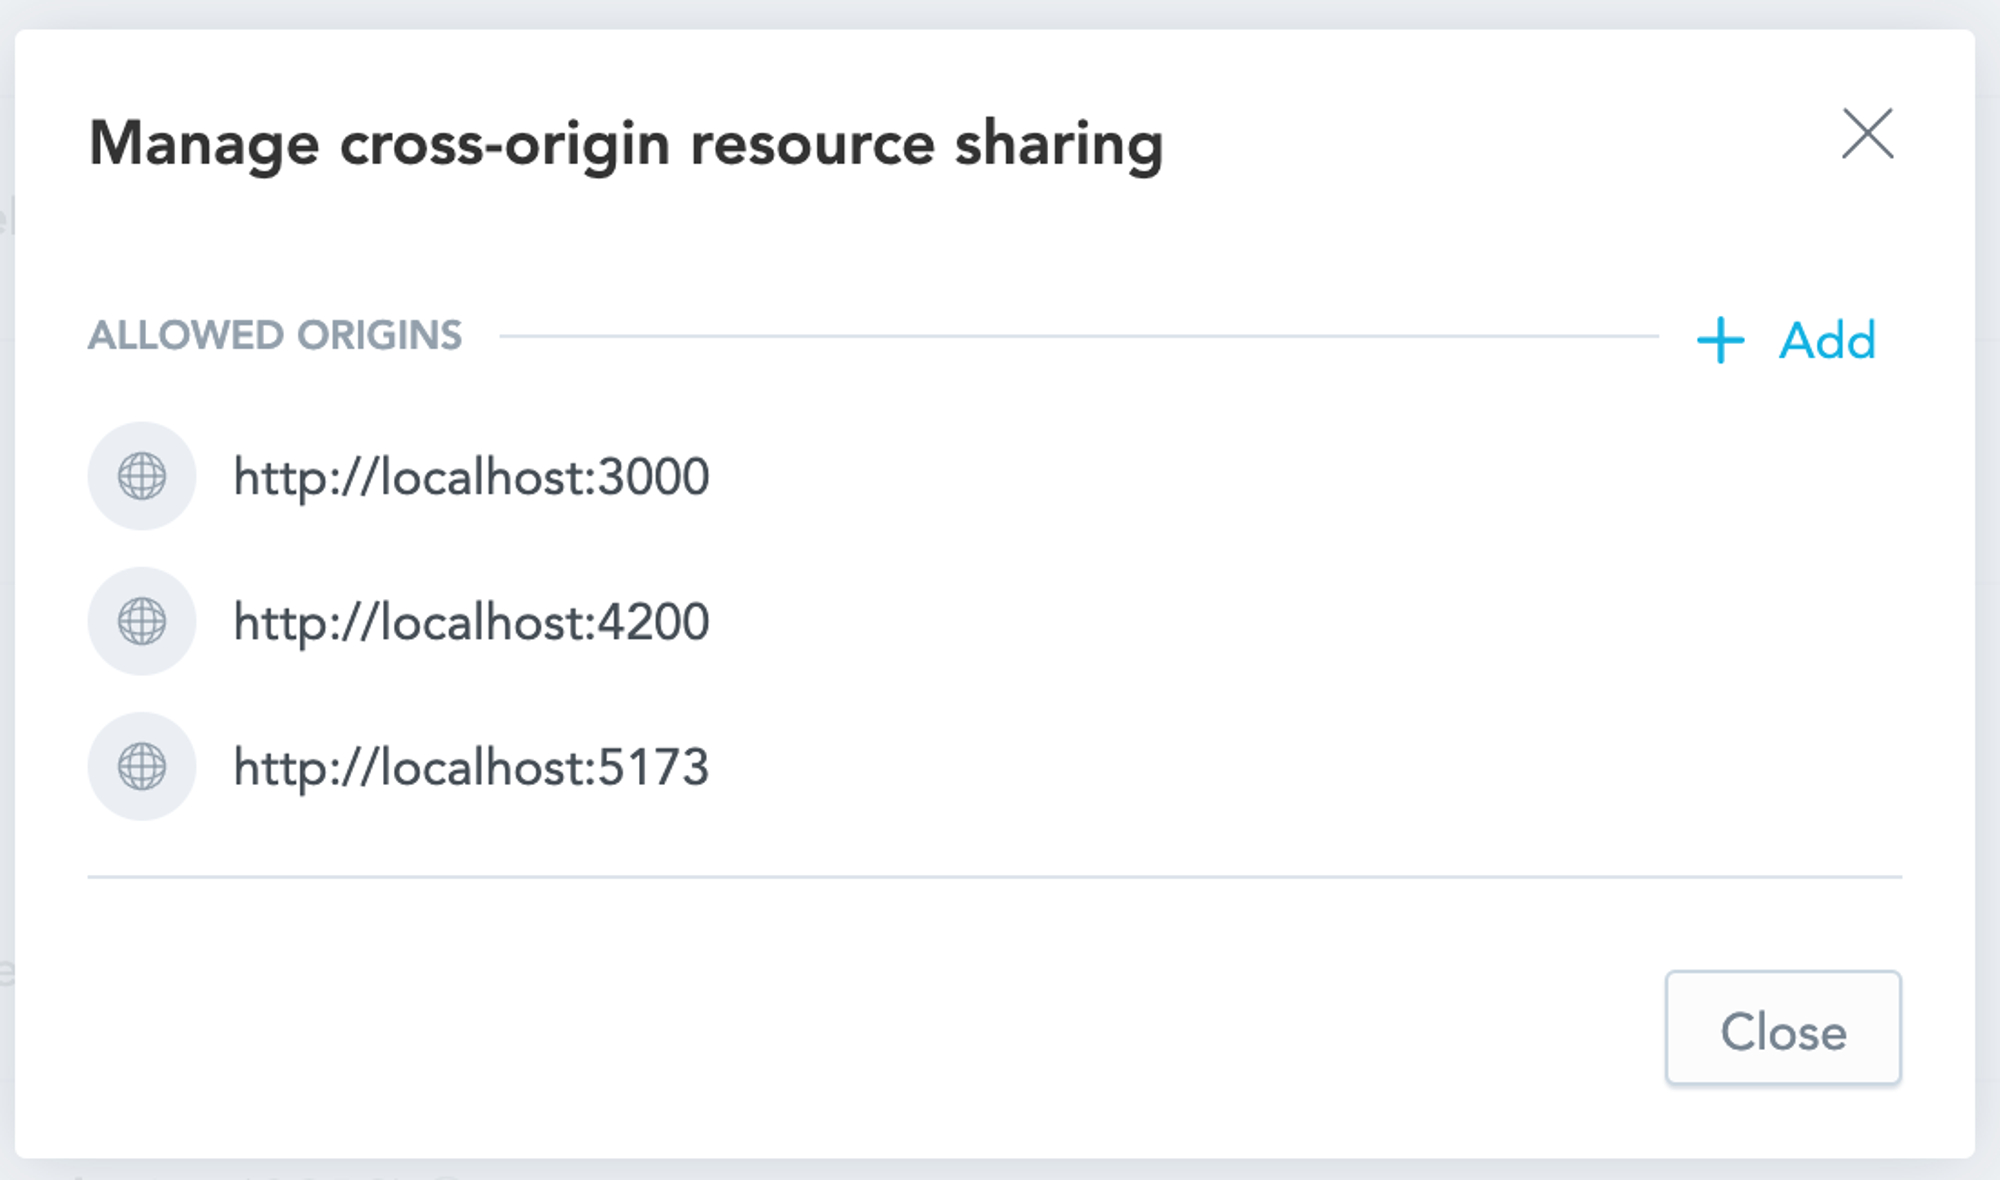
Now the only thing that would be missing is to take care of CORS. This is quite simple in GoodData:
- Navigate to your GoodData Instance,
- Go to the settings
- Add allowed origins to the CORS.

Note: For detailed information about CORS, refer to the official documentation.
For my local development, this was http://localhost:3000:

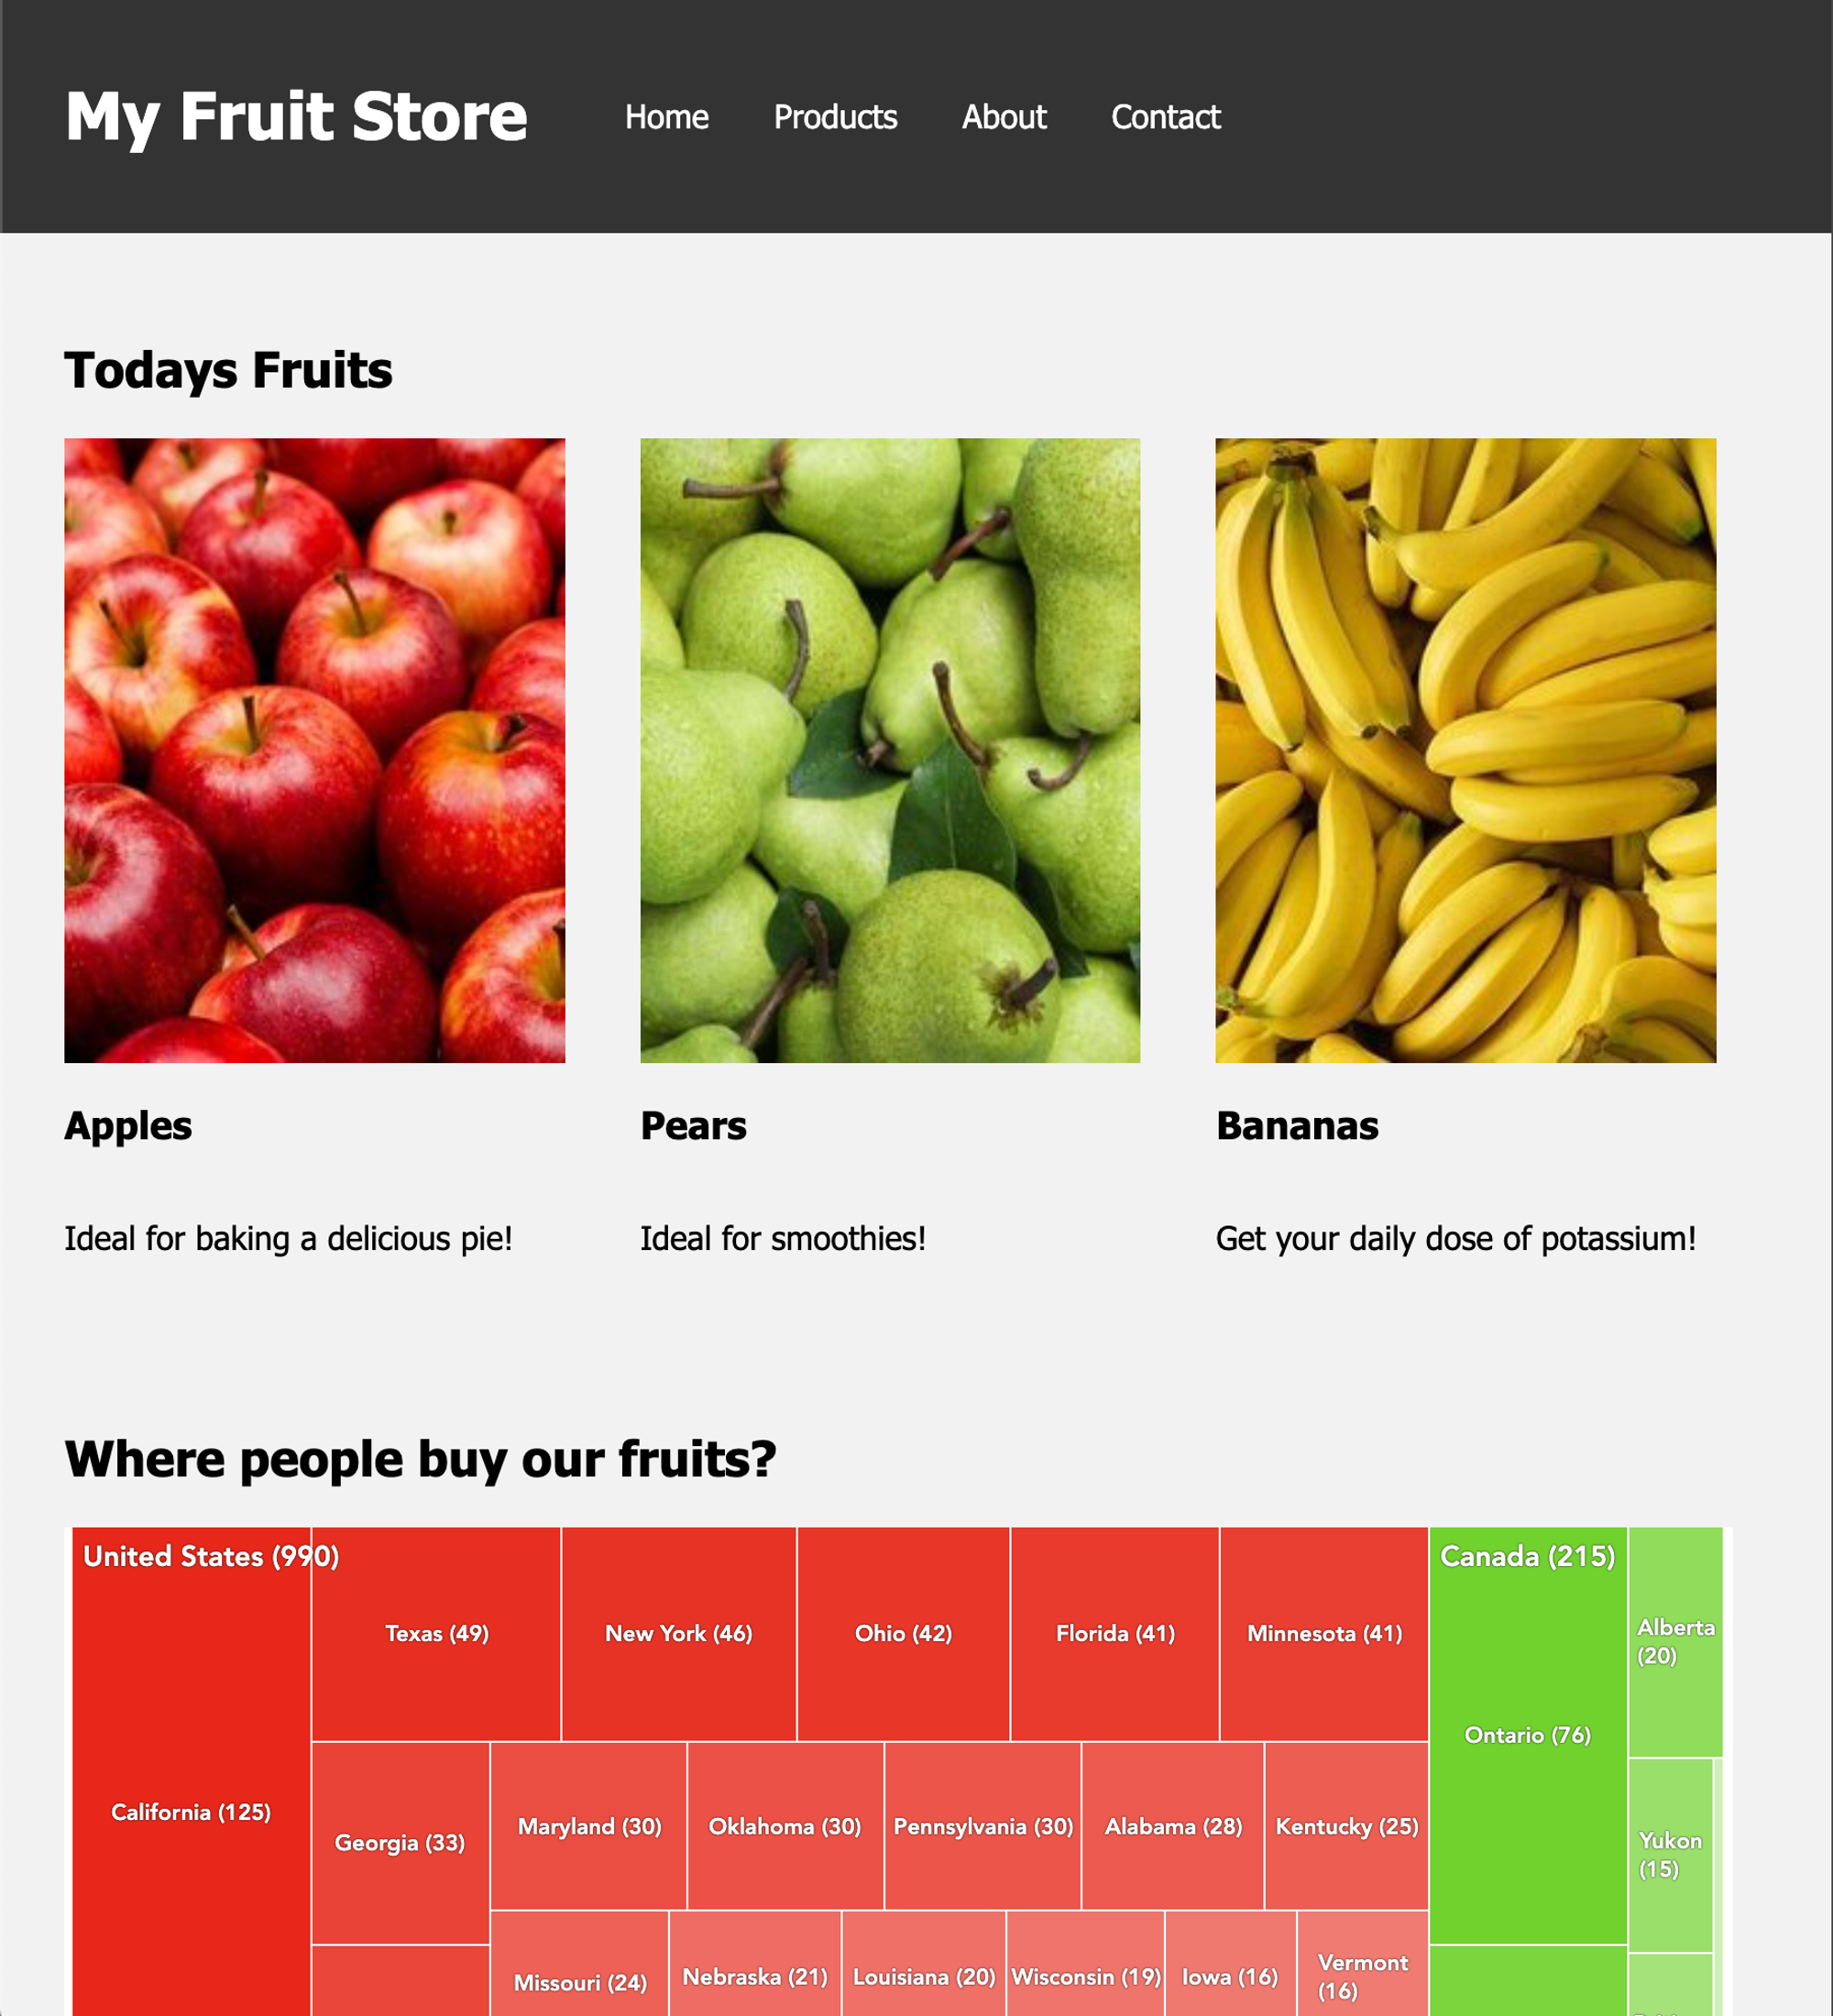
Now just simply run ng serve and you should see something like this:

In case the colors of the visualization don’t fit you, you can always change them.
Want to Learn more?
If you want to try GoodData, check out our free trial - it works well with the GitHub repo! If you would like to discuss embedding, AI, dashboard plugins or whatever you have on your mind, reach out to us on our community Slack.


