Can We Apply the DRY Principle to Business Intelligence?
Written by Anna Geller |

Table of Contents
“Don’t Repeat Yourself” is beneficial — not only in software engineering
Have you ever encountered the same queries being applied over and over again in various dashboards? Or the same KPIs being calculated in nearly every single report? If your answer is yes, you are not alone. It’s common among business users to simply copy-paste the same queries, data definitions, and KPI calculations. But there is a better way.
The dangers of knowledge duplication
Most software engineers are taught from day one the “DRY” principle: Don’t Repeat Yourself. This principle states that:
“Every piece of knowledge must have a single, unambiguous, authoritative representation within a system.”
Even though most data and software engineers know how to write DRY code, many data analysts and business users are unaware of the dangers of copy-pasting their queries and data definitions. As a result, we often end up in Business Intelligence reports which have different representations of KPIs and business logic. To make the argument more concrete, here are some of the consequences of code duplication in analytical workloads:
- If something in your code needs to change, you need to make those changes in X different places.
- You risk conflicting definitions if one “copy” gets modified while another one does not.
- In the end, nobody knows what is the single source of truth because any time you use the same KPI, it’s calculated or defined differently.
- If you add documentation to a duplicated code, query, code, or data definition in one place, this documentation is lacking in another place leading to further inconsistencies.
I remember when my team had a discussion about what is the best place for a data dictionary. One of the suggestions was to use Confluence (or a shared spreadsheet) for that purpose. What’s wrong with this suggestion? It violates the DRY principle as it would inherently cause duplication: one definition in the database and one in the external documentation. Manually created data dictionaries never stay up to date — don’t believe anyone who claims otherwise.
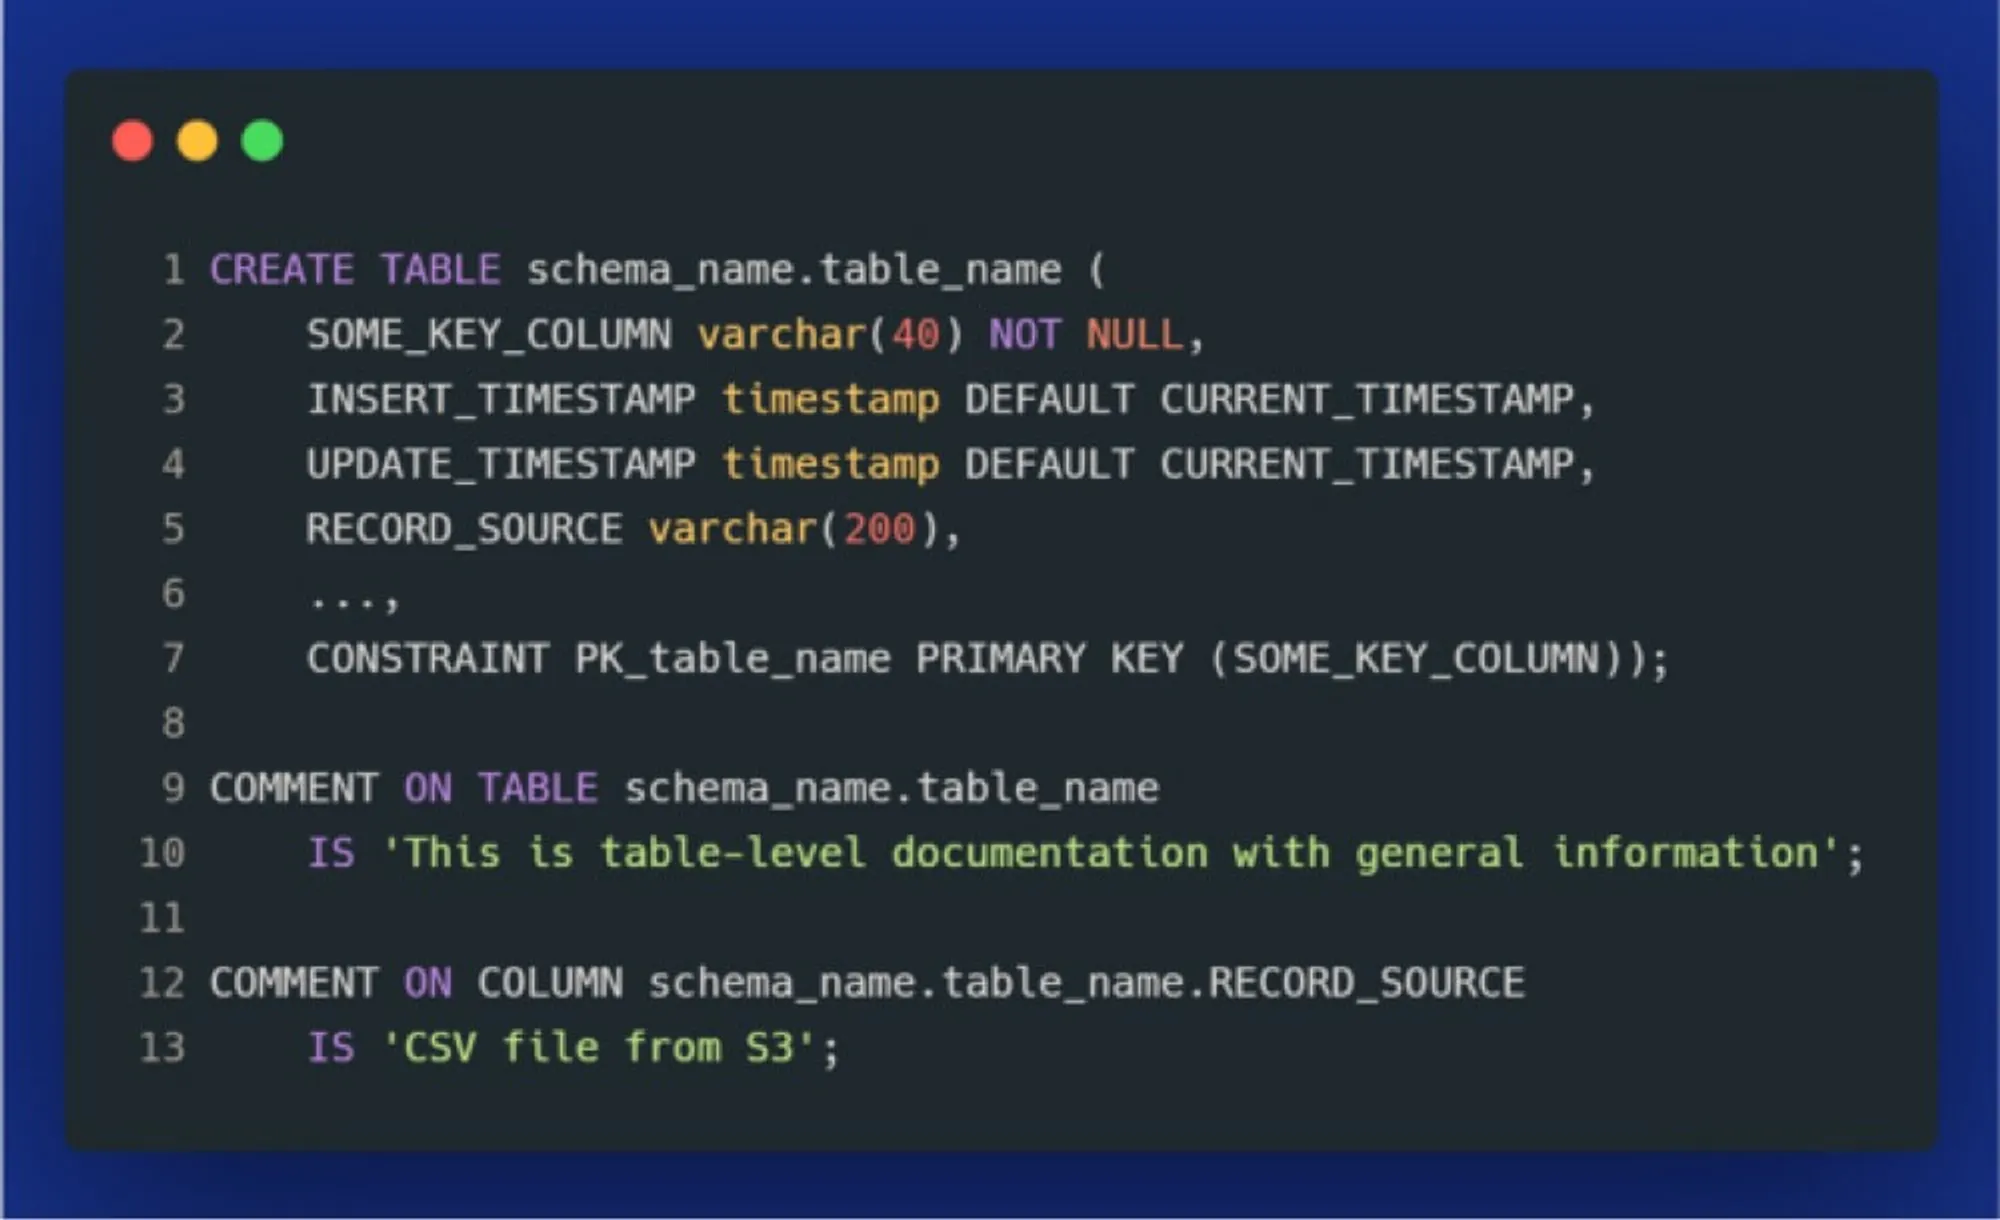
A potentially better solution is to apply all data definitions directly within a database (or data warehouse) by using code comments. Here is how it could look like:

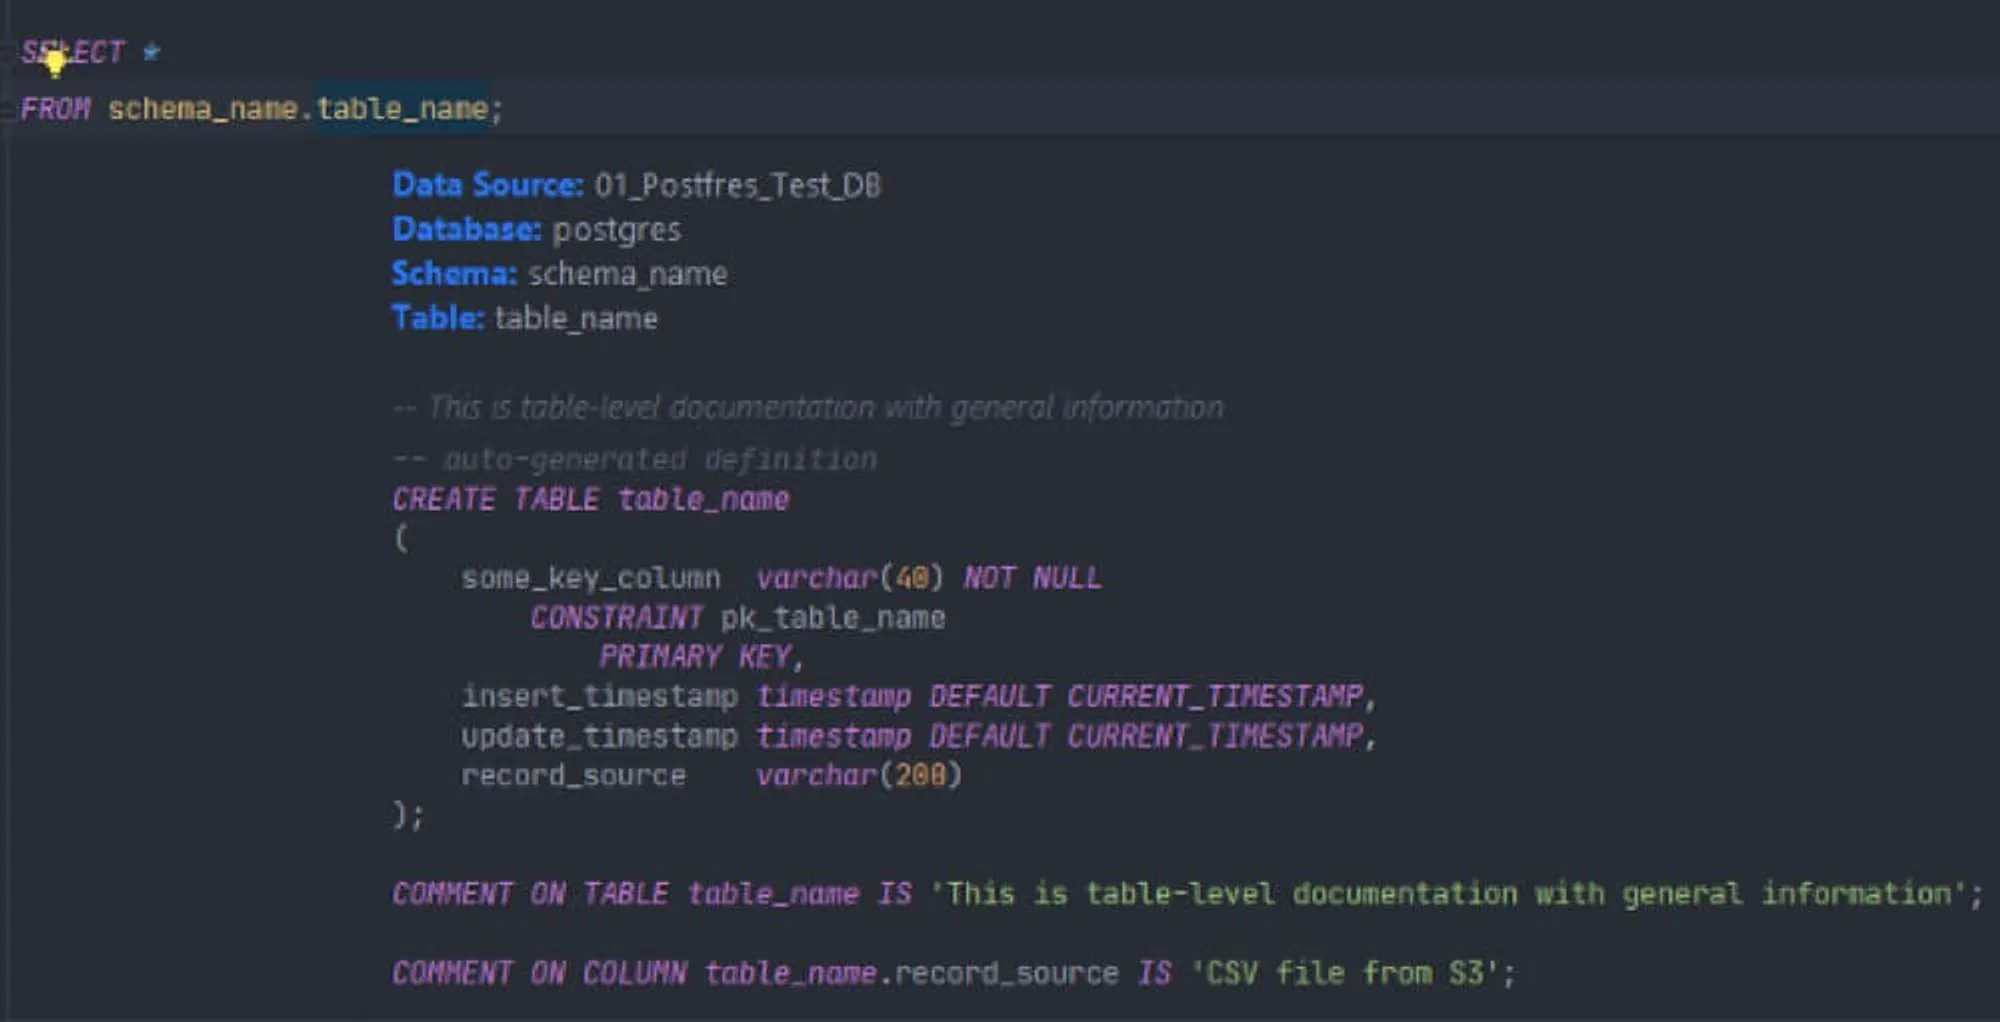
Many SQL clients, these days, make it easy to view data dictionaries implemented as code comments. For instance, when using Datagrip, we can simply use Ctrl + Q (or command + Q on Mac) to see a full table definition, including table and column comments.

Of course, you may have more than a single data warehouse. If you use a data lake, you most likely leverage some centralized metadata repository such as AWS Glue, which provides data dictionary capabilities. Regardless of your chosen implementation, it’s important to think about the right approach for your use case while following the DRY principle.
*Side note: If you are interested in how to leverage AWS Glue metadata for data discovery, I built a simple MVP of a data discovery API.*
Why not try our 30-day free trial?
Fully managed, API-first analytics platform. Get instant access — no installation or credit card required.
Get startedHow can we apply software engineering principles to mitigate the problem of duplication?
One possible solution to this problem is to leverage a version-control system as a single source of truth for all queries and KPI definitions used for reporting. You could commit the code to a Git repository and ensure that you follow Git flow, code reviews, and all good engineering practices before applying this code in your BI tools. However, this way, we still violate the DRY principle since we are copy-pasting the code from version control to the BI tool. This approach would additionally be prone to human error: anytime we manually change something in the BI tool, but not in the Git repository, we end up in the same problem we were trying to solve using Git. And what if some queries or KPIs never get committed to Git?
Is there even a better way?
Another possible solution is to leverage a BI tool that understands this problem and tries to support you with it. One of them is GoodData. The platform allows building small components that can be reused across dashboards and analytical applications. The key component allowing this to happen is the semantic data model. Once you defined how your data is structured and from where it’s coming from, you can start creating DRY insights. Any type of metric, KPI, visualization, or table can be saved and reused across several dashboards. Additionally, you can add email alerts if any of your KPIs reaches a critical threshold.
The short screencast below demonstrates how you can start building DRY-compliant KPIs and visualizations. As long as you use the option “Save as new”, you will be creating new insights that can be reused across several dashboards
How to get started with the platform?
GoodData has been available as an analytical platform for quite a long time. But since recently, there is a cloud-native option that allows you to use the entire analytical platform packaged into a single Docker container. You can run it on your local machine by using the following command:
docker run --name gooddata -p 3000:3000 -p 5432:5432 \

\-e LICENSE_AND_PRIVACY_POLICY_ACCEPTED=YES gooddata/gooddata-cn-ce:latest
Then, you can view the UI in your browser using http://localhost:3000/. You will have to log in by email: demo@example.com and password: demo123.
For a more detailed overview, in this article, you can find step-by-step instructions showing how to build a semantic data model, create insights and build powerful visualizations.
For a Kubernetes deployment, have a look at the Helm chart that includes everything you need to scale your environment for production.
Conclusion
In this article, we investigated how to avoid duplication in analytical reports. We looked at why duplicated KPI definitions are dangerous and how we can prevent them.
Thank you for reading!
Why not try our 30-day free trial?
Fully managed, API-first analytics platform. Get instant access — no installation or credit card required.
Get startedIf you are interested in GoodData.CN, please contact us. Alternatively, sign up for a trial version of GoodData Cloud: https://www.gooddata.com/trial/
Cover image by Pixabay from Pexels | Branded content disclosure
Written by Anna Geller |

