Analytics for the Modern World - Part 3: New Technology to Tame Complex Data


This is the last in a 3 part series on complex data and analytics. In Part 1 we learned about complex data relationships, including a certain type of relationship called many-to-many. In Part 2 we learned how complex data can make analysis difficult for both business users and analytics experts alike.
This time, we will look at how to embrace the ’new normal’ of modern data complexity and make analytics even more relevant and accessible to everyone.
How did analytics fall behind?
Although the core of our analytical systems, the dimensional model, has largely stayed the same since the 1990s, software applications and the data they use have changed quite a lot. Over the last couple of decades we have moved from relatively straightforward financial, ERP and CRM applications with rigid hierarchies, to feature-rich Web applications with novel interaction patterns and far more data complexity.
However, even though dozens of platforms and tools for investigating data and delivering data visualizations have come and gone over the last 25 years, the basic analytic model, and its ability to handle complex relationships, including many-to-many relationships, has remained the same. We saw previously that most of the advice from analytics vendors is to avoid the issue, and that the available work-arounds are unattractive.
Embracing complexity
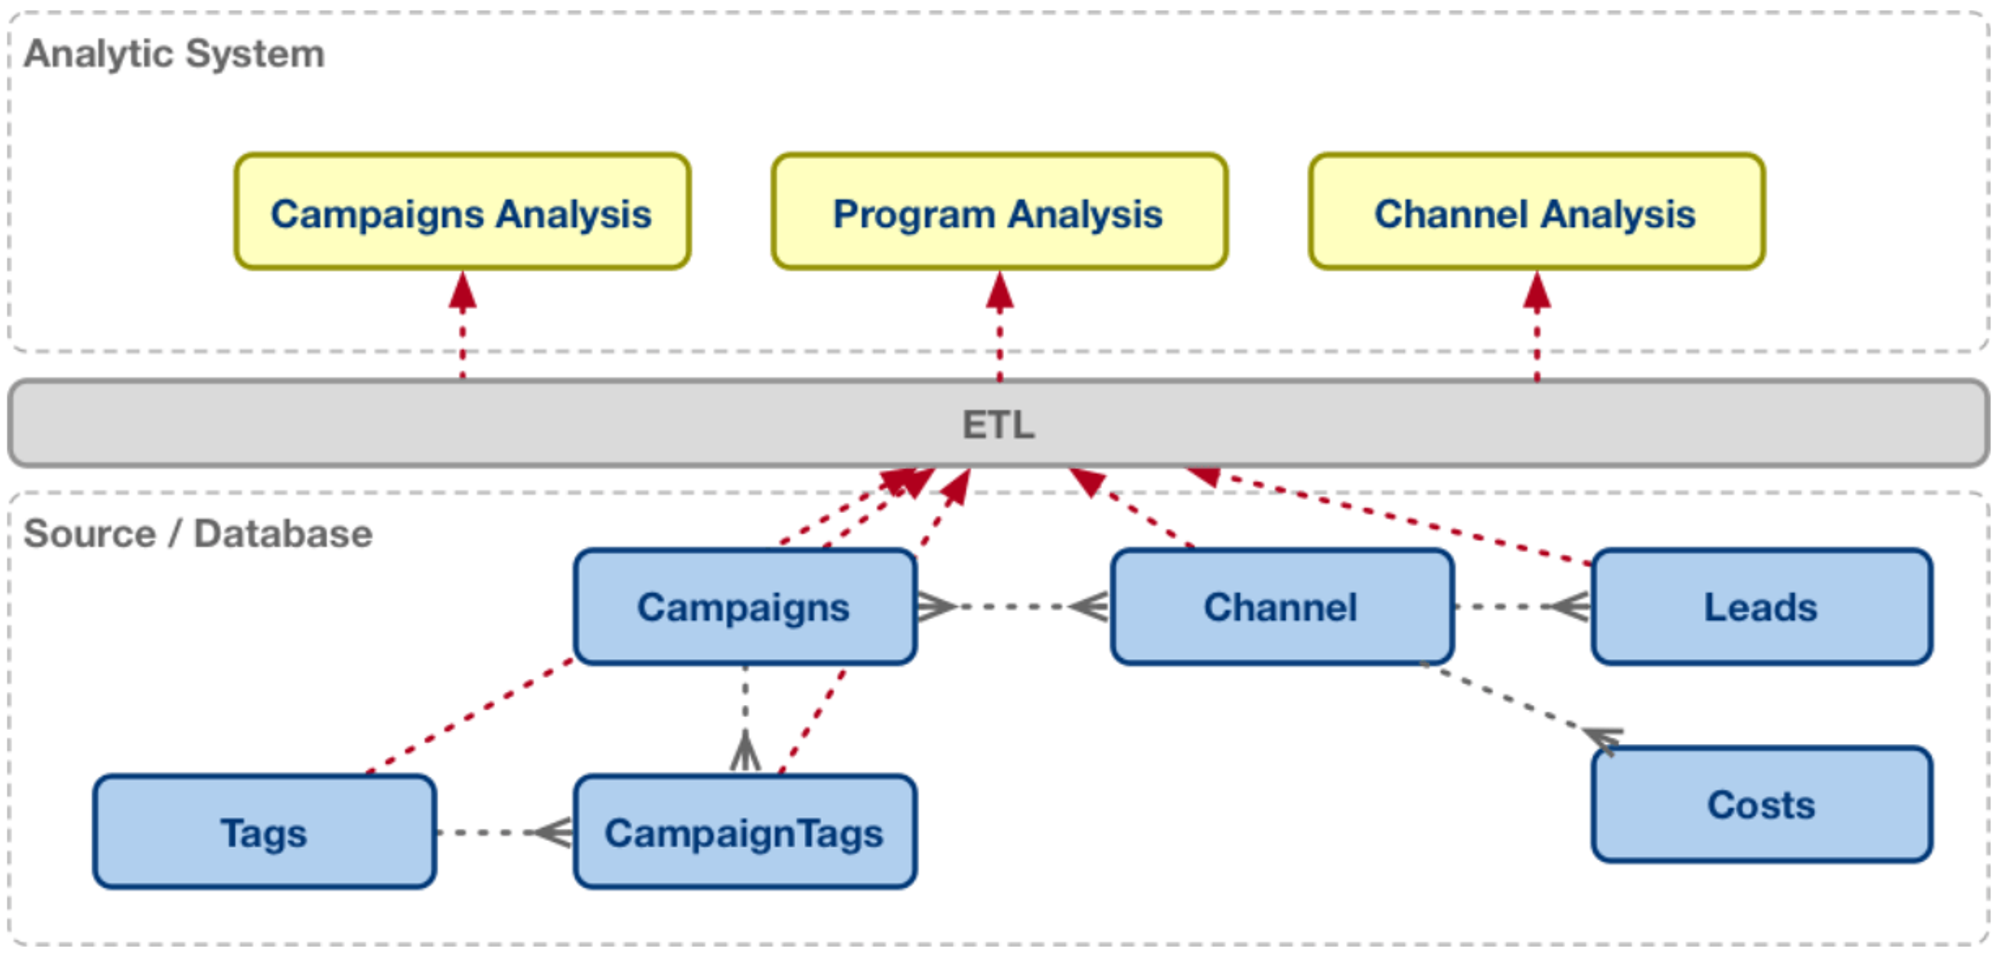
Traditional analytic systems provide fast answers by focusing on a single dataset at a time. Even in analytic systems that employ a transformation layer to ‘handle’ many-to-many, the data is joined together first, and then loaded into the analytic model, often needing multiple fact tables at different levels of detail to answer all of the business questions.
This can lead to confusion for business users as they try to match their question to the dataset. Is the answer to be found at the campaign level? The channel level?

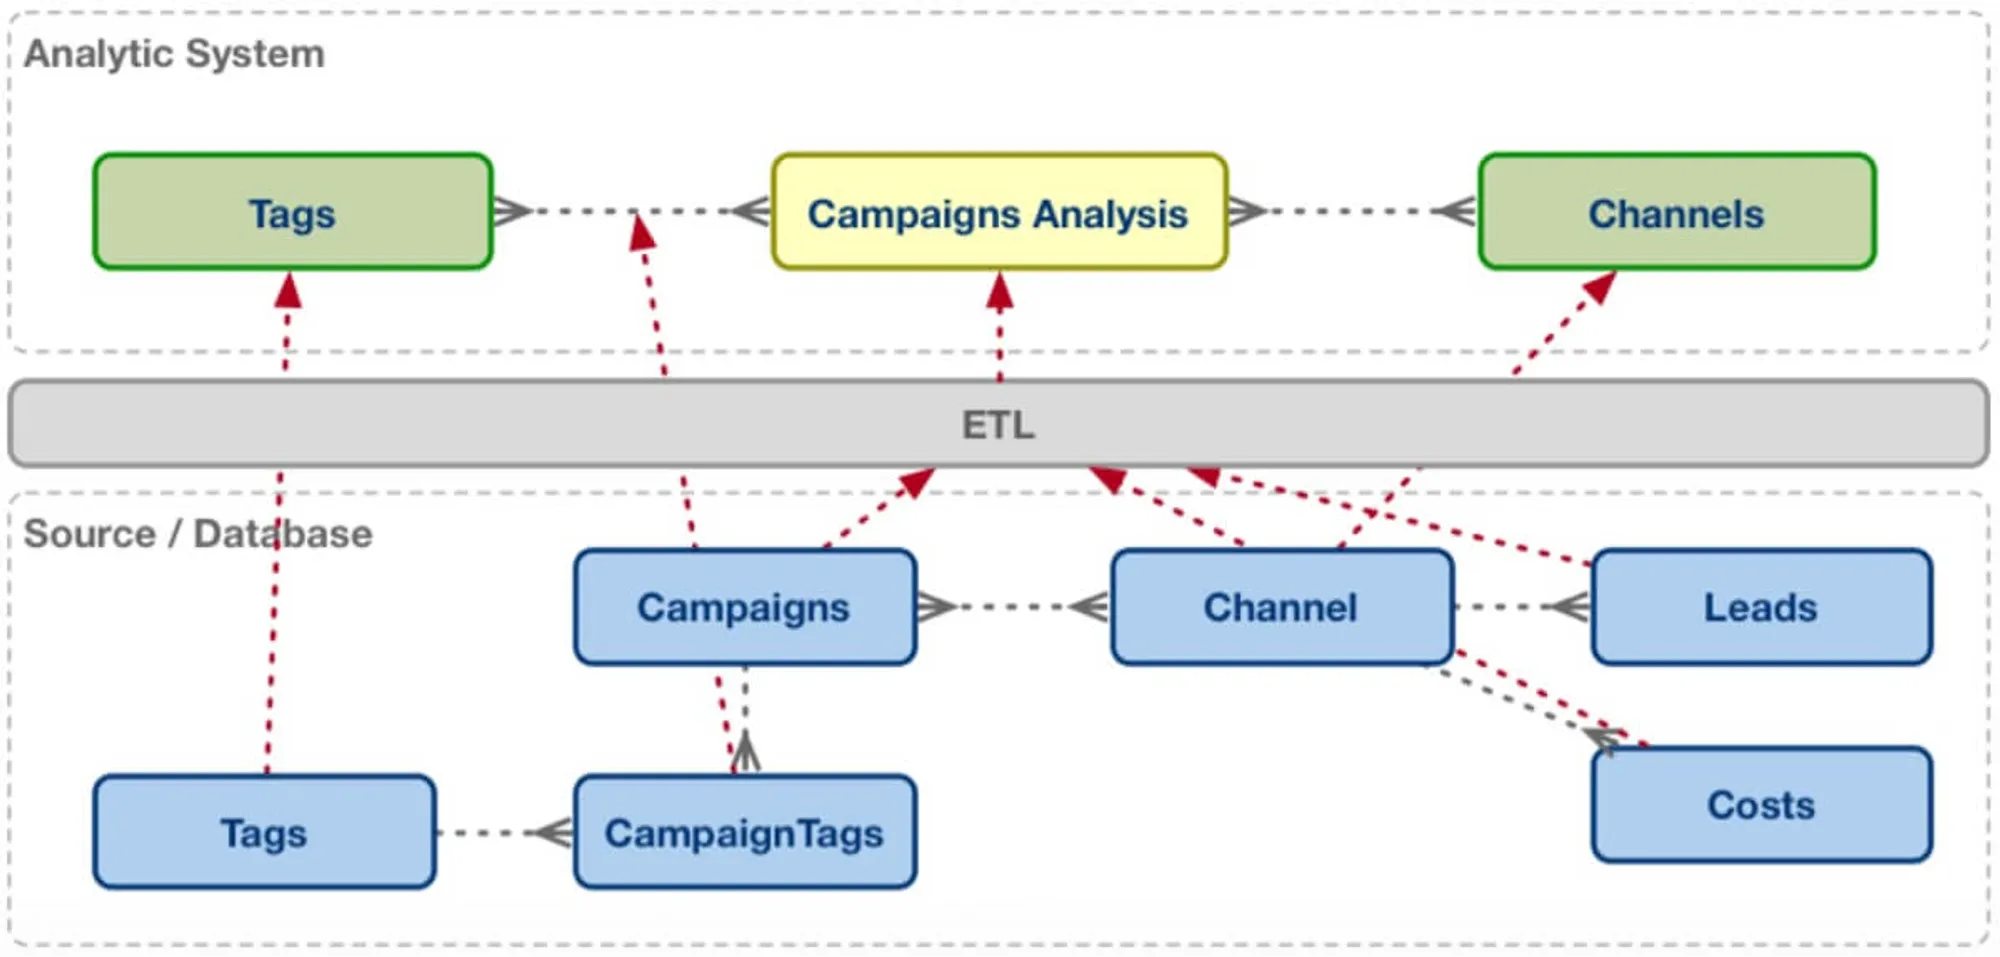
The practical answer lies in actually extending the analytic system to handle and embrace many-to-many relationships.
Instead of doing a many-to-many join on the data source, what if we could preserve some of the original relationships in the analytic system?

This would be far easier for the business user, but it is no small feat for the analytics vendor. It requires changes to the data modeling and semantic layers, and impacts almost every aspect of the design and tuning of the analytic query engine to ensure that performance remains consistent.
We’ve gone and done it
You probably already guessed where this was going. GoodData has actually done this in it’s latest release. We’ve extended our dimensional model, semantic layer, and analytic engine to make working with complex data easy and natural through native support for many-to-many relationships.
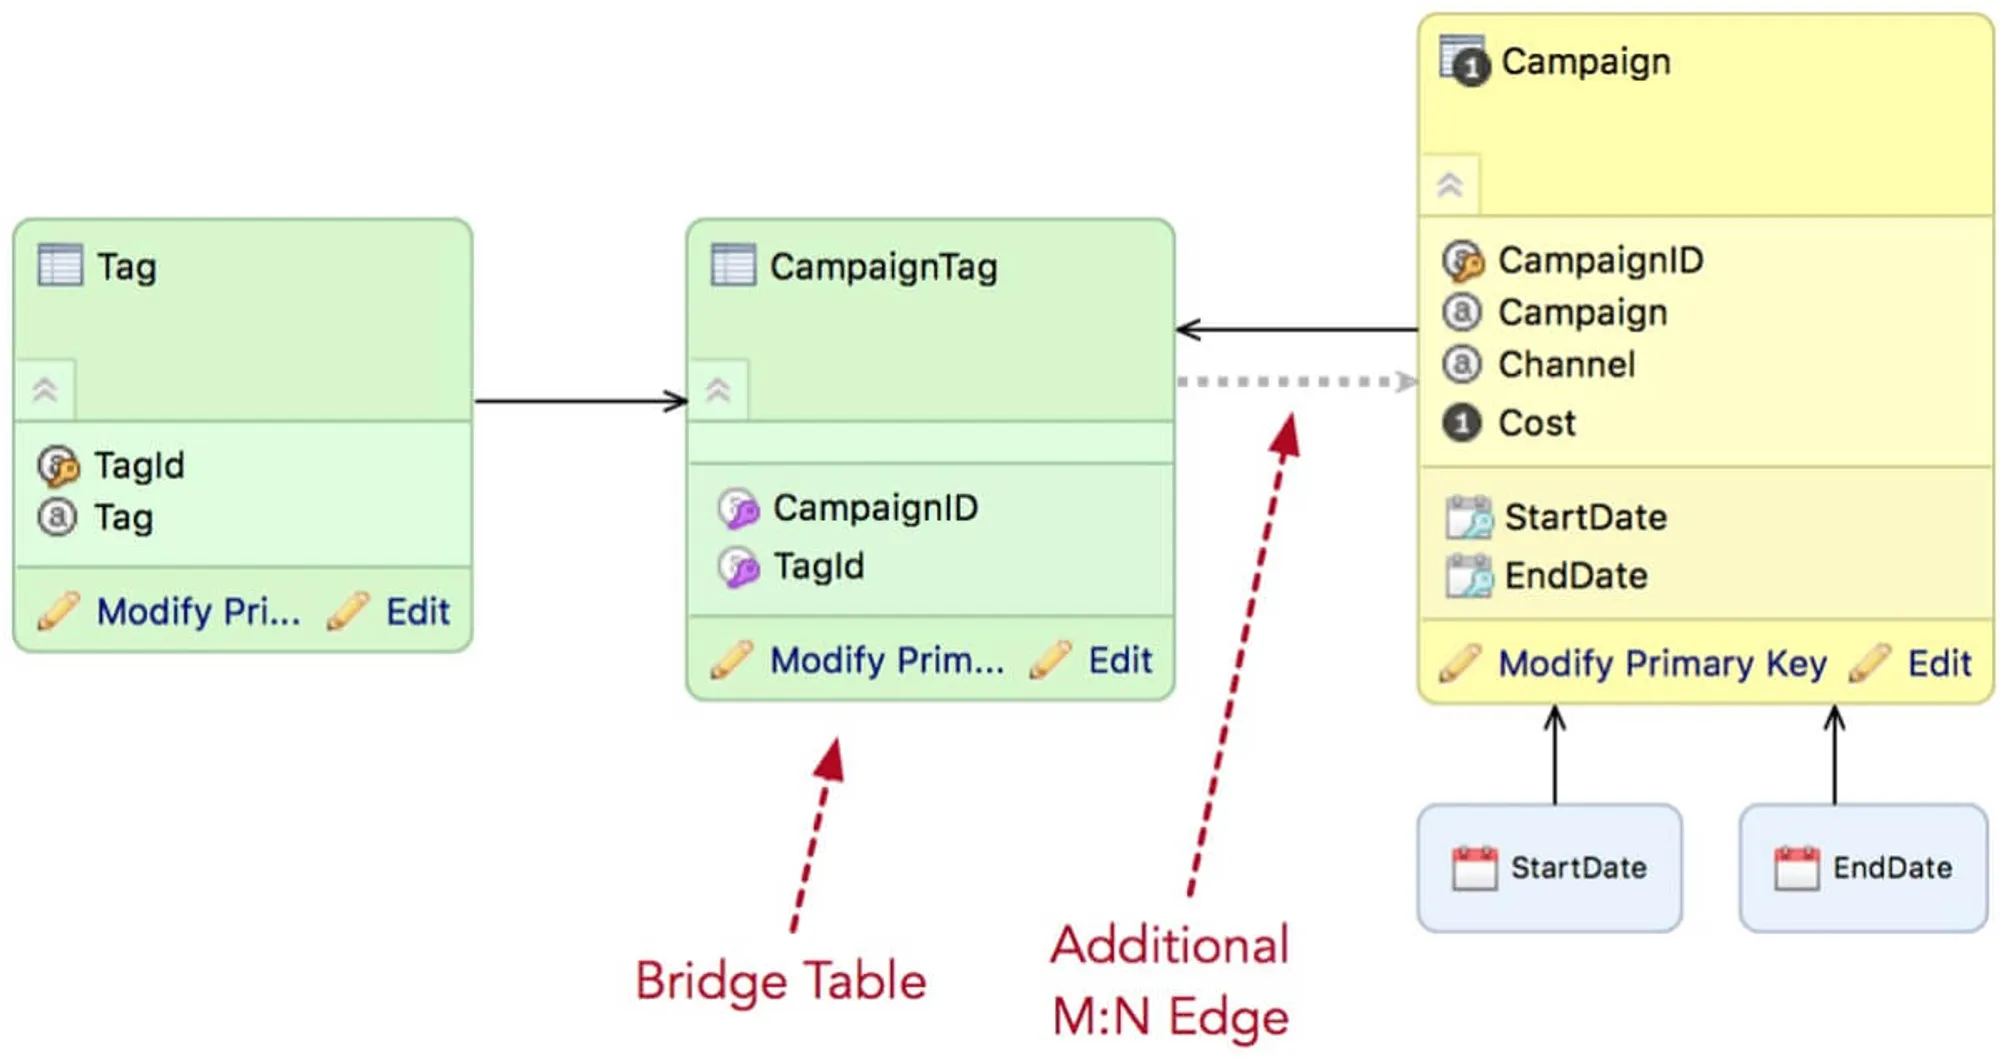
And, it’s reasonably easy to set this up. We start with the data model. This is a screenshot from GoodData’s logical data modeling tool. In addition to normal dimensional model stuff, we have a CampaignTag table that implements the many-to-many relationship between Campaign and Tag.

We can now add an additional M:N arrow to allow traversal from the dimension (Tag) through the M:N relationship (CampaignTag) to the fact table we are interested in (Campaign). This allows the query engine to answer new business questions while maintaining performance.
Another key is the semantic layer, which includes the pre-written computations or metrics that business people can use without having to completely understand the underlying data. With GoodData these metrics are written in MAQL (Multidimensional Analytic Query Language.)
One of the business questions from Part 1 was: “What is the overall spend on the ‘Developer’ and ‘Spring’16’ programs?” MAQL has been extended such that the query to this question is simply:
SELECT SUM(Cost) WHERE Tag in (Developer, Spring16)Finally, let’s execute this query and to see how the query engine handles the many-to-many relationship:

It shows the final result we are looking for — the Cost, MQLs and Cost per MQL for each of our two key programs (‘Spring16’ and ‘Developers’). But it also shows something else: notice that instead of a straight sum at the bottom of the table, the totals are many-to-many aware, which provides us with the correct totals, sums and averages. No double counting!
Analytics must evolve
As we push to make analytics more useful and available to an even wider audience of users, it’s critical that we continue to expand the analytic model, accommodating modern data patterns just as we’ve demonstrated here.
Allowing loosely structured, deeply nested, and variable kinds of data to be analyzed, understood, and eventually acted on by regular business users, will provide businesses with a better return on their analytics investment.
If you’ve made it this far, thanks for reading this blog series!


