How to monetize your data in 6 steps
Written by Harry Dix |

Table of Contents
The impact of analytics is always expanding. In just a few years, companies that once didn’t know what to do with the data they collected about their customers are now utilizing that data to build and deliver customer-facing embedded analytics offerings that have become new streams of revenue.
“Advanced Analytics is the #1 reason our customers upgrade!”
Sam Boonin, Vice President of Products, Zendesk
You could be sitting on treasure troves of data you may have not even noticed before. According to CITO Research, companies that utilize business intelligence historically move from “reactive” to “proactive” use of analytics—first using data to instigate internal changes that impact company efficiencies before eventually launching customer-facing analytics offerings that create growth.
First, let’s take a look at the four main stages of analytics in a little more detail.
The 4 Stages of Analytics
Stage 1: Reactive Analytics
In this stage, a company may collect data about how customers use its products, but doesn’t engage customers with this data beyond alerting people to problems.
Stage 2: Descriptive Analytics
By visualizing data, you’ll start to uncover patterns and trends. Through visibility into business operations, you’ll start to understand current situations, see where problems are occurring, and know where to focus your attention.
Stage 3: Diagnostic Analytics
When you start to recognize the value of your data, it’s natural to want to share this value with clients. Whether this happens as an epiphany or a request, this stage leads to ‘productization.’
Stage 4: Proactive Analytics
In this stage, companies evaluate their situation to see what new revenue can be generated by converting an analytics platform into a new product or embedding analytics into existing products.
Why not try our 30-day free trial?
Fully managed, API-first analytics platform. Get instant access — no installation or credit card required.
Get startedThe path to data monetization in 6 steps
“It can be difficult to determine which data sets offer the most value to customers,” cautions CITO Research. To help determine which will prove to be the most lucrative, the following is a recommended step-by-step approach to data monetization based on serving the needs of customers while creating additional revenue streams.
Step 1: Perform business intelligence internally
Look at the usage of your systems and products. Create data visualizations for internal use so that you can analyze who’s using most of your products and services. Determine anomalies and how you should change things based on what you are learning.
Step 2: Share visibility with your clients and partners
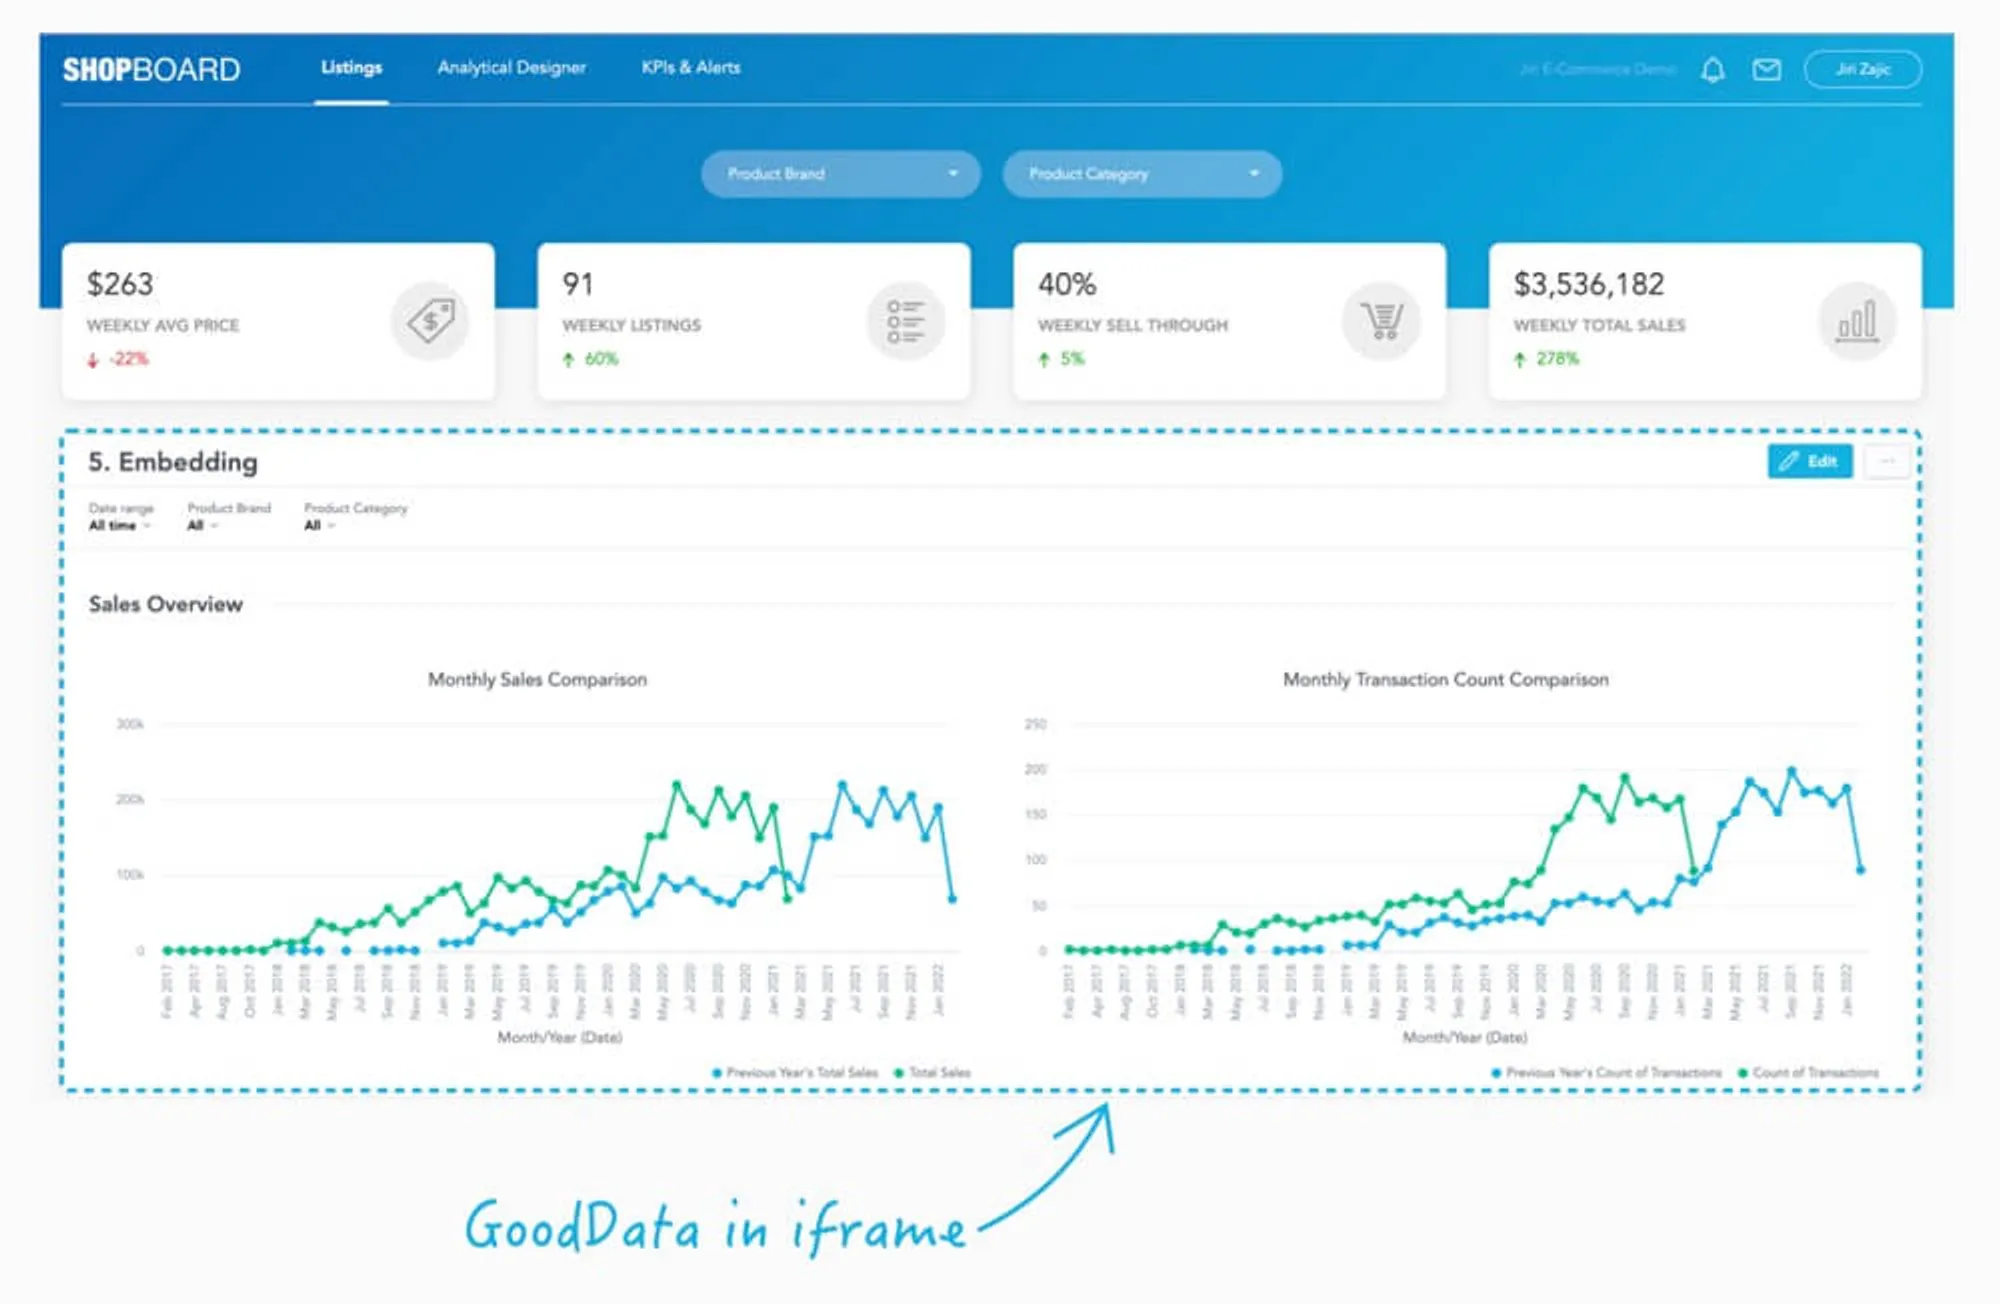
Give customers access to your data. The next logical step, after analyzing customer performance internally, is to roll out to your customers (i.e. client companies). By embedding dashboards and visualizations into your product or application you can provide customers with a access to a basic level of analytics, free of charge. This provides them with visibility into their own usage and helps spark the beginning of data monetization. For example, e-commerce companies can provide partners and suppliers with data on how they are performing, what their consumers are searching for, purchasing, and so on, and then adjust their operations accordingly.

Step 3: Add self-service or extensibility
You may not realize how valuable your data is until you see others using it. Based on your free offerings, customers will begin to ask for new views, new angles, and will likely ask you for white labeling and on-brand customization in order to provide a seamless experience for their own users or stakeholders. Your answer is “Yes, for a fee.” What is more, this is where self-service analytics becomes an invaluable solution. By providing your customers (no matter their analytics know-how) with the ability to create and customize their own dashboards, you increase analytics adoption, allowing end-users to make more informed decision with has a positive effect on their business and yours.
Step 4: Look at the information you can aggregate
You have benchmarking data that customers want — information on how they are performing compared with others. With no other objective way to gain this type of information, the aggregate data you can provide becomes extremely valuable to customers and partners. And this is where a tiered approach comes into play. With the right data analytics solution, you can provide your customers with a paid, premium level of analytics within your product with access to more information, richer insights and the aforementioned customizations.
Step 5: Find ways to personalize the data
The more specific and personalized you can make the analytics you deliver, the better. Consider mixing in external data sources like geodata, address enhancement, machine, weather, demographic, or business data to enrich the data you already have. And of course, with self-service you can give your customers the ability to customize the experience themselves.
Step 6: Keep listening to your customers
As your customers request new types of analytics, such as churn analysis, internal activity reports, or longer views of historical information, you’ll get ideas for additional data products.
Ready to learn more?
Interested in how you can extend analytical insights to your customers? Request a demo and let our experts take you on a guided tour of the GoodData platform. They’ll help you discover its rich feature set and ease of implementation as well as answer your questions.
Want to get more technical with embedded analytics and data monetization? Read our Go-to Guide to Launching Branded & Embedded Analytics or visit our embedded analytics platform page.
Why not try our 30-day free trial?
Fully managed, API-first analytics platform. Get instant access — no installation or credit card required.
Get startedWritten by Harry Dix |

