Turn Data Into Actionable Insights: 5 Steps To Apply Today


Summary
In the modern business environment, having access to vast amounts of information is no longer enough; what truly drives success is the ability to transform raw data into actionable insights. But how do you go from endless rows of numbers and metrics to clear, impactful strategies that guide decision-making? This article explores what actionable insights mean and why they matter, and outlines five practical steps to make data work harder for your business.
What are actionable insights?
Actionable insights are data-driven findings that lead to specific, meaningful actions. These insights go beyond basic data or general analytics, offering clear guidance that directly informs decision-making and providing businesses with the clarity needed to make the best choices.
How to transform data into actionable insights
Turning data into insights that inspire action involves a systematic approach. By defining clear goals, understanding the needs of your users, and using the right tools, you can turn raw data into actionable business insights that drive decisions and deliver real-world results.
Step 1: Define specific and measurable business goals
Begin with this question: What are the key drivers of revenue, expenses, and risks in the business area you are interested in? These are the areas where you will be able to leverage data analytics to make the biggest impact and achieve the best ROI on your data investment. Estimate the impact on your operations that you expect to get from using your data more effectively, and how the data insights you’ll gain will add to your bottom line.
The end goal will be different depending on your business and area of responsibility. Thinking deeply about how this applies to your situation is a key first step. Below you’ll find some examples of goals for teams in different industries:
- For a retail team: optimizing inventory management by analyzing sales patterns and fluctuations in demand.
- For a marketing team: improving campaign ROI by identifying better-performing channels and messaging.
- For a healthcare team: improving patient and hospital outcomes by identifying trends in treatment effectiveness and patient satisfaction.
Step 2: Get clear on who will be using the data insights
Who will be the consumers of these insights and what actions do you expect them to take as a result? This is a key question to consider to ensure the projected business impact is realistically attainable. For example, executives may only care about the big picture, while managers are typically more interested in specific business drivers in their area.
Make sure you communicate with the future users of your BI system and validate your assumptions. If they don’t agree that the new insights will allow them to make better decisions and achieve better results in their role, use that feedback to iterate on your planned approach. Major changes to your plan will be much more costly and difficult once the project is underway.
Step 3: Evaluate your data sources
Before you can convert raw data into actionable data insights, it’s crucial to evaluate the quality and relevance of your data sources. Start by considering the cleanliness and accuracy of the data you currently have. If your data is incomplete, outdated, or prone to errors — like an inventory system that doesn’t reflect reality due to manual workarounds — it can significantly hinder your ability to generate meaningful insights, let alone turn insights into action.
Data integration plays a key role in this process, ensuring that all relevant data from various sources is brought together seamlessly. It's also important to look beyond the data you currently have and identify opportunities to collect new types of data. Consider areas of your business where data isn’t being captured but could be through the implementation of new processes or technologies. By expanding your data sources, you open up new possibilities to uncover hidden inefficiencies, identify areas where money may be leaking from your business, and ultimately gain more control over your operations.
Step 4: Ensure you have the right tools to create actionable insights
To transform your data into actionable insights, it's essential to have the right tools in place. Depending on the complexity of your data and your business needs, this could range from basic tools like Excel spreadsheets to a comprehensive analytics platform. While Excel is a great starting point for simple data analysis and basic visualizations, as your data grows in volume and complexity, an analytics platform becomes increasingly important. An optimal analytics solution will offer powerful features, such as automated data processing, advanced analytics capabilities, and the option to embed insights into your current workflow or app — all of which are necessary for making data truly actionable.
Step 5: Create dashboards that inspire users to turn insight into action
Once you have your data and tools in place, the next step is to present the information in a way that drives action. When building your dashboards, it’s important to focus on clarity and relevance — ensure that the key insights are front and center, with visualizations that highlight trends, patterns, and anomalies.
Best practices for creating effective dashboards include using clear, intuitive layouts, incorporating interactive elements that allow users to drill down into specific data points, and ensuring the dashboard is tailored to the needs of end users. Whether a dashboard is for sales teams, marketing departments, or executives, it should be designed to empower users to make fast data-driven decisions.
Examples of actionable data insights
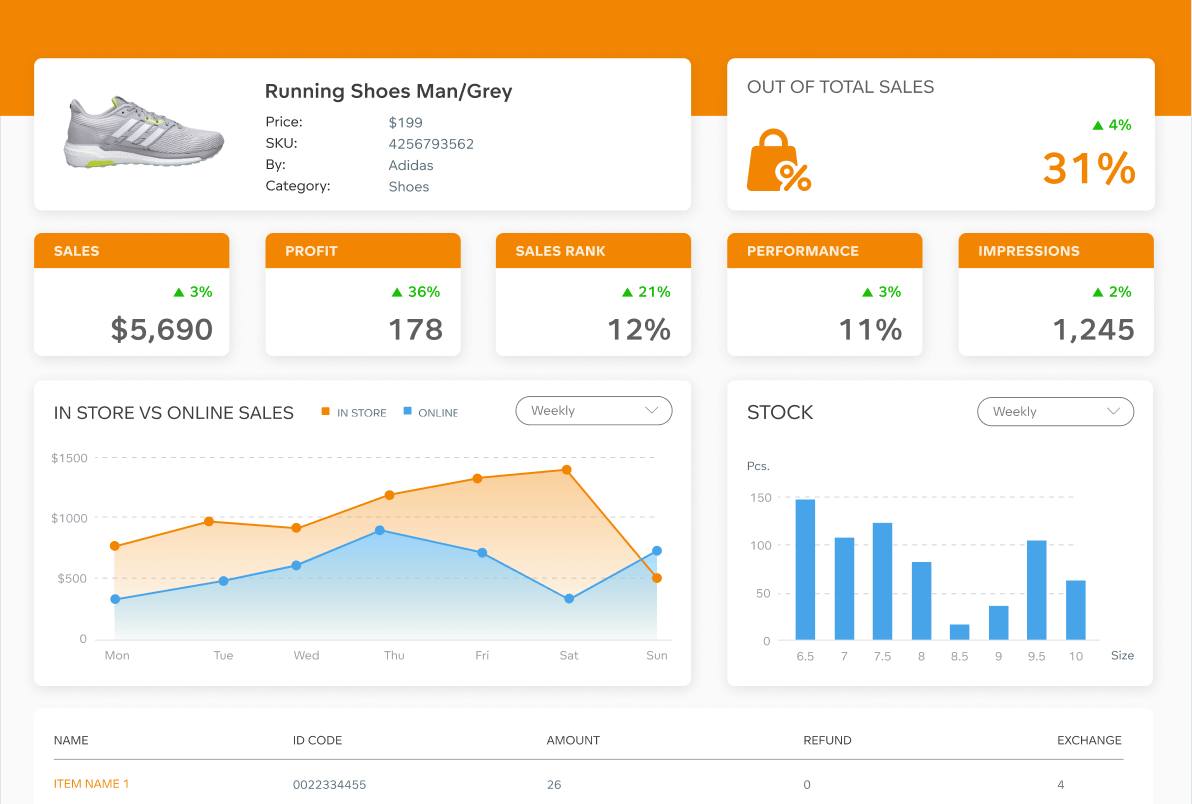
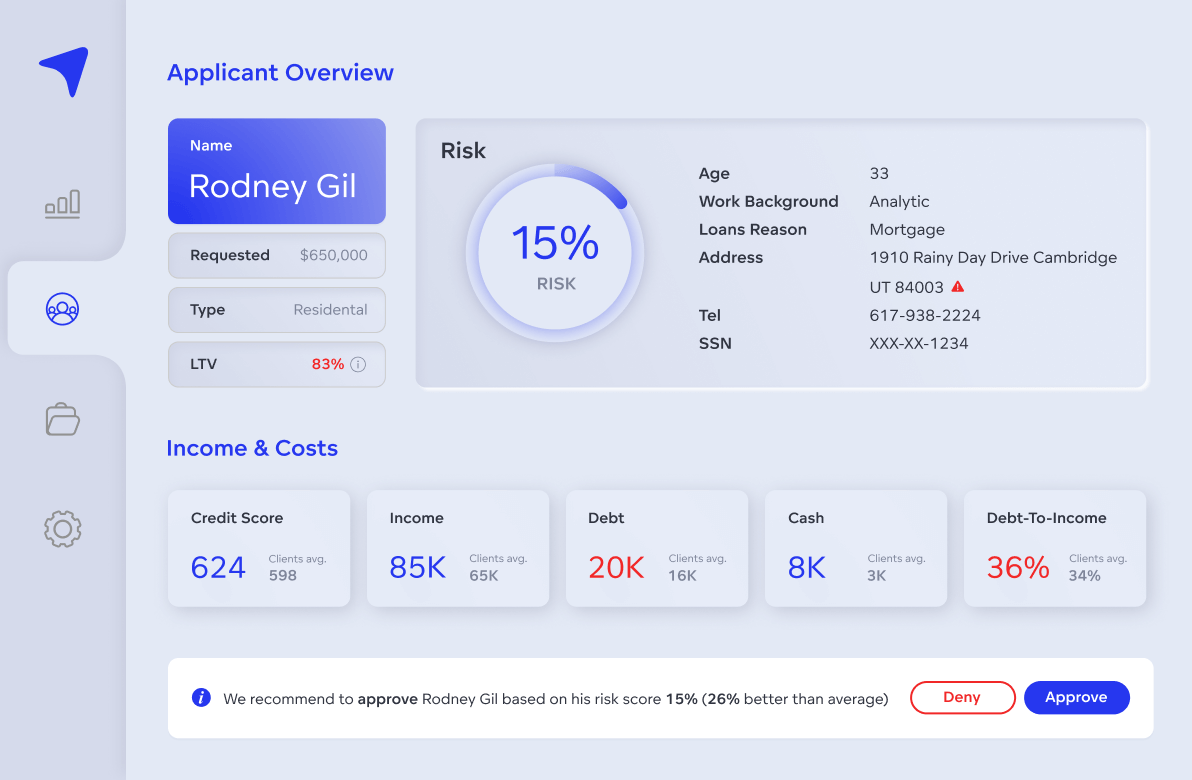
The two dashboard examples below demonstrate what actionable data insights might look like. Notice how the visualizations simplify complex data and drive decisions by highlighting key metrics and trends.

Actionable data insights on a retail dashboard
This product performance dashboard helps monitor stock levels, identify best-selling items, and understand why products are being returned. These insights lead to actionable results as the business can use them to adjust inventory, optimize product offerings, and reduce returns.

Actionable Data Insights on a Loan Application Dashboard
This dashboard provides a user-friendly, data-rich interface where loan officers can quickly assess client backgrounds and make informed decisions on loan applications. The dashboard makes it easy for them to act swiftly and accurately, streamlining the loan approval process.
The easy way to go from data to insights
With the GoodData platform, it’s easy to turn data into insights that inspire action. Integrate data from all of your sources, get real-time insights on metrics that matter, create beautiful dashboards, and embed analytics wherever they are needed. Ready to see how it works? Get a demo and start transforming your data into actionable insights today.
FAQs About Turning Data into Actionable Insights
One of the biggest challenges is translating analytical findings into specific, prioritized steps. Without a clear connection between the insight and an actionable business objective, teams often fail to follow through.
Define ownership and timelines as soon as insights are identified. Assign responsibility, track progress, and measure the impact of the actions taken so they do not remain as unused recommendations.
Common reasons include lack of alignment between analytics teams and decision-makers, unclear goals, and insights being presented without context on their potential business impact.
Visualizing insights makes patterns easier to understand, which helps stakeholders see the urgency or opportunity more clearly. This understanding increases buy-in and speeds up decision-making.
PIs serve as the bridge between an insight and a measurable goal. They help teams define success and monitor whether the actions based on an insight are producing the intended results.
Yes. Automated alerts, workflows, and data-driven triggers can prompt immediate responses, ensuring that valuable insights are acted on before opportunities are missed.


